

6.4 Assessing Normality; Normal Probability Plots
The normal probability plot is a graphical technique to identify substantive departures from normality


即如果sample满足正态分布,则1-12位置上对应的y值应该为这一列上的值
Noted:
之前统计正态分布时需要由直方图过渡到正态曲线,横坐标是每一类,在这里是样本本身。
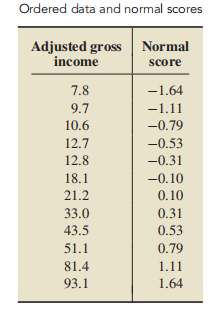
由table3一一对应,作图:
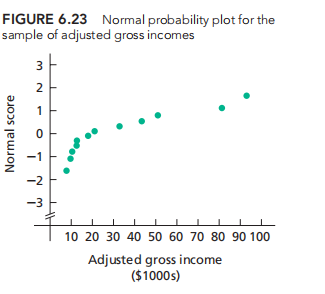
根据以上rule判断正态情况。
Note: If two or more observations in a sample are equal, you can think of them as slightly different from one another for purposes of obtaining their normal scores.
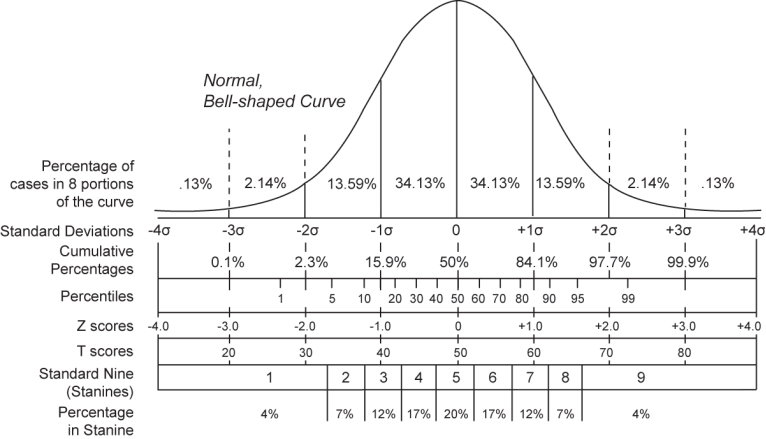
如图,可将normal-score值改为对应的percentage
A probability or percent scale is used instead of normal scores
Detecting Outliers with Normal Probability Plots
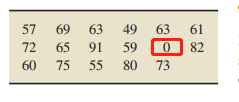
a去掉outlier得到b
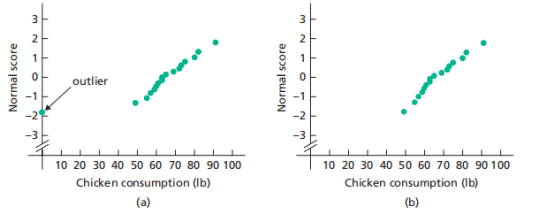
由此判断该数据为正态分布
