如何使用 JavaScript 创建交互式时间线图
AnyChart是基于JavaScript (HTML5) 的图表控件。使用AnyChart控件,可创建跨浏览器和跨平台的交互式图表和仪表。AnyChart 图表目前已被很多知名大公司所使用,可用于仪表盘、报表、数据分析、统计学、金融等领域。
AnyChar HTML5图表高度可定制且高度兼容。拥有纯JavaScript API,AnyChart图表内置客户端数据实时更新,多层次向下钻区和具体参数更新。强大的主题引擎使你通过一系列图表进行独特的演示体验,而PDF和图像输出能产出图书质量打印文档。
慧都网免费点下载AnyChart最新版

我认为我们所有人都在某个地方遇到过时间线;作为传达时间顺序信息的一种方式,经典的时间线在传达信息的深度和“酷”因素方面都是无与伦比的,当以灵巧的创意触摸完成时。那么,话虽如此,您是否想学习如何使用 JavaScript 构建一个既美观又易于创建的时间线图表?跟着我一起来,我会通过一个实际的例子带你一步一步地开发你自己的 JS 时间线。
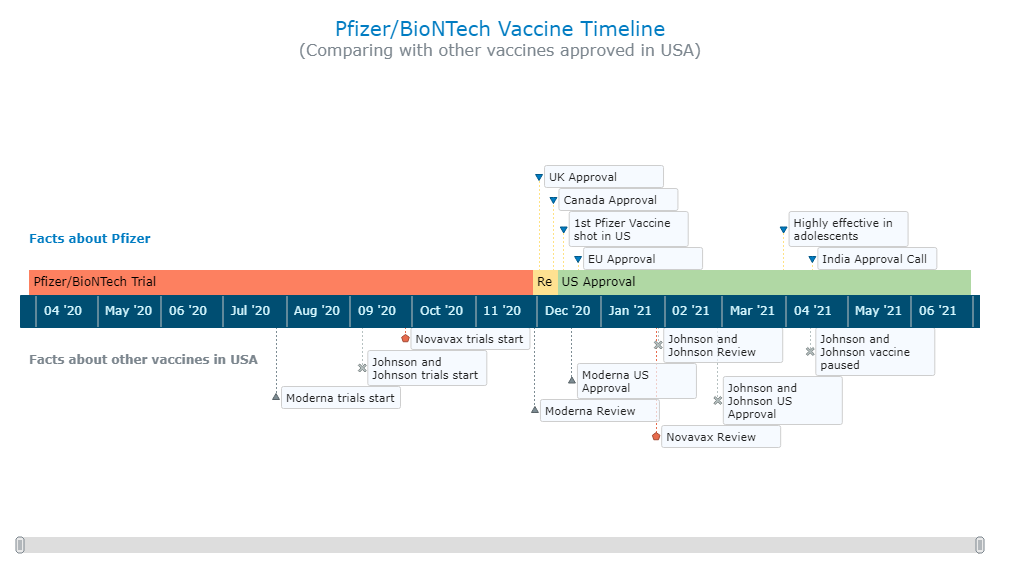
随着世界继续与 COVID-19 作斗争,人们期待已久的好消息是全球疫苗的开发。在这里,我决定建立一个互动时间表,展示辉瑞-BioNTech 疫苗在美国的开发阶段。为了添加更多上下文信息,我还想展示其他国家/地区的批准情况和一些相关事实,包括在美国批准使用的其他 3 种疫苗的开发日期。
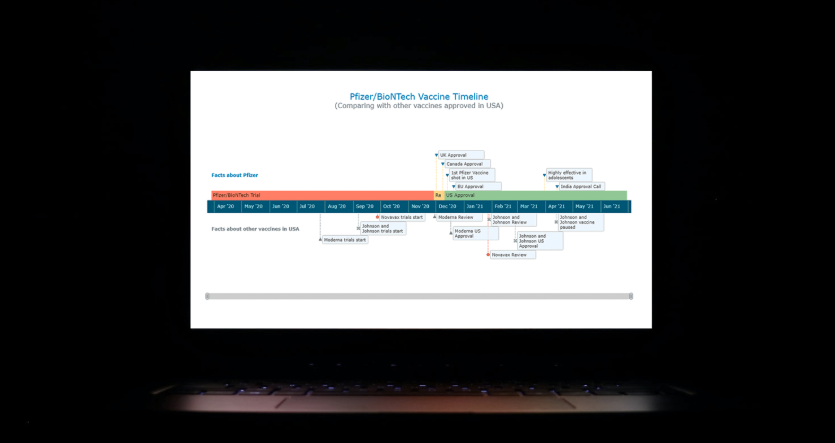
最终,成品是这样的:

分 4 步构建基本的 JavaScript 时间线图
即使没有太多的技术知识,创建图表和可视化数据实际上也很容易。当然,如果您具有 HTML 和 JavaScript 等技术的技能,则更容易掌握正在发生的事情,并且可以更快地安排更广泛的自定义。尽管如此,使用可用的JS 图表库之一进行数据可视化相当简单。所以,不用担心任何错误(好吧,不幸的是,我们不得不担心病毒),让我们第一次尝试使用 JavaScript 创建时间线。
首先要了解的是,并非所有 JavaScript 图表库都支持时间线图表。所以从逻辑上讲,首先要做的是找到一个这样做的。在本教程中,我决定使用AnyChart,因为它支持开箱即用的时间线,而且重量轻、灵活且易于使用,提供了大量文档和一个有助于练习代码的专用操场。所有这些都应该帮助您了解该过程的基础知识,无论您选择哪个特定库,这些基础知识往往都非常相似。
创建任何 JS 图表有 4 个基本步骤,包括 JS 时间线图表。他们是:
- 制作一个基本的 HTML 页面。
- 参考所有必要的脚本。
- 添加数据。
- 编写一些JS代码来配置时间线图表。
1. 制作一个基本的 HTML 页面
首先,我们必须建立一个基本的 HTML 页面。这包括开发可视化框架以及添加必要的 CSS 规则。
一个基本的 HTML 模板包含在html标签中,包含 2 个部分——ahead和 a body。页面标题以及 CSS 链接和 JS 脚本都包含在该head部分中。正文部分定义了html页面的各种组件。定义页面部分的基本方法之一是div在 HTML 中使用标记。
在这里,我创建了一个div包含时间线图表的对象,并为其指定一个标识该特定容器的 ID。我在宽度和高度参数中都设置了“100%”,以使时间线可视化占据整个页面。
<!DOCTYPE html>
<html>
  <head>
    <title>JavaScript Timeline Chart</title>
    <style type="text/css">
      html,
      body,
      #container {
        width: 100%;
        height: 100%;
        margin: 0;
        padding: 0;
      }
    </style>
  </head>
  <body>
    <div id="container"></div>
  </body>
</html>
2. 参考所有必要的脚本
其次,所有必要的 JS 脚本都需要在该<head>部分中引用。对于本教程,由于我使用的是 AnyChart 库,因此我将包含其CDN(内容交付网络)中的相应文件。
要创建时间线图表,我需要从 AnyChart添加对核心库模块的引用,这对于所有类型的图表以及特殊的时间线模块都是必需的。
<!DOCTYPE html>
<html>
  <head>
    <title>JavaScript Timeline Chart</title>
    <script src="https://cdn.anychart.com/releases/8.9.0/js/anychart-core.min.js"></script>
    <script src="https://cdn.anychart.com/releases/8.9.0/js/anychart-timeline.min.js"></script>
    <style type="text/css">
      html,
      body,
      #container {
        width: 100%;
        height: 100%;
        margin: 0;
        padding: 0;
      }
    </style>
  </head>
  <body>
    <div id="container"></div>
    <script>
      // All the JS code for the timeline chart will come here.
    </script>
  </body>
</html>
3. 添加数据
第三,让我们添加数据。我通过从各种新闻来源编译我想要的内容,手动为这个时间线图表教程创建了一个数据集,其中两个主要是NYT和Bloomberg。如果您有兴趣,我的 JSON 数据文件在这里。
在数据适配器模块的帮助下可以在 AnyChart 中加载 JSON 文件,我将其与<head>. 接下来,我使用HTML 页面正文中标记loadJsonFile内的方法<script>来加载数据文件。
<!DOCTYPE html>
<html>
  <head>
    <title>JavaScript Timeline Chart</title>
    <script src="https://cdn.anychart.com/releases/8.9.0/js/anychart-core.min.js"></script>
    <script src="https://cdn.anychart.com/releases/8.9.0/js/anychart-timeline.min.js"></script>
    <script src="https://cdn.anychart.com/releases/8.9.0/js/anychart-data-adapter.min.js"></script>
    <style type="text/css">
      html,
      body,
      #container {
        width: 100%;
        height: 100%;
        margin: 0;
        padding: 0;
      }
    </style>
  </head>
  <body>
    <div id="container"></div>
    <script>
      anychart.data.loadJsonFile('{JSON data file location}',
        function (data) {
          // Timeline chart's JS code will come here.
      });
    </script>
  </body>
</html>
现在所有准备工作都完成了,准备添加代码,以立即创建交互式 JS 时间轴图表!
4.编写一些JS代码来配置时间线图表
以这种方式创建任何图表的第一个基本步骤是添加一个包含所有代码的函数,以确保其中的整个代码仅在页面准备好后才会执行。
我在这里创建的时间线图由 3 部分组成:
- 以时间间隔显示辉瑞-BioNTech 疫苗开发阶段在美国的中心时间线,
- 将与辉瑞-BioNTech 疫苗相关的事件作为里程碑来指示的时间范围之上的时间范围,以及
- 时间线下方的标记代表在美国被批准为里程碑的其他疫苗的开发阶段日期。
创建中央时间线非常简单,但在处理时间线上方和下方的点时可能会有些不知所措。不过不要担心,因为所有代码都已注释,我将带您浏览每个代码片段。
对于中心部分,我需要做的就是使用内置功能初始化时间线图表对象并将点设置为范围系列。
// create a timeline chart
var chart = anychart.timeline();

// create main timeline data points
for (var i = 0; i < data.pfizerTimeline.length; i++) {

  // create a range series
  var series = chart.range([
    [
      data.pfizerTimeline[i].title,
      data.pfizerTimeline[i].start,
      data.pfizerTimeline[i].end
    ]
  ]);

}
为了绘制时间轴点的上方和下方,我初始化数据集,定义点的映射,并使用矩系列功能设置两个系列。
// create a data set for the top data points
var pfizerDataSet = anychart.data.set(data.pfizerFacts);

// map the top data points
var pfizerMapping = pfizerDataSet.mapAs({
  x: 'date',
  value: 'title'
});

// create the top series with moments
var pfizerMappingSeries = chart.moment(pfizerMapping);

// create a data set for the bottom data points
var otherVaccinesDataset = anychart.data.set(data.otherVaccines);

// map the bottom data set
var otherVaccinesDatasetMapping = otherVaccinesDataset.mapAs({
  x: 'date',
  value: 'title'
});

// create the bottom series with moments
var otherVaccinesSeries = chart.moment(otherVaccinesDatasetMapping);
现在我只需要将时间线的比例设置为 1 个月并添加一个滚动条,以允许查看时间线的特定部分。
// set the chart scale levels
chart.scale().zoomLevels([
  [
    { unit: 'month', count: 1 }
  ]
]);

// enable the chart scroller
chart.scroller().enabled(true);
最后,我为图表添加了一个标题,设置了为图表定义的容器,并绘制了实际的时间线。
// set the chart's title
chart.title('Pfizer/BioNTech Vaccine Timeline');

// set the container id for the chart
chart.container('container');

// initiate the chart drawing
chart.draw();
就是这样!功能齐全的交互式时间轴图表已全部设置完毕!
欢迎您在CodePen [或AnyChart Playground ]上查看和使用带有完整 JS/CSS/HTML 代码的交互式时间线图表的初始版本。
<!DOCTYPE html>
<html>
  <head>
    <title>JavaScript Timeline Chart</title>
    <script src="https://cdn.anychart.com/releases/8.9.0/js/anychart-core.min.js"></script>
    <script src="https://cdn.anychart.com/releases/8.9.0/js/anychart-timeline.min.js"></script>
    <script src="https://cdn.anychart.com/releases/8.9.0/js/anychart-data-adapter.min.js"></script>
    <style type="text/css">
      html,
      body,
      #container {
        width: 100%;
        height: 100%;
        margin: 0;
        padding: 0;
      }
    </style>
  </head>
  <body>
    <div id="container"></div>
    <script>
      anychart.onDocumentReady(function () {
        anychart.data.loadJsonFile(
        'https://gist.githubusercontent.com/shacheeswadia/c65106bb00db4236140b4f6052fde55a/raw/9ec2af927a8bb81433f2236b41c161260aa4950d/pfizer-comparison-timeline',
          function (data) {

            // create a timeline chart
            var chart = anychart.timeline();

            // create main timeline data points
            for (var i = 0; i < data.pfizerTimeline.length; i++) {
              // create a range series
              var series = chart.range([
                [
                  data.pfizerTimeline[i].title,
                  data.pfizerTimeline[i].start,
                  data.pfizerTimeline[i].end
                ]
              ]);
            }

            // create a data set for the top data points
            var pfizerDataSet = anychart.data.set(data.pfizerFacts);

            // map the top data points
            var pfizerMapping = pfizerDataSet.mapAs({
              x: 'date',
              value: 'title'
            });

            // create the top series with moments
            var pfizerMappingSeries = chart.moment(pfizerMapping);

            // create a data set for the bottom data points
            var otherVaccinesDataset = anychart.data.set(data.otherVaccines);

            // map the bottom data set
            var otherVaccinesDatasetMapping = otherVaccinesDataset.mapAs({
              x: 'date',
              value: 'title'
            });

            // create the bottom series with moments
            var otherVaccinesSeries = chart.moment(otherVaccinesDatasetMapping);

            // set the chart scale levels
            chart.scale().zoomLevels([
              [
                { unit: 'month', count: 1 }
              ]
            ]);

            // enable the chart scroller
            chart.scroller().enabled(true);

            // set the chart's title
            chart.title('PFizer/BioNTech Vaccine Timeline');

            // set the container id for the chart
            chart.container('container');

            // initiate the chart drawing
            chart.draw();

          }
        );
      });
    </script>
  </body>
</html>
自定义 JS 时间线图
像 AnyChart 这样的 JavaScript 库不仅简化了创建基础可视化的过程,而且还提供了轻松定制的选项。通过一些代码调整(或更多),如果您愿意,您可以对图表进行一些快速有效的更改。
时间线的颜色和标记
使图表看起来个性化的简单定制就是改变颜色。由于开发阶段包括试验、审查和批准,我使用了红色到绿色的色谱——交通信号颜色。我还更改了顶级系列的标记颜色,并为它使用了辉瑞的标志性蓝色。
// create main timeline data points
for (var i = 0; i < data.pfizerTimeline.length; i++) {

  // create a range series
  var series = chart.range([
    [
      data.pfizerTimeline[i].title,
      data.pfizerTimeline[i].start,
      data.pfizerTimeline[i].end
    ]
  ])
  // using function and if conditions to color the timeline parts according to the phase
  .fill(function(d){
    // red color for the trial phase
    if(d.name == "Pfizer/BioNTech Trial"){
      return "#FD8060"
    }else if(d.name == "Review"){ // yellow color for the review phase
      return "#FEE191"
    }
    return "#B0D8A4" // green color for the approval phase
  })
  .stroke("none");
}

...

// customize the markers
pfizerMappingSeries.normal().markers().fill("#007cc2");
由于底部系列包含三种不同疫苗的信息,我为所有三种疫苗创建了不同的系列,然后自动为每个系列分配不同的标记。
工具提示自定义
此外,我想为时间线中的每个数据点显示更多信息,因此我将其作为交互功能添加到图表工具提示中,包括对外观进行一些自定义。
// set the tooltip settings for the main timeline series
series
  .tooltip()
  .useHtml(true)
  .titleFormat('{%x}') // the event title
  .format(
    // the description field in the data contains additonal information
    data.pfizerTimeline[i].description
    // using breakline (<br>) tag to add space, bold (<b>) tag to emphasize
    // indicating the start and end of each timeline phase with start and end data fields
    + '<br/><br/>Start: <b>{%start}{type:date}</b><br/>End: <b>{%end}{type:date}</b>'
  );
文本标记和标题
时间线看起来差不多准备好了,所以是时候进行最后的润色了。我将格式化标题并添加副标题以使其看起来更好。然后,我将为中央时间线上方和下方的不同系列添加文本标记,以便事件更具解释性。
// set the chart's title
chart
  .title()
  .enabled(true)
  .useHtml(true)
  .text(
    '<span style = "color: #007cc2; font-size:20px;">PFizer/BioNTech Vaccine Timeline</span>' +
    '<br/><span style="font-size: 16px;">(Comparing with other vaccines approved in USA)</span>'
  );

...

// create two text markers
var textMarker1 = chart.textMarker(0);
var textMarker2 = chart.textMarker(1);

// set the values of the markers
textMarker1.value(data.pfizerTimeline[0].start);
textMarker2.value(data.pfizerTimeline[0].start);

// set the text of the markers
textMarker1.useHtml(true);
textMarker1.text(
  "Facts about Pfizer");
textMarker2.text(
  "Facts about other vaccines in USA");

// configure the position of the markers
textMarker1.anchor("leftcenter");
textMarker2.anchor("leftcenter");
textMarker1.rotation(0);
textMarker1.offsetY(160);
textMarker2.rotation(0);
textMarker2.offsetY(300);

// configure the font of the markers
textMarker1.fontColor("#007cc2");
textMarker1.fontWeight(600);
textMarker2.fontWeight(600);
在这个循序渐进的教程中,我展示了获取 JS 时间线图表是多么容易,不仅仅是启动和运行,还有如何将它变为现实。时间线有很多自定义选项,您可以通过此处的文档继续探索。借助良好的 JS 库,可以轻松创建多功能和交互式 JavaScript 图表。您可以查看各种其他图表选项或尝试使用其他 JavaScript 图表库来满足您的数据可视化需求。
请随时问我任何问题或让我知道您自己的 JS 时间线结果如何。保持安全并及时注射疫苗以对抗这种流行病!
相关产品推荐:
AnyGantt——构建复杂且内容丰富的甘特图的理想工具
AnyStock——基于XML/JSON的Flash金融图表解决方案
AnyMap——可交互式地图

