python+playwright 学习-88 Allure 报告带上Trace Viewer 日志追踪
用例执行失败时,我们希望能查看日志,追踪页面操作的每个详细过程
Trace Viewer 日志追踪
Playwright Trace Viewer 是一个 GUI 工具,可让您探索记录的 Playwright 测试跟踪,这意味着您可以在测试的每个操作中前后移动,并直观地查看每个操作期间发生的情况。
可以使用browser_context.tracing API 记录跟踪,如下所示:
browser = chromium.launch()
context = browser.new_context()

# Start tracing before creating / navigating a page.
context.tracing.start(screenshots=True, snapshots=True, sources=True)

page = context.new_page()
page.goto("https://playwright.dev")

# Stop tracing and export it into a zip archive.
context.tracing.stop(path = "trace.zip")
有2种方法可以查看追踪日志
方法1. 通过命令行查看操作过程追踪
>playwright show-trace trace.zip
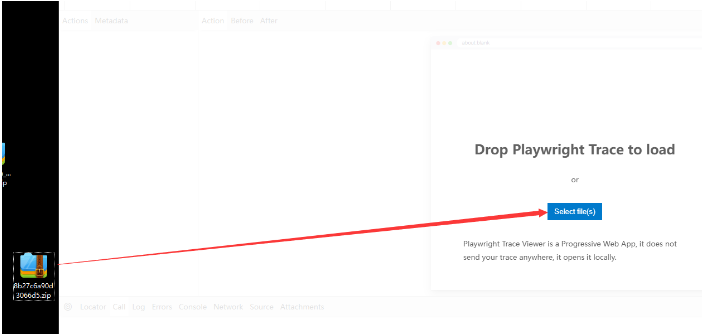
方法2.访问 https://trace.playwright.dev/ 选择录制好的trace.zip文件即可打开

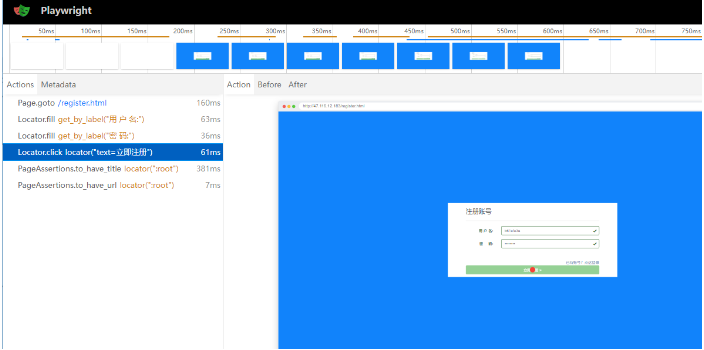
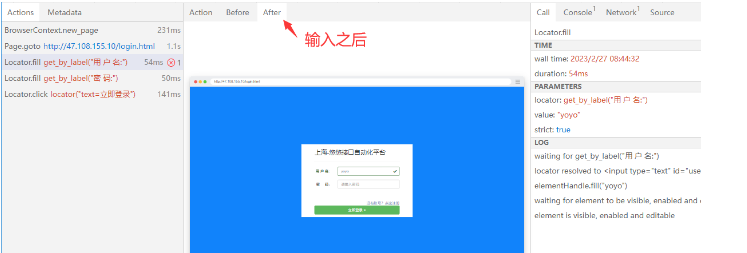
它可以清晰的记录代码的每个步骤
chunk 分块记录
如果您想在同一BrowserContext上记录多个跟踪,请使用trace.start()一次,然后使用trace.sart_chunk()和trace.stop_chuck()创建多个跟踪块。
使用示例
from playwright.sync_api import Playwright, sync_playwright, expect
# 上海悠悠 wx:283340479# blog:https://www.cnblogs.com/yoyoketang/


def run(playwright: Playwright) -> None:
    browser = playwright.chromium.launch(headless=False)
    context = browser.new_context()

    # Start tracing before creating / navigating a page.
    # 配置追踪开始
    context.tracing.start(screenshots=True, snapshots=True, sources=True)
    # 打开页面
    page = context.new_page()

    context.tracing.start_chunk()
    page.goto('http://47.116.12.183/login.html')
    context.tracing.stop_chunk(path='xx1.zip')

    context.tracing.start_chunk()
    page.get_by_label("用 户 名:").fill("yoyo")
    page.get_by_label("密     码:").fill("123456")
    page.locator("text=立即登录").click()
    context.tracing.stop_chunk(path='xx2.zip')

    # context.tracing.stop(path="trace.zip")  # 结束追踪的地方,添加 tracing 的结束配置。
    context.close()
    browser.close()


with sync_playwright() as playwright:
    run(playwright)
这样就可以分块记录日志
pytest-playwright 中记录日志
在pytest-playwright插件中,本来是自带日志记录的,我自己改写了一些功能,加入到allure报告附件中了。
先在context中启动日志追踪,相关修改如下:
@pytest.fixture(scope="session")
def context(
    browser: Browser,
    browser_context_args: Dict,
    pytestconfig: Any,
    request: pytest.FixtureRequest,
) -> Generator[BrowserContext, None, None]:
    # pages: List[Page] = []
    context = browser.new_context(**browser_context_args)
    # context.on("page", lambda page: pages.append(page))
    # -------------- tracing 相关功能看这段 start----------
    tracing_option = pytestconfig.getoption("--tracing")
    capture_trace = tracing_option in ["on", "retain-on-failure"]
    if capture_trace:
        context.tracing.start(
            name=slugify(request.node.nodeid),
            screenshots=True,
            snapshots=True,
            sources=True,
        )
     # -------------- tracing 相关功能看这段 end----------

    yield context

    context.close()
在page标签页中分块记录,每个page标签页代表一次用例的执行开始到结束
@pytest.fixture
def page(context: BrowserContext,
         pytestconfig: Any,
         request: pytest.FixtureRequest,
         ) -> Generator[Page, None, None]:
    pages: List[Page] = []
    context.on("page", lambda page: pages.append(page))

    page = context.new_page()
    # ---------- 每个标签页 加入日志 -------
    tracing_option = pytestconfig.getoption("--tracing")
    capture_trace = tracing_option in ["on", "retain-on-failure"]
    if capture_trace:
        context.tracing.start_chunk()
    yield page
    # ---------- 保存日志 ---------
    failed = request.node.rep_call.failed if hasattr(request.node, "rep_call") else True
    tracing_option = pytestconfig.getoption("--tracing")
    capture_trace = tracing_option in ["on", "retain-on-failure"]
    if capture_trace:
        retain_trace = tracing_option == "on" or (
                failed and tracing_option == "retain-on-failure"
        )
        if retain_trace:
            # 仅用例失败的时候抓取
            trace_path = _build_artifact_test_folder(pytestconfig, request, "trace.zip")
            context.tracing.stop_chunk(path=trace_path)
            # 添加到allure报告附件
            allure.attach.file(trace_path, name=f"{request.node.name}-trace",  attachment_type='application/zip',
                               extension='.zip'
                               )
        else:
            context.tracing.stop_chunk()
其它日志无关代码,我就不贴了,自己看源代码。
Trace 日志开关
--tracing=on 设置每个用例都捕获日志
[pytest]

addopts = --headed
          --tracing=on
--tracing=retain-on-failure 仅用例失败的时候捕获日志
[pytest]

addopts = --headed
          --tracing=retain-on-failure
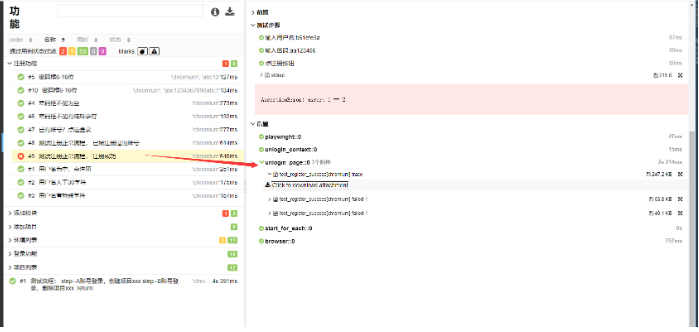
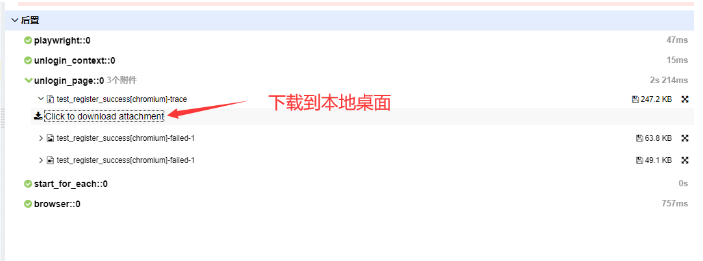
allure报告显示
执行用例
pytest --alluredir ./report
生成allure报告
allure serve ./report
查看报错用例
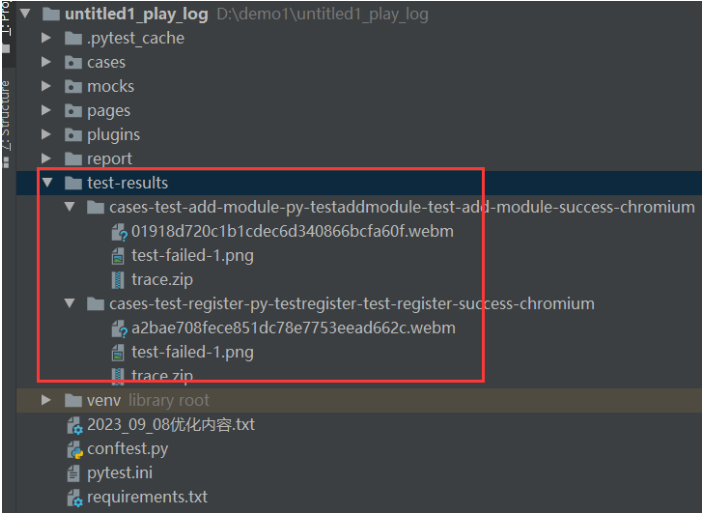
在项目test-results目录也会记录trace.zip
点击下载到桌面
访问 https://trace.playwright.dev/