
GeoServer调用矢量切片
背景
项目需要显示矢量作为底图,开始是用了url的方式加载geojson数据,但是最近发现ol加载geojson数据很慢:

这么点数据要加载这么久,之前倒是没发现这种问题。
解决方案
矢量切片。
步骤
①GeoServer官网下载切片插件
我用的版本是2.14.3

②下载后的文件解压后复制到此路径:C:\Program Files (x86)\GeoServer 2.14.3\webapps\geoserver\WEB-INF\lib下,重启GeoServer,进入编辑图层可以看到 :
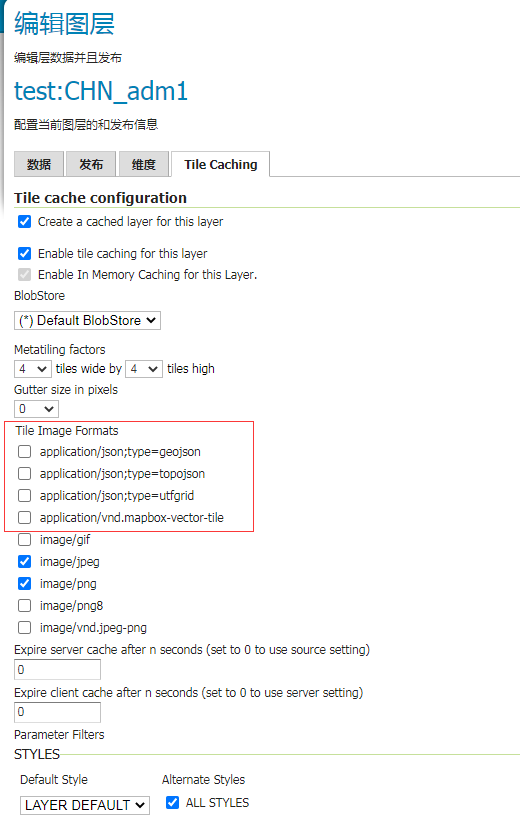
③点击Tile Caching目录下的Tile Layers,选择图层,选中新增的图片格式:


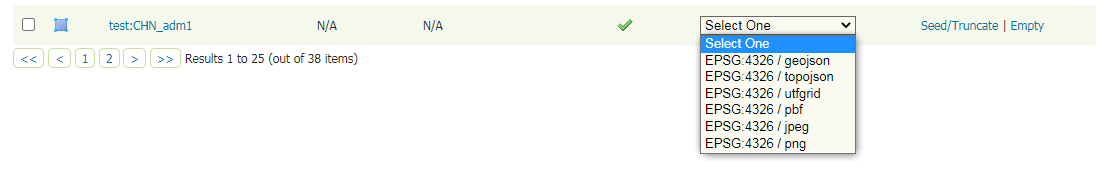
然后返回Tile Layers,找到要切片的图层,点击Select One,说明已经成功:
源码:


 1 <!DOCTYPE html>
 2 <html>
 3
 4 <head>
 5   <title>GeoJSON 矢量切片</title>
 6   <link rel="stylesheet" href="css/ol.css" type="text/css">
 7   <link rel="stylesheet" href="css/ol-ext.css" type="text/css">
 8
 9
10   <style>
11
12   </style>
13   <!-- The line below is only needed for old environments like Internet Explorer and Android 4.x -->
14   <script src="scripts/jquery.min.js"></script>
15   <script src="https://cdn.polyfill.io/v2/polyfill.min.js?features=requestAnimationFrame,Element.prototype.classList,URL"></script>
16
17   <script src="scripts/ol.js"></script>
18   <script src="scripts/ol-ext.js"></script>
19
20
21 </head>
22
23 <body>
24   <div id="map" class="map"></div>
25   <script>
26     // 创建一个视图
27     var coordinate = [120.3993,31.08125];
28     // var coor = ol.proj.transform(coordinate, 'EPSG:4326', 'EPSG:3857');
29
30     var view = new ol.View({
31       center: coordinate,
32       zoom: 6,
33         minZoom: 0,
34         maxZoom: 25,
35         projection: 'EPSG:4326',
36     });
37
38       var projection4326 = new ol.proj.Projection({
39         code: 'EPSG:4326',
40         units: 'degrees',
41         axisOrientation: 'neu'
42     });
43
44     var BaseMapVectorLayerTile = new ol.layer.VectorTile({
45         title: "baseMap_Tile",
46         style:  new ol.style.Style({
47         stroke: new ol.style.Stroke({
48             color: '#888888',//#38D0F0
49             width: 2
50         }),
51         fill: new ol.style.Fill({
52             color: 'white'
53         }),
54         text: new ol.style.Text({ //文本样式
55             font: 'bold 12px serif',
56             overflow: true,
57             fill: new ol.style.Fill({
58                 color: '#000'
59             }),
60             stroke: new ol.style.Stroke({
61                 color: '#fff',
62                 width: 3
63             })
64         })
65     }),
66         projection: projection4326,
67         //矢量切片数据
68         source: new ol.source.VectorTile({
69             projeciton: projection4326,
70             format: new ol.format.GeoJSON(),
71             tileGrid: ol.tilegrid.createXYZ({
72                 extent: ol.proj.get('EPSG:4326').getExtent(),
73                 maxZoom: 25
74             }),
75             tilePixelRatio: 1,
76             //发出获取切片的请求
77             tileUrlFunction: function (tileCoord) {
78                 return 'http://localhost:8080/geoserver/gwc/service/tms/1.0.0/test%3ACHN_adm1@EPSG%3A4326@geojson/' + (tileCoord[0] - 1)
79                     + '/' + tileCoord[1] + '/' + (Math.pow(2, tileCoord[0] - 1) + tileCoord[2]) + '.geojson';
80             }
81         })
82     });
83     // 创建第一个地图
84     var map = new ol.Map({
85       layers: [
86         new ol.layer.Tile({ source: new ol.source.OSM() }),
87         BaseMapVectorLayerTile,
88       ],
89       view: view,
90       target: 'map'
91     });
92
93   </script>
94 </body>
95
96 </html>
参考网址
【GISER && Painter】矢量切片(Vector tile)
【GISER && Painter】矢量切片(Vector tile)番外一:Proj4js
临时收藏:
GIS 矢量切片(Vector Tile)-地图定制化的时代已经悄悄来临


【推荐】国内首个AI IDE,深度理解中文开发场景,立即下载体验Trae
【推荐】编程新体验,更懂你的AI,立即体验豆包MarsCode编程助手
【推荐】抖音旗下AI助手豆包,你的智能百科全书,全免费不限次数
【推荐】轻量又高性能的 SSH 工具 IShell:AI 加持,快人一步
· 基于Microsoft.Extensions.AI核心库实现RAG应用
· Linux系列:如何用heaptrack跟踪.NET程序的非托管内存泄露
· 开发者必知的日志记录最佳实践
· SQL Server 2025 AI相关能力初探
· Linux系列:如何用 C#调用 C方法造成内存泄露
· 震惊!C++程序真的从main开始吗?99%的程序员都答错了
· 【硬核科普】Trae如何「偷看」你的代码?零基础破解AI编程运行原理
· 单元测试从入门到精通
· 上周热点回顾(3.3-3.9)
· Vue3状态管理终极指南:Pinia保姆级教程