

React中用EChart写面积图
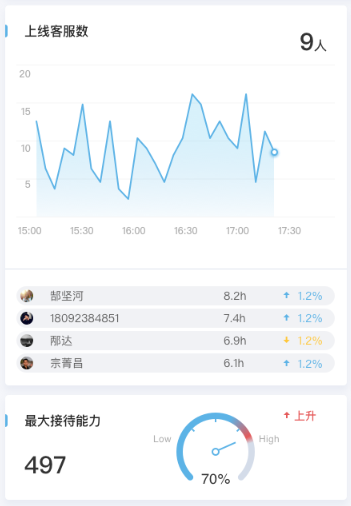
UED出的设计图如下:
实际展示效果如下:
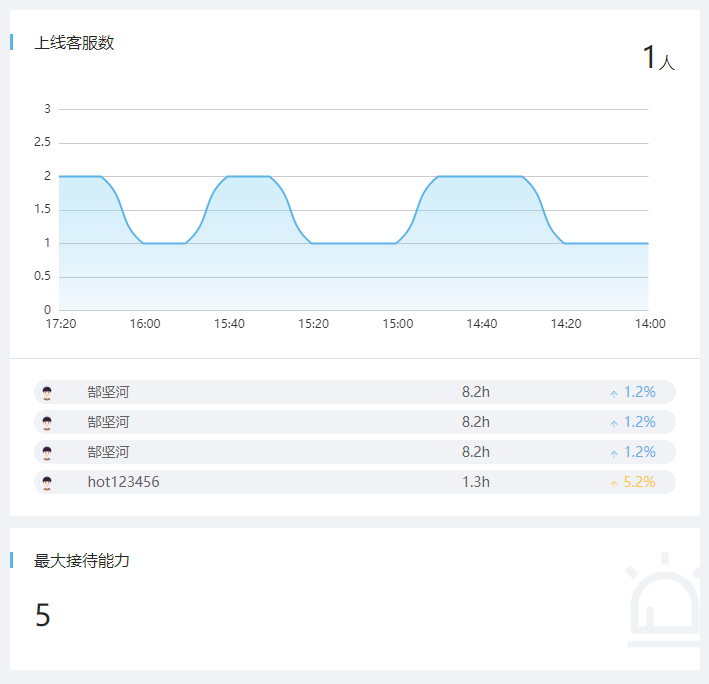
调取的数据如下:
"staffCountList":[
            {
                "time":"2019-12-24 17:20",
                "staffCount":2
            },
            {
                "time":"2019-12-24 17:10",
                "staffCount":2
            },
            {
                "time":"2019-12-24 16:00",
                "staffCount":1
            },
            {
                "time":"2019-12-24 15:50",
                "staffCount":1
            },
            {
                "time":"2019-12-24 15:40",
                "staffCount":2
            },
            {
                "time":"2019-12-24 15:30",
                "staffCount":2
            },
            {
                "time":"2019-12-24 15:20",
                "staffCount":1
            },
            {
                "time":"2019-12-24 15:10",
                "staffCount":1
            },
            {
                "time":"2019-12-24 15:00",
                "staffCount":1
            },
            {
                "time":"2019-12-24 14:50",
                "staffCount":2
            },
            {
                "time":"2019-12-24 14:40",
                "staffCount":2
            },
            {
                "time":"2019-12-24 14:30",
                "staffCount":2
            },
            {
                "time":"2019-12-24 14:20",
                "staffCount":1
            },
            {
                "time":"2019-12-24 14:10",
                "staffCount":1
            },
            {
                "time":"2019-12-24 14:00",
                "staffCount":1
            }
        ]
react代码操作步骤:
- 根据官方文档说明的“在 webpack 中使用 ECharts”,用 npm 安装 ECharts:npm install echarts --save
- 引入 ECharts:通过 npm 上安装的 ECharts 和 zrender 会放在
node_modules目录下。可以直接在项目代码中require('echarts')得到 ECharts。 - 由于我的数据是在store里面获取的,第一次挂载的时候,是获取不到数据的,会报错。如果把以下内容写在非生命周期函数里面,会获取不到dom 的 id,也会报“Cannot read property 'getAttribute' of null问题”错
- 所以我把echart内容写在componentWillUpdate里面,就可以
//import 下面引入
var echarts = require('echarts');

 componentWillUpdate = () => {
        const { staffCountList = [] } = this.props.monitorStore

        //渲染图表
        if (staffCountList) {  //有数据才渲染
            const time = staffCountList.map((v) => {       //洗数据
                const obj = v.time;  //2019-12-23 17:56    从给的日期截取时间
                const shotTime = obj.substring(10, 16)
                return shotTime
            })

            const yDate = staffCountList.map((v) => {
                const obj = v.staffCount;
                return obj
            })

            //监控图表,必须放在didMount里面
            var myChart = echarts.init(document.getElementById('staffChats'));


            // 绘制图表
            myChart.setOption({       //这里内部可以从echarts官网实例根据你的需要获取数据,根据需求在配置项手册查看不同的配置项进行修改
                tooltip: {
                    trigger: 'axis',
                    position: function (pt) {
                        return [pt[0], '10%'];
                    }
                },
                xAxis: {
                    type: 'category',
                    boundaryGap: false,
                    data: time,
                    textStyle: {   //坐标字体样式
                        color: '#AEAEAE'
                    },
                    axisLine: {   //坐标线
                        show: false
                    },
                    axisTick: {  //坐标刻度
                        show: false
                    },
                },
                yAxis: {
                    type: 'value',
                    boundaryGap: [0, '100%'],
                    textStyle: {
                        color: '#AEAEAE'
                    },
                    axisLine: {
                        show: false
                    },
                    axisTick: {
                        show: false
                    },
                },
                grid: {    //图表相对div位置
                    left: '0',
                    right: '15%',
                    bottom: '10%',
                    top: '10%',
                    containLabel: true  //坐标刻度标签,改为false 坐标都没有了
                },
                series: [   //鼠标移动到图表上,显示的提示
                    {
                        name: '上线客服数',
                        type: 'line',
                        smooth: true,
                        symbol: 'none',
                        sampling: 'average',
                        itemStyle: {
                            color: 'rgb(93, 179, 230)'
                        },
                        areaStyle: {   //面积图面积部分颜色
                            color: new echarts.graphic.LinearGradient(0, 0, 0, 1, [{
                                offset: 0,
                                color: 'rgb(150, 218, 244,0.6)'   //上部颜色
                            }, {
                                offset: 1,
                                color: 'rgb(93, 179, 230, 0.1)'   //下部颜色
                            }])
                        },
                        data: yDate
                    }
                ]
            });
        }
    }

//render
 <div className={styles.staffMonitor} id="staffChats">

</div>
信息创造价值, 知识就是力量。
