python-数据可视化
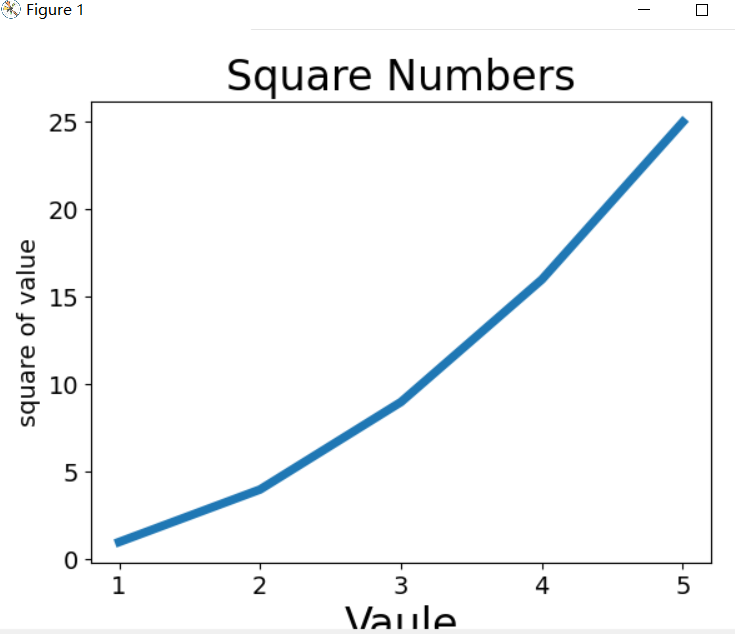
1.绘制第一个图形
import matplotlib.pyplot as plt

input_values=[1,2,3,4,5]

squares=[1,4,9,16,25]
plt.plot(input_values,squares,linewidth=5)
plt.title("Square Numbers",fontsize=24)
plt.xlabel("Vaule",fontsize=24)
plt.ylabel("square of value",fontsize=14)
plt.tick_params(axis="both",labelsize=14)
plt.show()
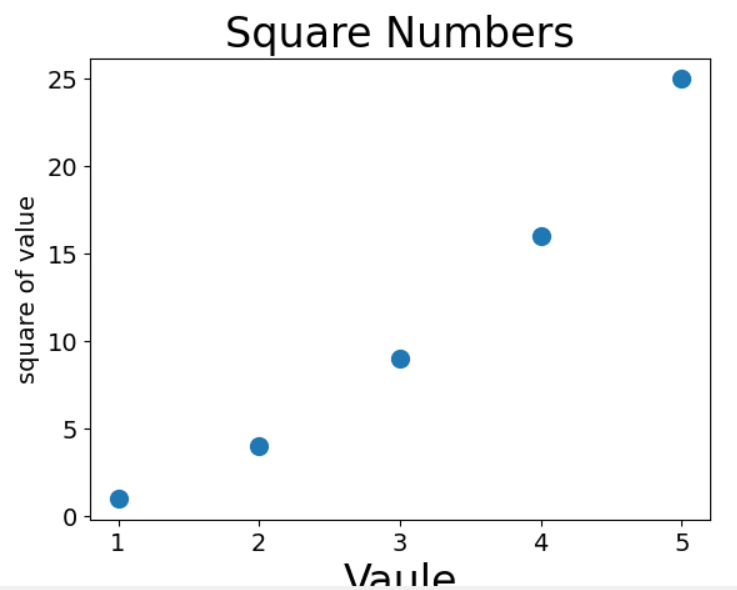
2.散点图
import matplotlib.pyplot as plt
x_vaules=[1,2,3,4,5]
y_values=[1,4,9,16,25]
plt.scatter(x_vaules,y_values,s=100)
plt.title("Square Numbers",fontsize=24)
plt.xlabel("Vaule",fontsize=24)
plt.ylabel("square of value",fontsize=14)
plt.tick_params(axis="both",which='major',labelsize=14)
plt.show()
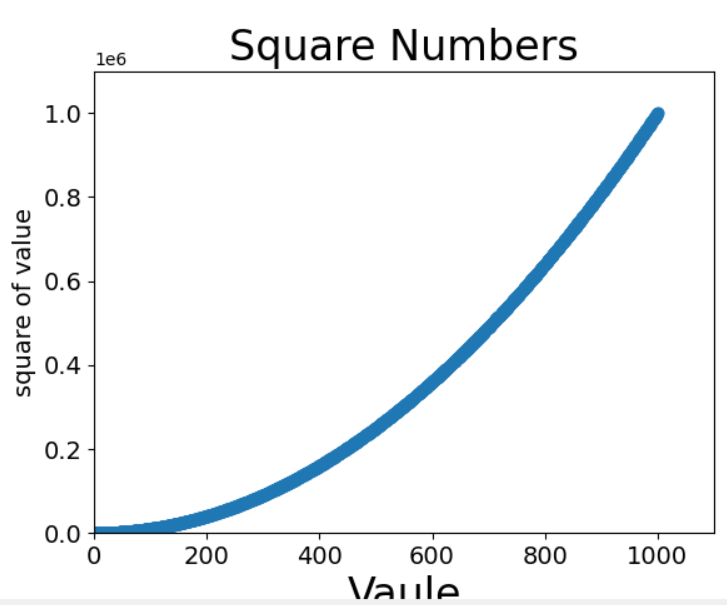
3.自动计算
import matplotlib.pyplot as plt
# x_vaules=[1,2,3,4,5]
x_values=list(range(1,1001))
y_values=[x**2 for x in x_values]
# y_values=[1,4,9,16,25]
plt.scatter(x_values,y_values,s=40)
#设置图标标题并给坐标轴加上标签
plt.title("Square Numbers",fontsize=24)
plt.xlabel("Vaule",fontsize=24)
plt.ylabel("square of value",fontsize=14)
plt.tick_params(axis="both",which='major',labelsize=14)
#设置每个坐标轴的取值范围
plt.axis([0,1100,0,1100000])
plt.show()
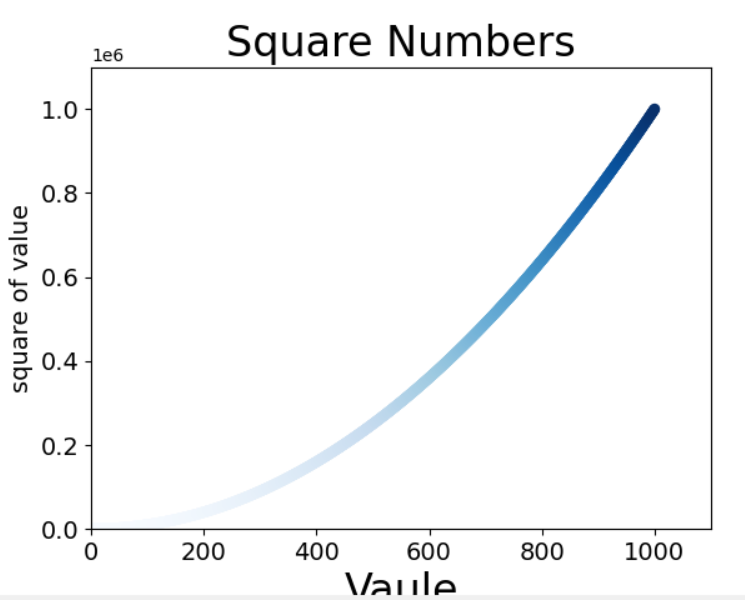
4.渐变色
深色的显示突出
import matplotlib.pyplot as plt
# x_vaules=[1,2,3,4,5]
x_values=list(range(1,1001))
y_values=[x**2 for x in x_values]
# y_values=[1,4,9,16,25]
#使用cmap参数告诉plot用哪个颜色映射
plt.scatter(x_values,y_values,c=y_values,cmap=plt.cm.Blues,edgecolors='none',s=40)
#设置图标标题并给坐标轴加上标签
plt.title("Square Numbers",fontsize=24)
plt.xlabel("Vaule",fontsize=24)
plt.ylabel("square of value",fontsize=14)
plt.tick_params(axis="both",which='major',labelsize=14)
#设置每个坐标轴的取值范围
plt.axis([0,1100,0,1100000])
plt.show()
5.保存图
plt.savefig('squares_plot.png',bbox_inches='tight')
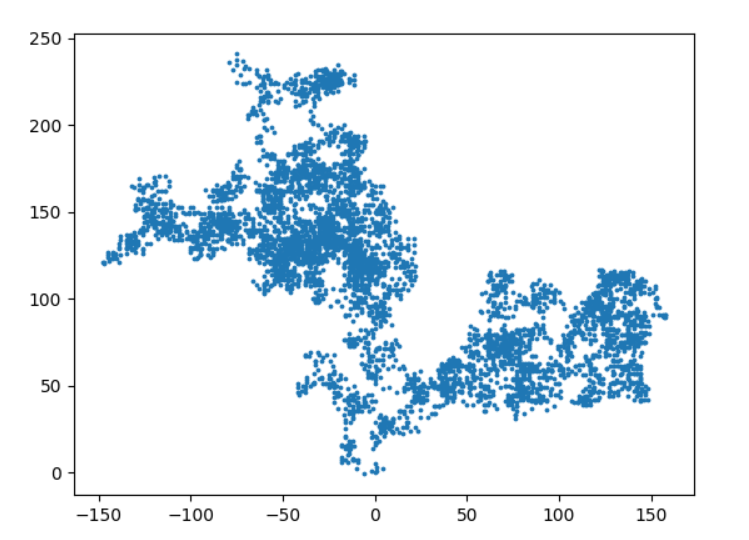
6.漫步图
random_walk.py
from random import  choice
class RandomWalk():
    def __init__(self,num_points=5000):
        self.num_points=num_points
        self.x_values=[0]
        self.y_values=[0]
    def fill_walk(self):
        while len(self.x_values) < self.num_points:
            x_direction= choice([1,-1])
            x_distance=choice([0,1,2,3,4])
            x_step=x_direction*x_distance
            y_direction=choice([1,-1])
            y_distance=choice([0,1,2,3,4])
            y_step=y_direction*y_distance
            if x_step ==0 and y_step ==0:
                continue
            next_x=self.x_values[-1]+x_step
            next_y=self.y_values[-1]+y_step
            self.x_values.append(next_x)
            self.y_values.append(next_y)
rw_visual.py
import matplotlib.pyplot as plt
from random_walk import RandomWalk
rw=RandomWalk()
rw.fill_walk()
plt.scatter(rw.x_values,rw.y_values,s=3)
plt.show()