Spring Cloud 系列之 Netflix Hystrix 服务监控


  Hystrix 除了可以实现服务容错之外,还提供了近乎实时的监控功能,将服务执行结果和运行指标,请求数量成功数量等等这些状态通过 Actuator 进行收集,然后访问 /actuator/hystrix.stream 即可看到实时的监控数据。


1|1添加依赖


  在需要开启数据监控的项目中添加 actuator 依赖。

<!-- spring boot actuator 依赖 --> <dependency> <groupId>org.springframework.boot</groupId> <artifactId>spring-boot-starter-actuator</artifactId> </dependency>


1|2配置文件


  在配置文件中开启 hystrix.stream 端点。如果希望所有端点暴露,配置为 '*'

# 度量指标监控与健康检查 management: endpoints: web: exposure: include: hystrix.stream


1|3启动类


package com.example; import org.springframework.boot.SpringApplication; import org.springframework.boot.autoconfigure.SpringBootApplication; import org.springframework.cloud.client.circuitbreaker.EnableCircuitBreaker; import org.springframework.cloud.client.loadbalancer.LoadBalanced; import org.springframework.context.annotation.Bean; import org.springframework.web.client.RestTemplate; // 开启熔断器注解 2 选 1,@EnableHystrix 封装了 @EnableCircuitBreaker // @EnableHystrix @EnableCircuitBreaker @SpringBootApplication public class OrderServiceRestApplication { @Bean @LoadBalanced public RestTemplate restTemplate() { return new RestTemplate(); } public static void main(String[] args) { SpringApplication.run(OrderServiceRestApplication.class, args); } }


1|4访问


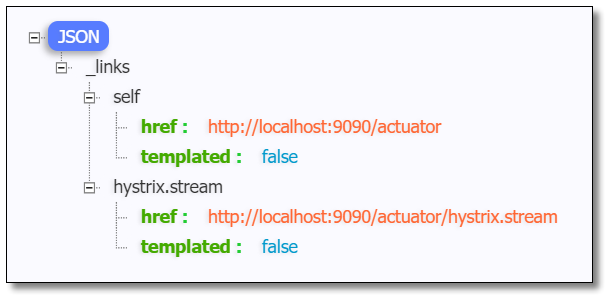
  访问:http://localhost:9090/actuator 可以看到已经开启了 hystrix.stream 端点。


  访问:http://localhost:9090/actuator/hystrix.stream 结果如下:


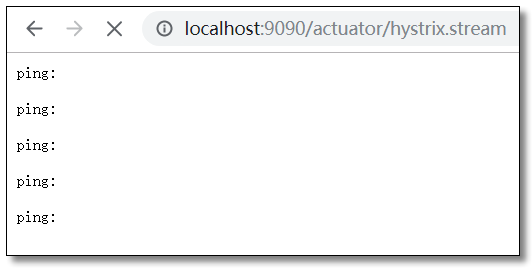
  此时并没有获取到 Hystrix 的数据。接下来请求一个肯定会出错的方法产生服务熔断降级处理后,结果如下:

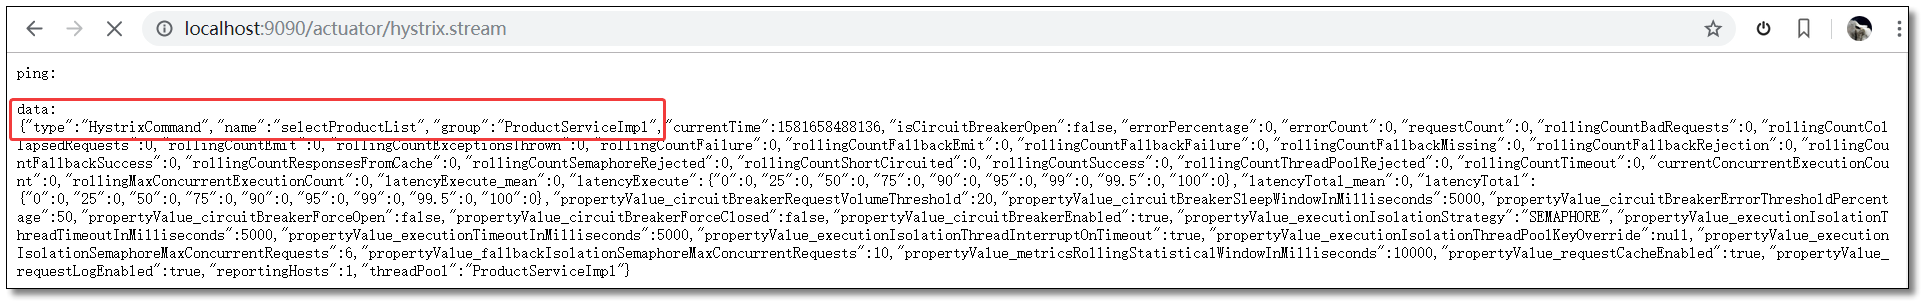
  对于这种纯 JSON 的查看方式非常不方便我们直观的观察到服务的运行状态。我们可以使用 Hystrix 监控中心来进行查看。


2|0监控中心


  所谓的监控中心就是 Hystrix 提供的一套可视化系统 Hystrix-Dashboard ,可以非常友好的看到当前环境中服务运行的状态。Hystrix-Dashboard 是一款针对 Hystrix 进行实时监控的工具,通过 Hystrix-Dashboard 我们可以直观地看到各 Hystrix Command 的请求响应时间,请求成功率等数据。


2|1添加依赖


  在需要开启数据监控的项目中添加 dashboard 依赖。

<!-- spring boot actuator 依赖 --> <dependency> <groupId>org.springframework.boot</groupId> <artifactId>spring-boot-starter-actuator</artifactId> </dependency> <!-- spring cloud netflix hystrix 依赖 --> <dependency> <groupId>org.springframework.cloud</groupId> <artifactId>spring-cloud-starter-netflix-hystrix</artifactId> </dependency> <!-- spring cloud netflix hystrix dashboard 依赖 --> <dependency> <groupId>org.springframework.cloud</groupId> <artifactId>spring-cloud-starter-netflix-hystrix-dashboard</artifactId> </dependency>


2|2启动类


  在需要开启数据监控的项目启动类中添加 @EnableHystrixDashboard 注解。

package com.example; import org.springframework.boot.SpringApplication; import org.springframework.boot.autoconfigure.SpringBootApplication; import org.springframework.cloud.client.circuitbreaker.EnableCircuitBreaker; import org.springframework.cloud.client.loadbalancer.LoadBalanced; import org.springframework.cloud.netflix.hystrix.dashboard.EnableHystrixDashboard; import org.springframework.context.annotation.Bean; import org.springframework.web.client.RestTemplate; // 开启熔断器注解 2 选 1,@EnableHystrix 封装了 @EnableCircuitBreaker // @EnableHystrix @EnableCircuitBreaker // 开启数据监控注解 @EnableHystrixDashboard @SpringBootApplication public class OrderServiceRestApplication { @Bean @LoadBalanced public RestTemplate restTemplate() { return new RestTemplate(); } public static void main(String[] args) { SpringApplication.run(OrderServiceRestApplication.class, args); } }


2|3访问


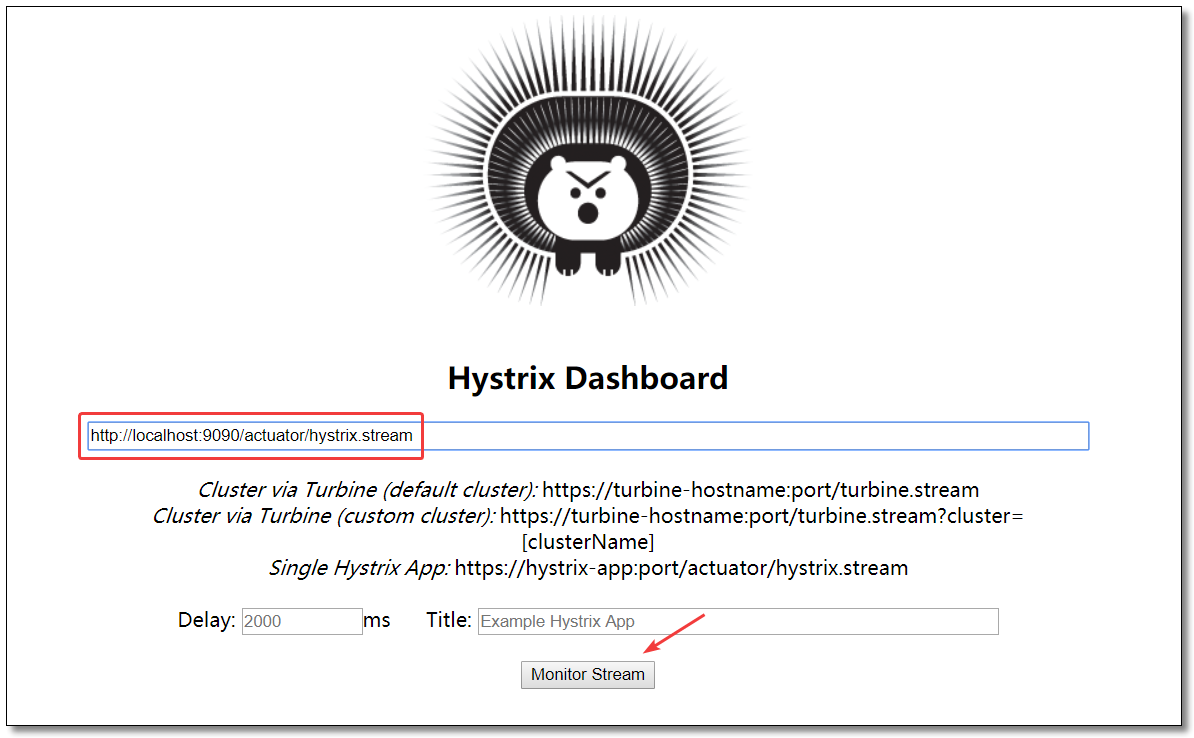
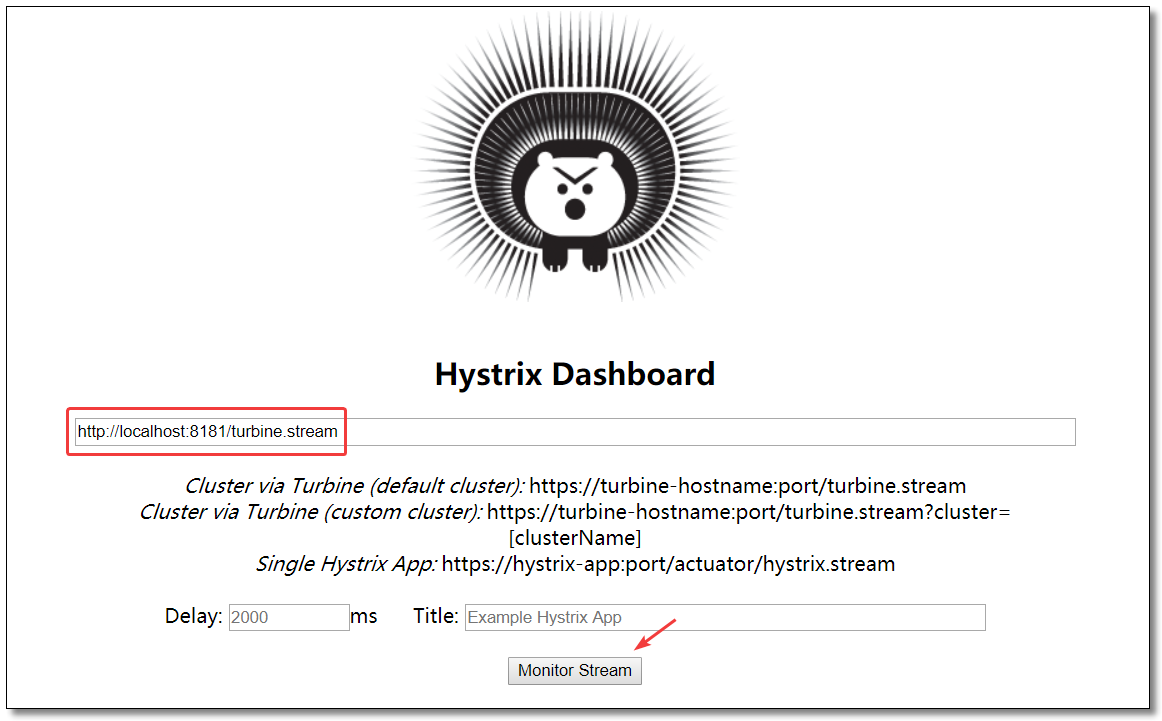
  访问:http://localhost:9090/hystrix 监控中心界面如下:
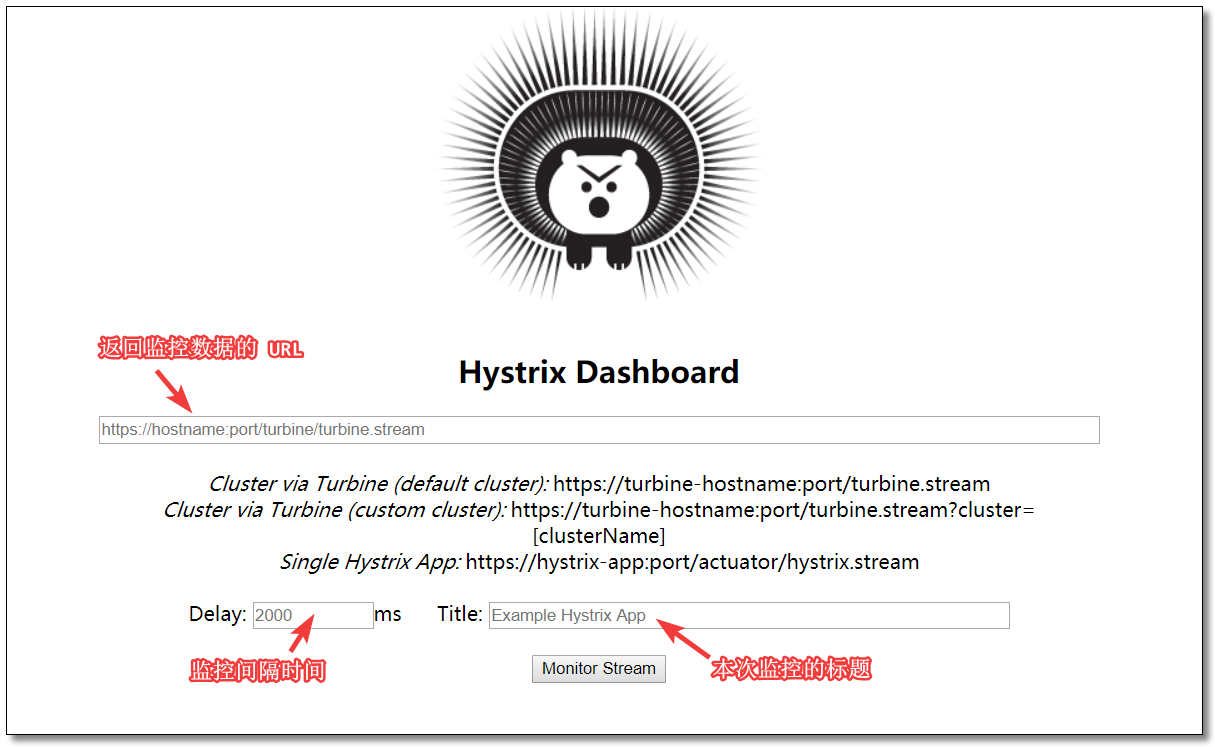
  

2|4查看数据


  输入能够返回监控数据的URL:http://localhost:9090/actuator/hystrix.stream
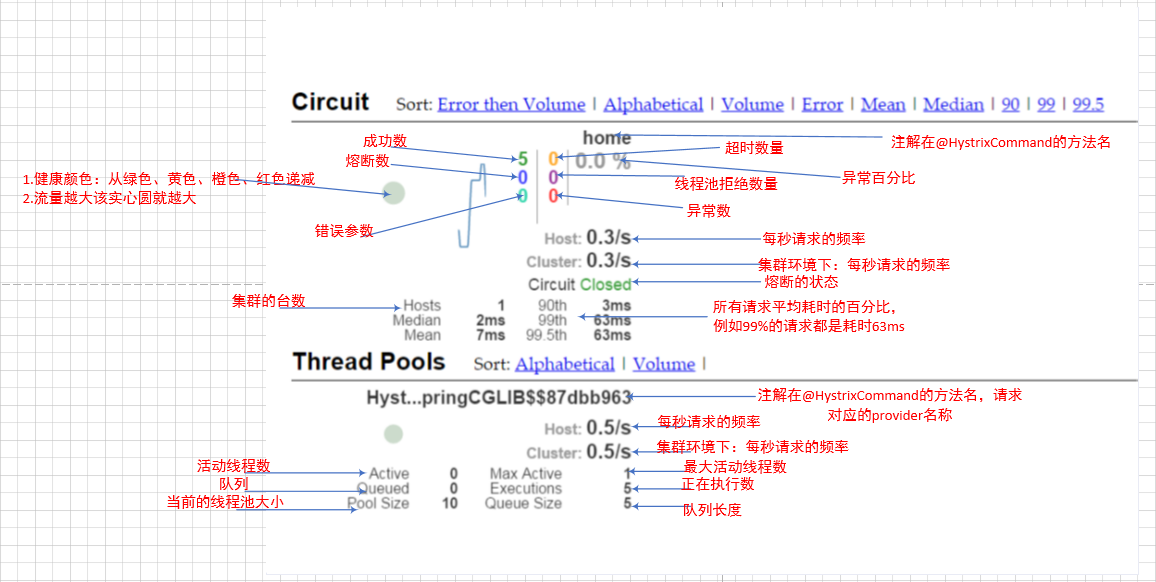
  

2|5监控中心图解


3|0聚合监控


  点击链接观看:聚合监控视频(获取更多请关注公众号「哈喽沃德先生」)


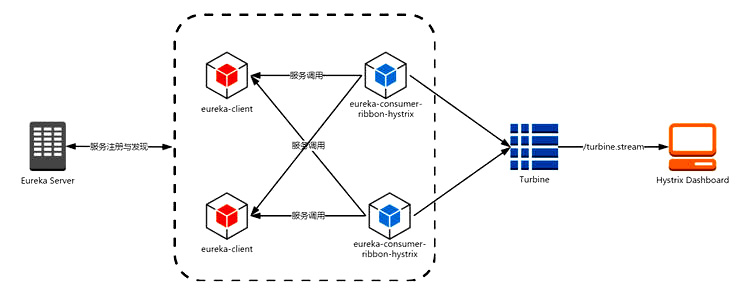
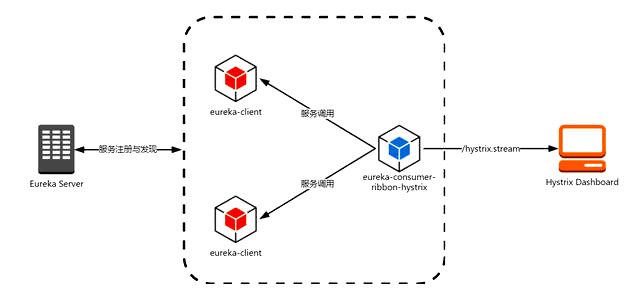
  Turbine 是聚合服务器发送事件流数据的一个工具,dashboard 只能监控单个节点,实际生产环境中都为集群,因此可以通过 Turbine 来监控集群服务。
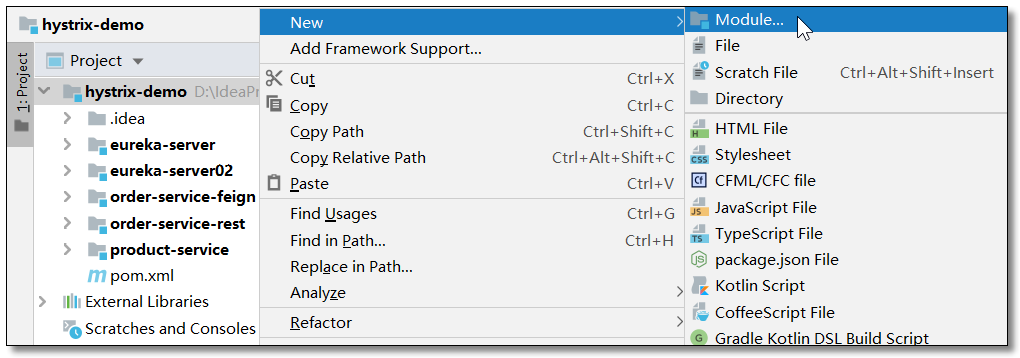
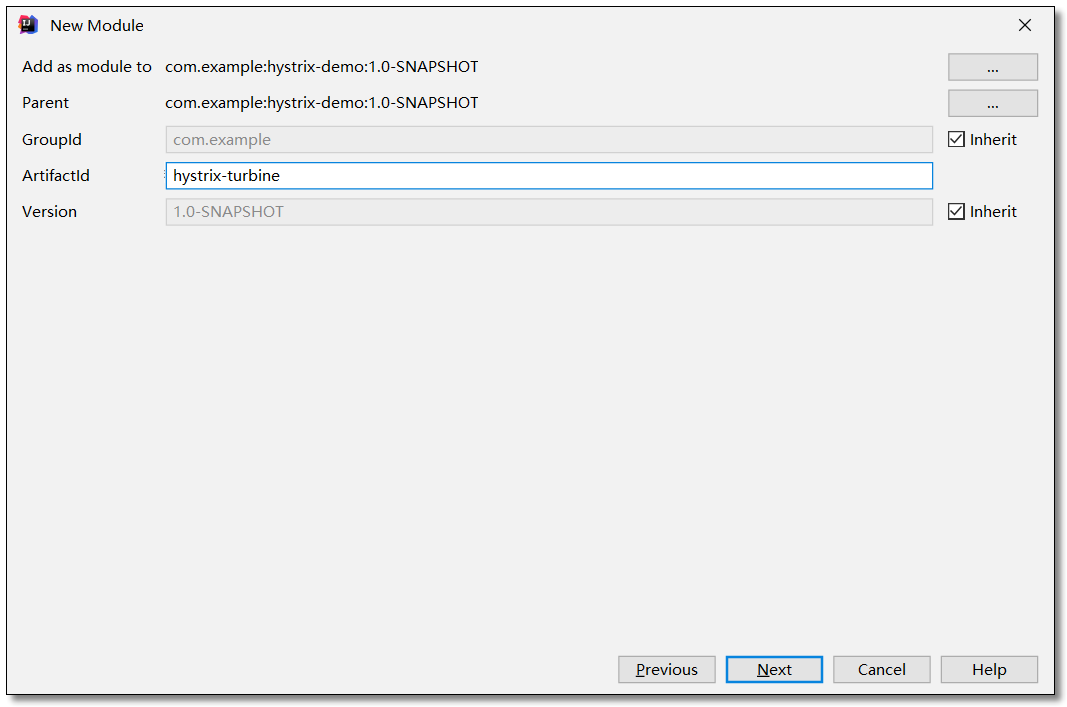
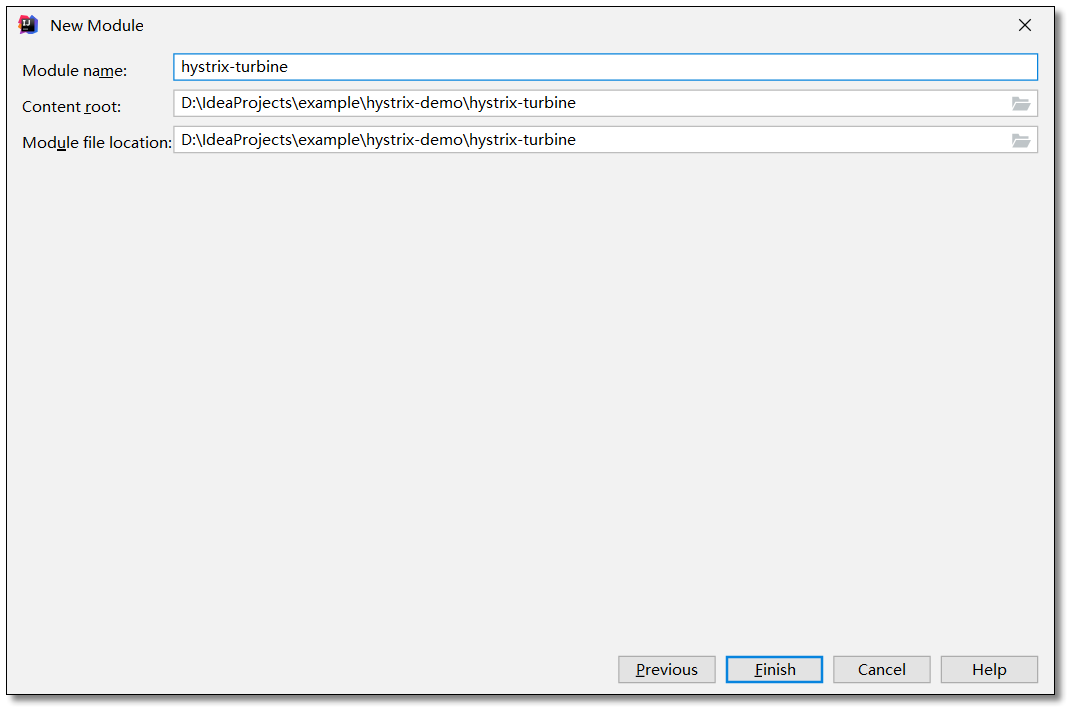
  

3|1创建项目


  在 hystrix-demo 父工程下创建 hystrix-turbine 工程。


3|2添加依赖


  项目引入 hystrixdashboardturbine 三个依赖。

<?xml version="1.0" encoding="UTF-8"?> <project xmlns="http://maven.apache.org/POM/4.0.0" xmlns:xsi="http://www.w3.org/2001/XMLSchema-instance" xsi:schemaLocation="http://maven.apache.org/POM/4.0.0 http://maven.apache.org/xsd/maven-4.0.0.xsd"> <modelVersion>4.0.0</modelVersion> <groupId>com.example</groupId> <artifactId>hystrix-turbine</artifactId> <version>1.0-SNAPSHOT</version> <!-- 继承父依赖 --> <parent> <groupId>com.example</groupId> <artifactId>hystrix-demo</artifactId> <version>1.0-SNAPSHOT</version> </parent> <!-- 项目依赖 --> <dependencies> <!-- spring-cloud netflix hystrix 依赖 --> <dependency> <groupId>org.springframework.cloud</groupId> <artifactId>spring-cloud-starter-netflix-hystrix</artifactId> </dependency> <!-- spring cloud netflix hystrix dashboard 依赖 --> <dependency> <groupId>org.springframework.cloud</groupId> <artifactId>spring-cloud-starter-netflix-hystrix-dashboard</artifactId> </dependency> <!-- spring cloud netflix turbine 依赖 --> <dependency> <groupId>org.springframework.cloud</groupId> <artifactId>spring-cloud-starter-netflix-turbine</artifactId> </dependency> </dependencies> </project>


3|3配置文件


  application.yml

server: port: 8181 # 端口 spring: application: name: hystrix-turbine # 应用名称 # 配置 Eureka Server 注册中心 eureka: instance: prefer-ip-address: true # 是否使用 ip 地址注册 instance-id: ${spring.cloud.client.ip-address}:${server.port} # ip:port client: service-url: # 设置服务注册中心地址 defaultZone: http://localhost:8761/eureka/,http://localhost:8762/eureka/ # 聚合监控 turbine: # 要监控的服务列表,多个用逗号分隔 app-config: order-service-rest,order-service-feign # 指定集群名称 cluster-name-expression: "'default'"


3|4启动类


  启动类需要开启 @EnableHystrix@EnableHystrixDashboard@EnableTurbine 三个注解。

package com.example; import org.springframework.boot.SpringApplication; import org.springframework.boot.autoconfigure.SpringBootApplication; import org.springframework.cloud.client.circuitbreaker.EnableCircuitBreaker; import org.springframework.cloud.netflix.hystrix.dashboard.EnableHystrixDashboard; import org.springframework.cloud.netflix.turbine.EnableTurbine; // 开启熔断器注解 2 选 1,@EnableHystrix 封装了 @EnableCircuitBreaker // @EnableHystrix @EnableCircuitBreaker // 开启数据监控注解 @EnableHystrixDashboard // 开启聚合监控注解 @EnableTurbine @SpringBootApplication public class HystrixTurbineApplication { public static void main(String[] args) { SpringApplication.run(HystrixTurbineApplication.class, args); } }


3|5访问


  order-service-rest 和 order-service-feign 都配置监控中心,最终环境如下:


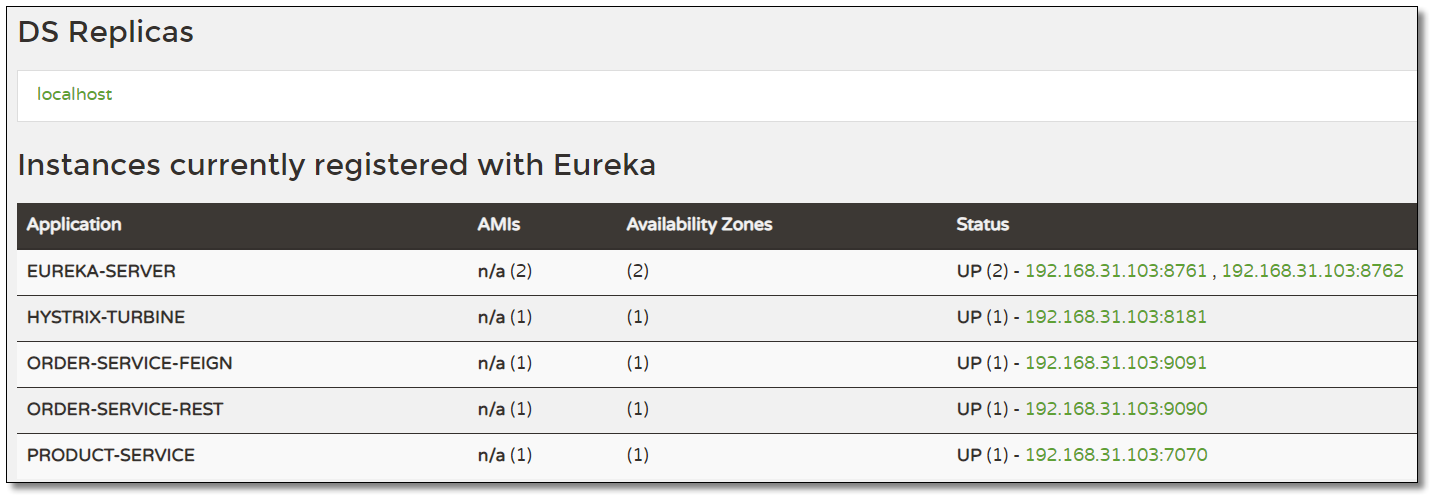
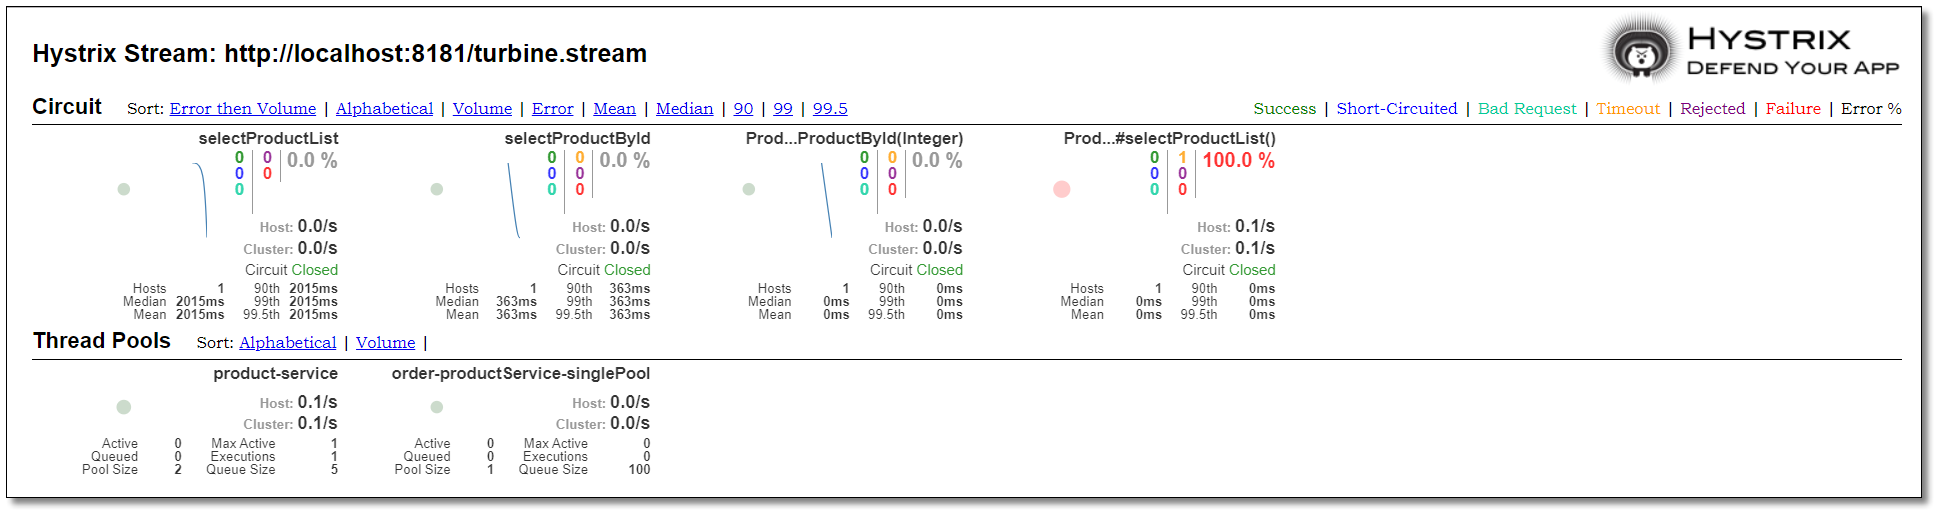
  访问:http://localhost:8181/turbine.stream 多节点服务状态数据如下:


  访问:http://localhost:8181/hystrix


  order-service-rest 和 order-service-feign 两个服务的运行状态如下:

  至此 Hystrix 服务监控知识点就讲解结束了。

  本文采用 知识共享「署名-非商业性使用-禁止演绎 4.0 国际」许可协议

  大家可以通过 分类 查看更多关于 Spring Cloud 的文章。

posted @ 2020-05-11 09:53  YoungDeng  阅读(156)  评论(0编辑  收藏  举报