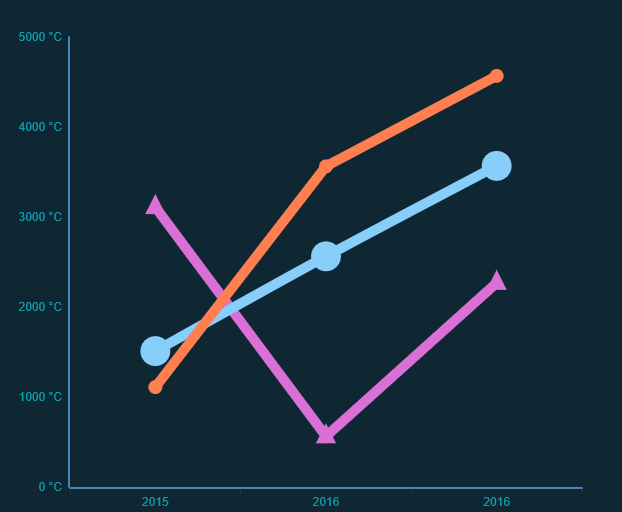
ECharts 使用总结
1、去掉Echarts 图标上边框和右边框
option = {
      title: {
                   text: '未来一周气温变化',
                   subtext: '纯属虚构'
              },
       grid: {
                   show: 'true',
                    borderWidth: '0',
                 },
      tooltip: {
                   trigger: 'axis'
                   },
2、去掉 去除网格线、网格区域
    xAxis: [
                        {
                            splitLine: {
                                show: false,
                            },//去除网格线
                            splitArea: { show: false },//保留网格区域
                            type: 'category',
                            boundaryGap: false,
                            data: ['2015', '2016', '2016']
                        }
                    ],
                    yAxis: [
                        {
                            splitLine: { show: false },//去除网格线
                            splitArea: { show: false },//保留网格区域
                            type: 'value',
                            axisLabel: {
                                formatter: '{value} °C'
                            }
                        }
                    ],
3、折线图折线加粗
        series: [
                        {
                            name: '最高气温',
                            type: 'line',
                            data: [1110,2563,4568],
                            itemStyle: {
                                normal: {
                                    lineStyle: {
                                        width: 10
                                    }
                                }
                            }

                        },
4、图表展示不靠边
   xAxis: [
                        {
                            axisLabel: {
                                show: true,
                                textStyle: {
                                    color: "#109cad"
                                }
                            },
                            splitLine: {
                                show: false,
                            },//去除网格线
                            splitArea: { show: false },//保留网格区域
                            type: 'category',
                            boundaryGap: true,
                            data: ['2015', '2016', '2016']
                        }
                    ],

5、去掉右边和上边的边框
 option3 = {
                    title: {
                        //text: '世界人口总量',
                        //subtext: '数据来自网络'
                    },
                    grid: {
                        show: 'true',
                        borderWidth: '0',
                    },
                    tooltip: {
                        trigger: 'axis'
                    },
6、X、Y 轴文字加粗
   xAxis: [
                        {
                            type: 'value',
                            splitLine: { show: false },//去除网格线
                            axisLine: { lineStyle: { color: '#0087ED' } },
                            axisLabel: {
                                show: true,
                                textStyle: {
                                    color: "#109cad",   //改变字体颜色
                                    fontSize: 18,
                                    fontFamily: 'microsoft yahei light',
                                    fontWeight: 700
                                }
                            },
                           // boundaryGap: [0, 0.01]
                        }
                    ],
7、地图颜色修改、地图上文字修改
   legend: {
                        show: true,
                        orient: 'vertical',
                        x: 'left',
                        y: 'bottom',
                        itemGap: 20,
                        textStyle: {
                            fontSize: '20px',
                            fontWeight: 'bold'
                        },
                        data: [],

                        textStyle: {
                            color: '#fff'    //地图山文字颜色修改
                        }
                    },


                    series: [
                        {
                            name: '全国',
                            type: 'map',
                            roam: true,
                            hoverable: false,
                            mapType: '江苏|南京市',
                            itemStyle: {
                                normal: {
                                    borderColor: 'rgba(100,149,237,1)',
                                    borderWidth: 0.5,
                                    areaStyle: {
                                        color: '#CCCCCC'     //地图颜色修改
                                    }
                                }
                            },
                            data: [],


【推荐】国内首个AI IDE,深度理解中文开发场景,立即下载体验Trae
【推荐】编程新体验,更懂你的AI,立即体验豆包MarsCode编程助手
【推荐】抖音旗下AI助手豆包,你的智能百科全书,全免费不限次数
【推荐】轻量又高性能的 SSH 工具 IShell:AI 加持,快人一步
· 基于Microsoft.Extensions.AI核心库实现RAG应用
· Linux系列:如何用heaptrack跟踪.NET程序的非托管内存泄露
· 开发者必知的日志记录最佳实践
· SQL Server 2025 AI相关能力初探
· Linux系列:如何用 C#调用 C方法造成内存泄露
· Manus爆火,是硬核还是营销?
· 终于写完轮子一部分:tcp代理 了,记录一下
· 别再用vector<bool>了!Google高级工程师:这可能是STL最大的设计失误
· 单元测试从入门到精通
· 震惊!C++程序真的从main开始吗?99%的程序员都答错了
2017-01-17 MVC ---- EF的延迟加载
2017-01-17 MVC ---- 增删改成 EF6