热力图 vue 项目中使用热力图插件 “heatmap.js”(保姆式教程)
我现在写的这项目是用CDN引入 heatmap.js,
可根据自己项目情况使用哪种方式引入插件。
官网地址 “https://www.patrick-wied.at/static/heatmapjs/”
在写一个基本html 的demo看看是什么样子和使用方式和数据格式。
<!DOCTYPE html>
<html>
<head>
<meta charset="UTF-8">
<title></title>
<style>
</style>
</head>
<body>
<div style="height: 900px; width: 100%;" id="heatmap"></div>
</body>
<!-- <script src="js/heatmap.min.js"></script> -->
<script src="https://cdn.bootcdn.net/ajax/libs/heatmap.js/2.0.0/heatmap.min.js"></script>
<script type="text/javascript">
// 创建一个heatmap实例对象
// “h337” 是heatmap.js全局对象的名称.可以使用它来创建热点图实例
// 这里直接指定热点图渲染的div了.heatmap支持自定义的样式方案,网页外包接活具体可看官网api
var heatmapInstance = h337.create({
container: document.querySelector('#heatmap'),
});
//构建一些随机数据点,网页切图价格这里替换成你的业务数据
var points = [
// {x: 867, y: 1, value: 23, radius: 100},
// {x: 43, y: 287, value: 92, radius: 100},
// {x: 1236, y: 524, value: 10, radius: 100},
// {x: 867, y: 284, value: 6, radius: 100},
// {x: 742, y: 77, value: 80, radius: 100}
];
var max = 0;
var width = document.body.clientWidth;
var height = document.body.clientHeight;
console.log(width,height);
var len = 50;
while (len--) {
var val = Math.floor(Math.random()*100);
max = Math.max(max, val);
var point = {
x: Math.floor(Math.random()*width),
y: Math.floor(Math.random()*height),
value: val,
radius:40
};
points.push(point);
}
var data = {
max: max,
data: points
};
console.log(data);
//因为data是一组数据,web切图报价所以直接setData
heatmapInstance.setData(data); //数据绑定还可以使用
</script>
</html>
以上是demo 的示例。
现在开始这么用CDN引入
在html 中 <script src="https://cdn.bootcdn.net/ajax/libs/heatmap.js/2.0.0/heatmap.min.js"></script>
这是CDN引入的js
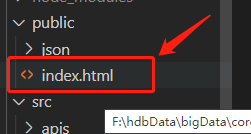
首先 在public 的index.html 中 head头引入


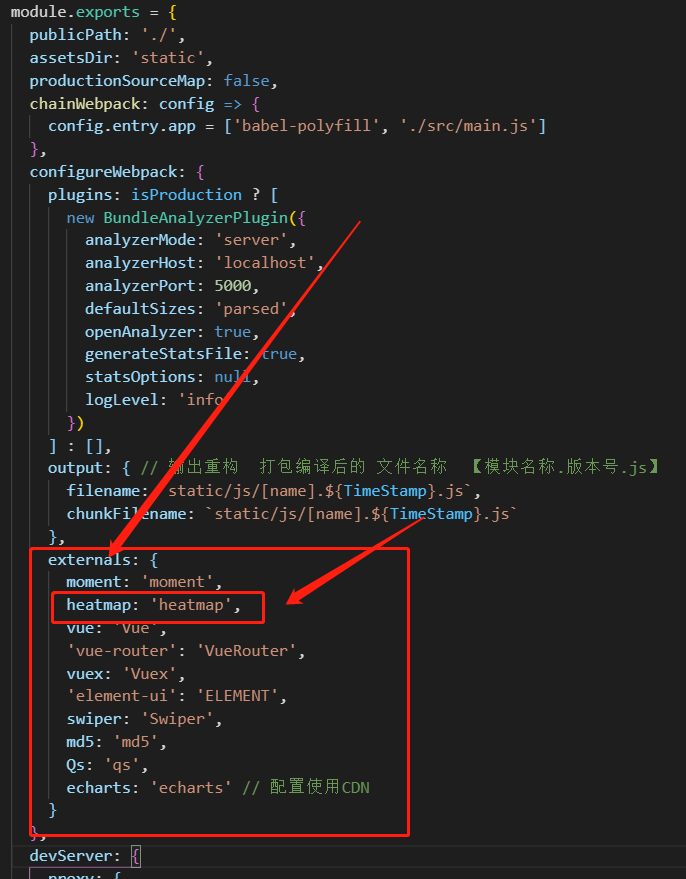
然后在 vue 中的 vue.config.js文件中
configureWebpack.externals{
heatmap: 'heatmap',
} 中这样写
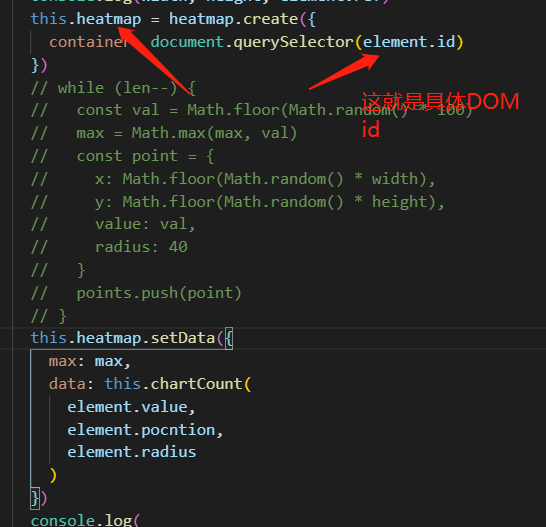
最后在 具体项目文件引入挂载到vue实例上就好


完结撒花~~~~!


【推荐】国内首个AI IDE,深度理解中文开发场景,立即下载体验Trae
【推荐】编程新体验,更懂你的AI,立即体验豆包MarsCode编程助手
【推荐】抖音旗下AI助手豆包,你的智能百科全书,全免费不限次数
【推荐】轻量又高性能的 SSH 工具 IShell:AI 加持,快人一步
· AI与.NET技术实操系列:向量存储与相似性搜索在 .NET 中的实现
· 基于Microsoft.Extensions.AI核心库实现RAG应用
· Linux系列:如何用heaptrack跟踪.NET程序的非托管内存泄露
· 开发者必知的日志记录最佳实践
· SQL Server 2025 AI相关能力初探
· 震惊!C++程序真的从main开始吗?99%的程序员都答错了
· 【硬核科普】Trae如何「偷看」你的代码?零基础破解AI编程运行原理
· 单元测试从入门到精通
· 上周热点回顾(3.3-3.9)
· winform 绘制太阳,地球,月球 运作规律