JVM Study
1 JVM and OS

2 JVM JRE JDK
JDK -> JRE -> JVM

3 JVM

The JVM is a stack-based structure. The JVM translates bytecode in two ways: interpretation execution and JIT.
4 JVM Architecture

change init to initiation, execute cinit firstly, then is init.
linking 。
- Verify: Checks whether the bytecode is safe (verifies format, metadata, bytecode, and symbolic references).
- Prepare: Assigns initial values to static variables, such as giving an
inta value of 0, whilefinalvariables are assigned directly. (Member variables are not assigned here; they are initialized in<init>.) - Resolve: Replaces symbolic references with direct references (direct references that can be linked directly). The resolution phase activates the class.
| pc registers |
thread-specific data |
row number of byte code | It relies on the program counter within each thread to find the next instruction to execute. Each thread has its own independent program counter, allowing different threads to switch execution and resume correctly. | |
| VM stack area |
|
|
-xss |  |
| heap area | Shared among threads, with a lifecycle that matches the JVM. The space addresses do not need to be contiguous. |
-Xms -Xsx -Xmn |

(JDK 8) |
|
|
method area (meta area) |
Shared among threads, with a lifecycle that matches the JVM. The space addresses do not need to be contiguous. |
Stores data such as class information that has been loaded by the virtual machine, constants, static variables, and code compiled by the just-in-time compiler. |
||
| native method area | thread specific | for native. |
5 JVM runtime data
1)runtime area JDK8
In JDK 8, the method area was replaced by Metaspace. Metaspace and direct memory are located outside the JDK, occupying a separate block of memory.

2) why change permgen to metaspace
- Strings in the permanent generation were prone to performance issues and memory overflow.
- The size of class and method information is difficult to determine, making it challenging to specify the size of the permanent generation. If set too small, permanent generation overflow occurs; if set too large, it may lead to old generation overflow.
- GC in the permanent generation introduced unnecessary complexity and had low collection efficiency.
- HotSpot and JRockit were likely to be merged, and JRockit did not have a permanent generation.
6 VM stack area
| Local Variable Table |
|
| Operand Stack |
|
| dynamic linking |
|
| return address |
7 native method area
8 Heap
The largest area in the JVM. The heap stores almost all objects (some objects may be stored in the method area).
-
The largest memory area
-
Shared among threads (except for Thread Local Allocation Buffer, which is private)
-
Created when the virtual machine starts
-
Stores object instances
-
The primary area for garbage collection
-
Current garbage collection algorithms are mostly generational
-
The Java heap is physically discontinuous but logically continuous
-
Objects do not become invalid immediately after a method ends; they wait for GC to reclaim them
1)setting the memory size
- -Xmx specifies the maximum heap size
- -Xms specifies the initial (minimum) heap size
2)
The heap is divided into several regions:
| JDK7 | 
|
|
| JDK8 | 
|
|
3)young and old
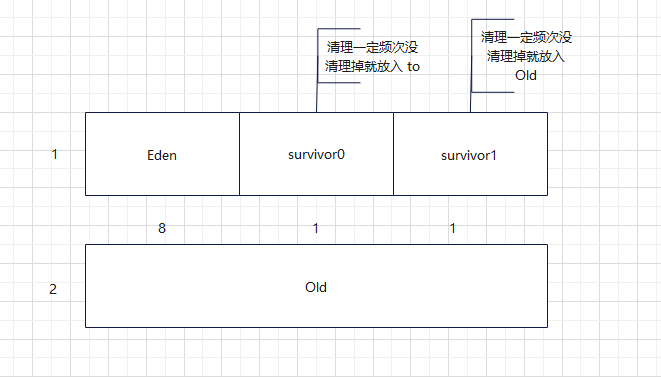
Young Generation Size: Typically 1/3 of the heap
Old Generation Size: Typically 2/3 of the heap
Eden, Survivor0, Survivor1 Ratio: Default is 8:1:1
This means within the Young Generation:
-
Eden occupies 80%
-
Survivor0 (S0) occupies 10%
-
Survivor1 (S1) occupies 10%
-XX:NewRatio Old = 2, Old : New。
-XX:SurvivorRation = 8 Eden : Young.
-xmn young
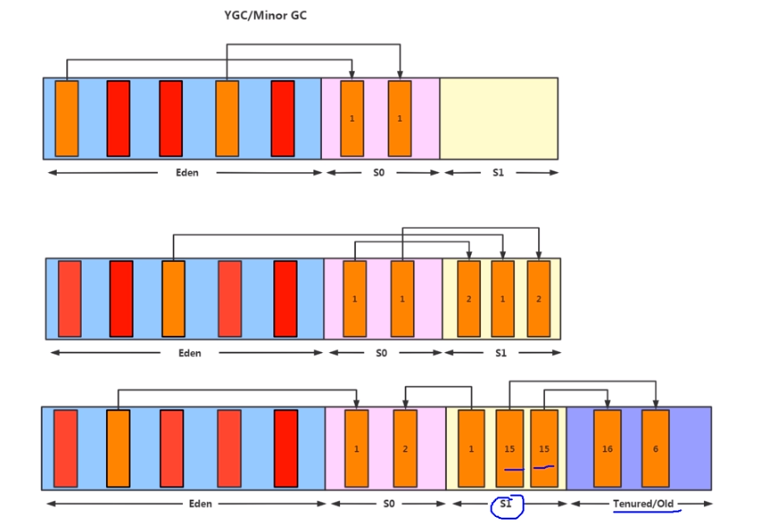
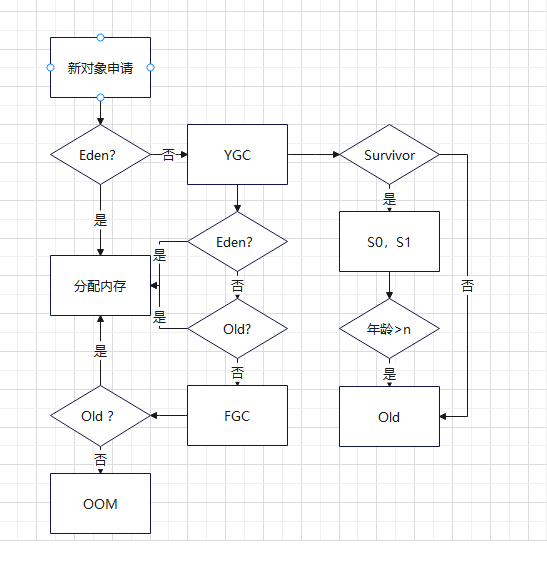
9 Object Allocation Process
- New objects are created in the Eden space
- When Eden Fills Up, Minor GC (Young Generation GC) is triggered, Cleans the entire young Generation (Eden + Survivor spaces)
- Objects remaining in Eden after GC are moved to Survivor0, Object age increases to 1, S0 is full, objects are moved directly to Survivor1 (S1)
- When an object's age reaches the threshold (default 15), it's promoted to the Old Generation,Threshold can be set with: -XX:MaxTenuringThreshold=N
-
When Old Generation runs out of space → Major GC (Full GC) is triggered
If Old Generation still cannot accommodate objects after Major GC → OutOfMemoryError (OOM)
10 GC
| minor GC | young |
eden is full, not survival. |
| Major GC | old |
|
| Mixed GC | ||
|
Full GC |
it cleans young generations and old generations stop the world event. |
11 initialization
Class initialization is the final step of the class loading process.
// Press Shift twice to open the Search Everywhere dialog and type `show whitespaces`,
// then press Enter. You can now see whitespace characters in your code.
public class Main {
    static {
        i = 1;
        // System.out.println(i); 报错
    }

    static int i = 2;
}
- i = 0
- i = 1;
- System.out.println(i) , error
- last step is i = 2;
12 GC
1) algorithms
|
reference counting |
|
It is easy to detect, but you can not detect circle references object1.obj = object.2 object2.obj = object.1
object1 = null; object2 = null; |
|
reachability analysis |
How it works:
Two-Marking Process for Object Death An object is not immediately garbage collected when found unreachable. It goes through a two-marking process before being declared dead.
Step 1: First Marking
When
|
|
|
mark and sweep |
Approach 1: Mark Alive, Sweep Dead
Approach 2: Mark Dead, Sweep Marked
How it works:
❌ Memory fragmentation ❌ Unstable execution efficiency
|
 |
|
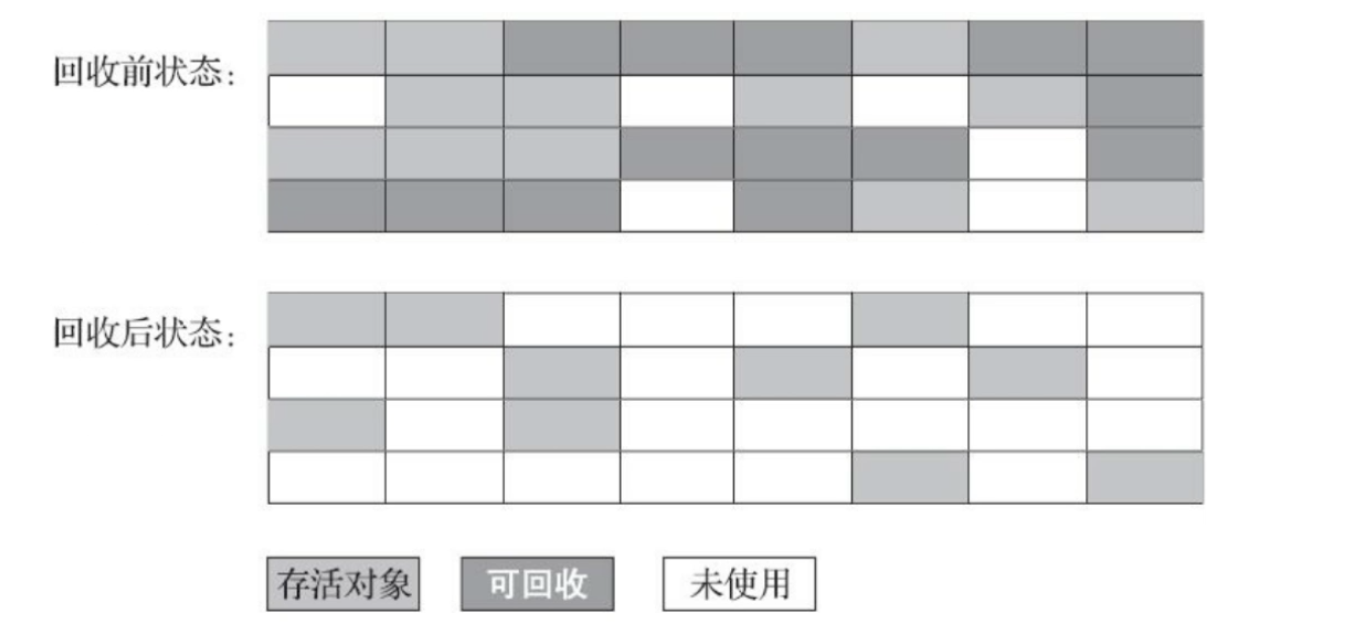
mark and copy |
Process:
The "98% Rule"
Disadvantages of the Copying Algorithm
|

|
|
mark-compact algorithm |
Mark-Compact AlgorithmProcess:
|

|
13 Reference level
| Strong | A a = new A(); | when memory is running low, don't collect. Throw OOM |
| Soft | String str = new String("abc"); //
SoftReference<String> softRef = new SoftReference<String>(str);// When to Use Large Object Allocation |
|
| Weak | String str = new String("abc"); //
WeakReference<String> weakRef = new WeakReference<String>(str); // |
must be recycled |
| Phantom | PhantomReference | Phantom references are the weakest reference type and must be used with a ReferenceQueue. They do not determine object's life and are used only for tracking object回收 |
14 GC

CMS,G1.
| Serial GC |
-XX: +UseSerialGC Serial |
Stop the world, mark and copy at safe point |
| Parallel GC |
-XX: +ParNew
|
|
| Parallel Scavenge | -XX: |
|
| CMS GC | JDP 14废除 |
CMS Collection Phases:1. Initial Mark (Stop-the-World)
2. Concurrent Mark (Concurrent)
3. Remark (Stop-the-World)
4. Concurrent Sweep (Concurrent)
Process: (White, Gray, Black)
❌ CPU Resource Sensitivity ❌ Floating Garbage ❌ Space Fragmentation |
| G1 GC | -XX:+UseG1GC |
G1 is designed for multi-core CPUs and large memory servers, and has become the mainstream garbage collector in modern JVMs.
Instead of continuous generations, G1 divides the heap into multiple regions: ✅ Multi-CPU Optimization ✅ No Fragmentation ✅ Predictable Pause Times ✅ Garbage-First Priority
|

Throughput = User Time / (User Time + GC Time)
15 GC Optimization:
1) jps is a command-line tool to list running Java processes with various output options.
| -l | Shows process ID + full main class name or JAR path | 12345 com.example.MyApplication |
| -q | Shows only process IDs (quiet mode) | 12345 |
| -m | Shows process ID + main method arguments | 12345 MyApplication --port=8080 |
| -v | Shows process ID + JVM arguments | 12345 MyApplication -Xmx2g -XX:+UseG1GC |
2) jinfo - Java Configuration Info
jinfo is a command-line tool to view and dynamically modify JVM parameters for a running Java process. It can also display system properties and dump configuration information.
3) jstat - JVM Statistics Monitoring Tool
jstat is a command-line tool to monitor JVM runtime statistics, including memory status, garbage collection activity, and class loading information.
4) jstack - Thread Dump Tool
jstack is a command-line tool to print Java thread dumps for a running JVM process or core file. It's essential for diagnosing thread-related issues like deadlocks, hangs, high CPU usage, and responsiveness problems.
Example:
- Kafka consumer, use command "watch -n [interval] -d 'jstat -gc [pid]' " to check, find that young generation gc is 5~10 / sec. So most objects are created in Eden.
- JVM didn't allocate the correct parameters for sufficient ratio.
- -Xmx 4096m, -Xms 4096m, -Xmn 2560m, -XX Survival Ratio=23
- then the young generation gc is 1 / sec, FGC is every 12 hours 1 time.
https://blog.csdn.net/weixin_43717407/article/details/118662068

 浙公网安备 33010602011771号