
Prometheus前景分析及PromQL快速入门
作者:尹正杰
版权声明:原创作品,谢绝转载!否则将追究法律责任。
目录
一.Prometheus概述
1.Prometheus到底有多火
- Prometheus的官网地址:
	https://prometheus.io/

- 无论是官方还是社区大佬都在研究Prometheus系统:
	https://prometheus.io/docs/instrumenting/exporters/

- 很多系统集成了Prometheus的SDK:
	https://prometheus.io/docs/instrumenting/exporters/#software-exposing-prometheus-metrics

- ranking数据库排名:(2024年能排进前50,2020年甚至能排进前3)
	https://db-engines.com/en/ranking
2.Prometheus的优缺点
学习Prometheus优点:
	- Prometheus有丰富的promQL实时查询聚合引擎;
	- 单机千万级别并发写入的QPS;
	- kubernetes监控的不二选择;
	- Prometheus可以被各种SDK集成;
	- 学习Prometheus目前也是云原生高薪的必备技能;

Prometheus面临的问题:
	- 如何实现存储的高可用性;
	- 如何实现高基数查询延迟和资源开销高的问题;
	- 如何实现采集端exporters的批量管理;
	- 如何实现长期查询降低采样以节省成本;
	- 如何实现配置文件操作繁琐的配置;
3.Prometheus学习目标
- 第一梯队: 熟悉Prometheus及其生态圈内组件的使用,配置调优;
	1.可以熟练配置采集常见的对象,比如: docker,K8S,Ceph,ElasticStack生态及常见的中间件监控。
	2.熟练编写PromQL查询和告警表达式,熟练运用各种函数;
	3.alertmanager路由和分组配置;
	4.使用"预聚合"手段对"重查询"提速;

- 第二梯队: 能够发现单点问题并有高可用解决方案;
	1.采集端高可用性;
	2.存储的高可用性;
	3.查询告警高可用性;

- 第三梯队: 对时序监控底层原理的理解有较深理解;
	1.倒排索引;
	2.时序数据压缩算法;
	3.数据聚合的实现;
	4.底层原理针对:采集,传输,存储,查询,告警,优化等维度。

- 第四梯度: 可以进行二次开发或者使用Go开发周边项目以集成Prometheus到对应SDK;
	1.研发exporters管理平台;
	2.结合CMDB产品,监控和服务树整合的平台;
	3.监控链路配置平台;


温馨提示:
	"运维同学"侧重前三个阶段教学,第四阶段适合"运维开发同学"后期拔高,因为需要学员有Golang基础。
二.Prometheus的基本概念
1.sample数据点
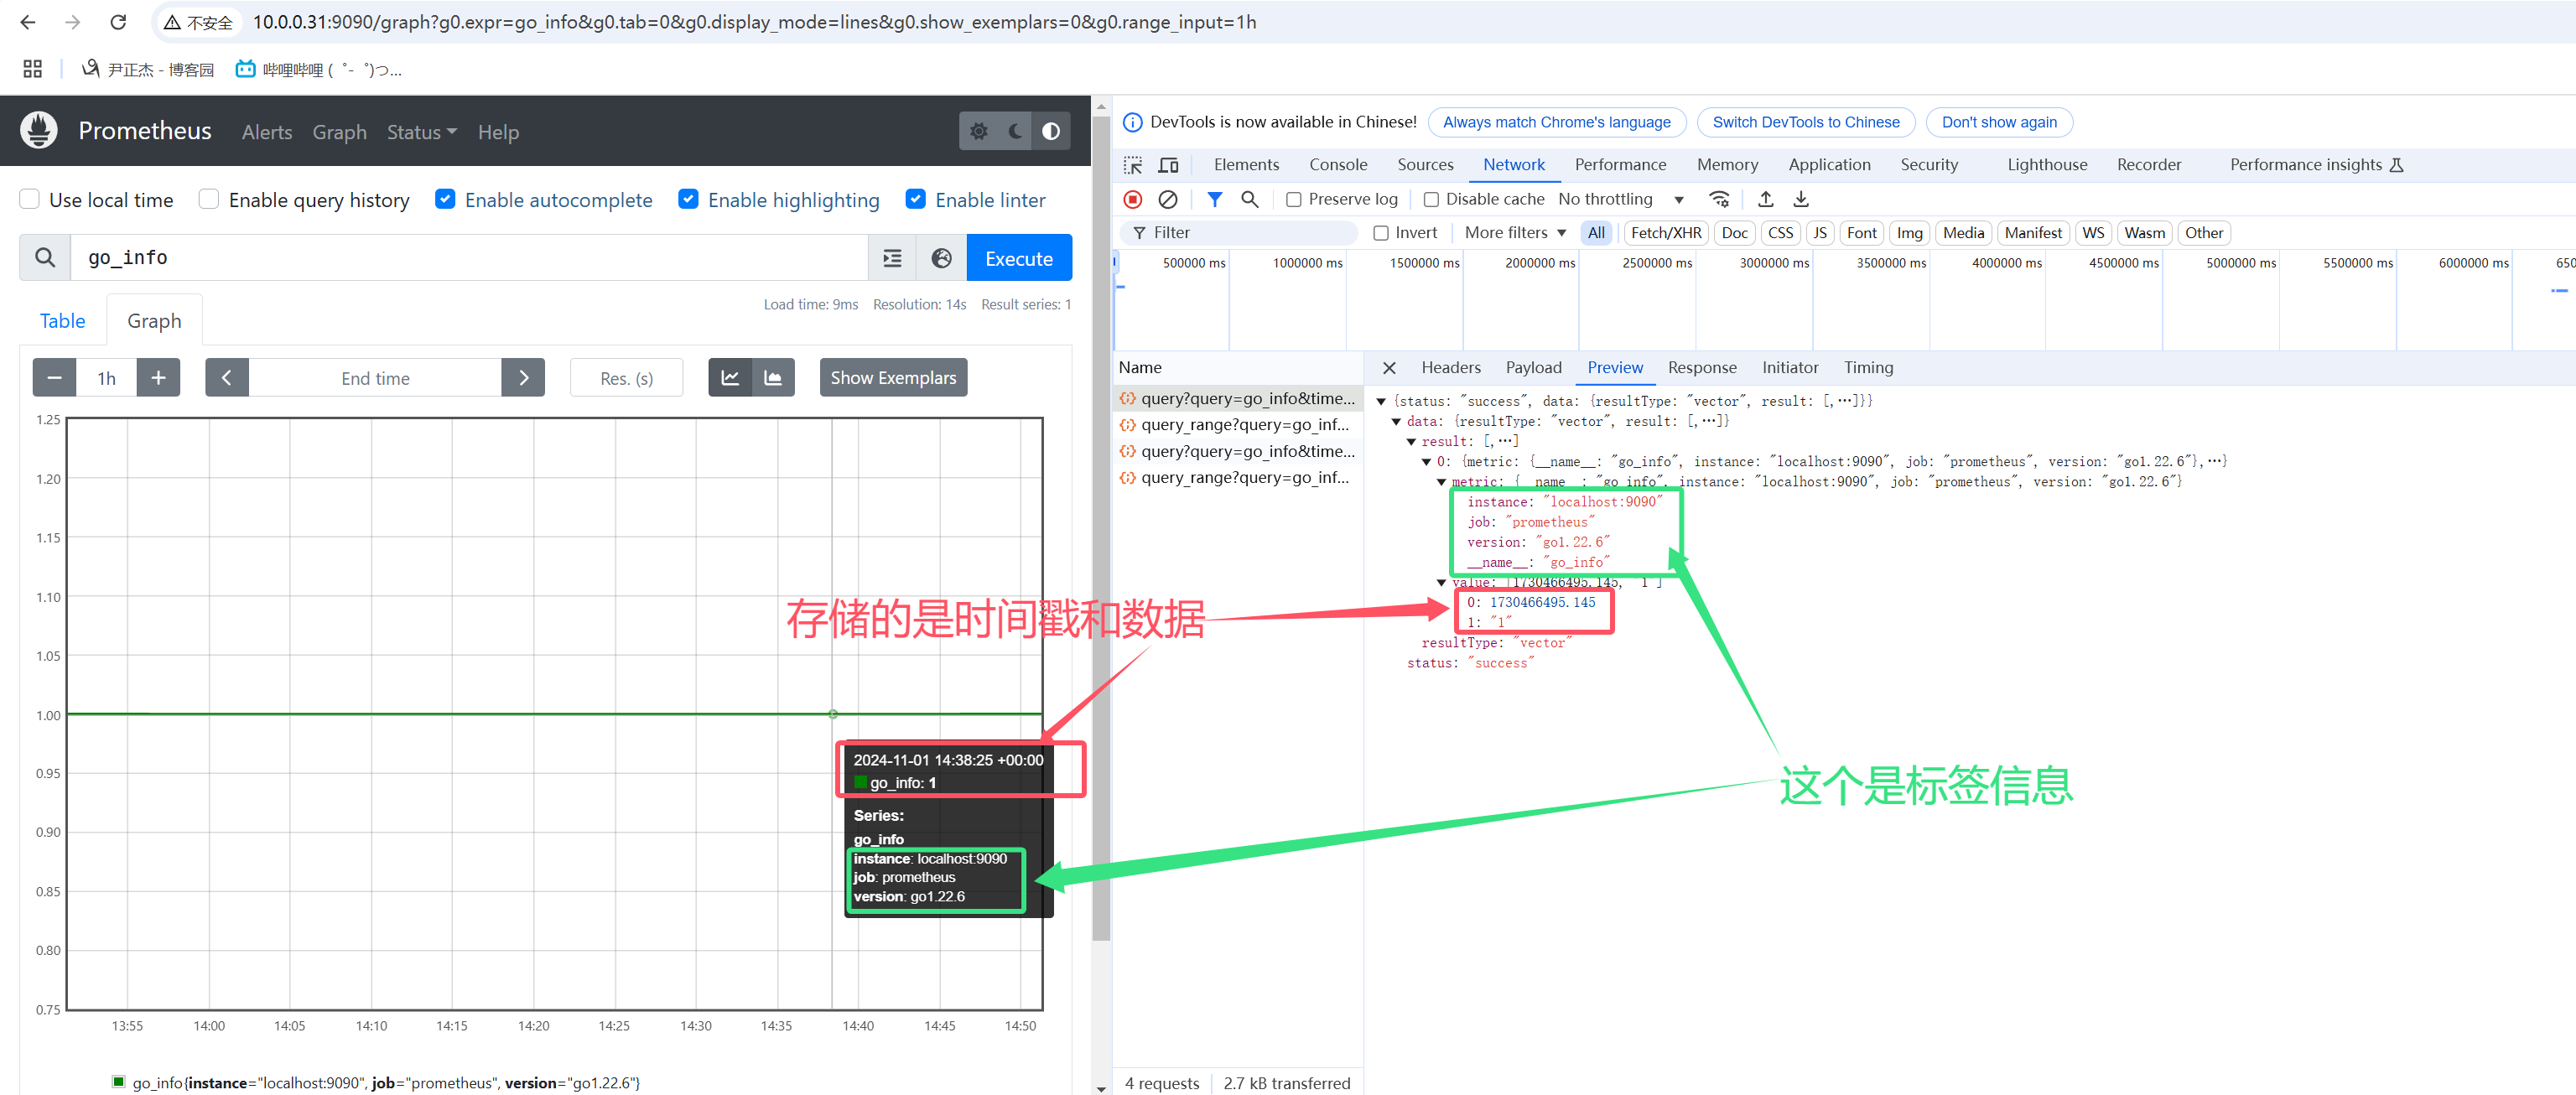

Sample代表的是一个数据点,这个数据点内置了Point,里面存储的信息包含时间戳,数值及标签信息。

如上图所示,表示1个Sample数据点的案例,而下图表示的是5个Sample数据点的案例。


Golang源代码参考如下:
    // github.com/prometheus/prometheus/pkg/labels/labels.go
    type Label struct {
        Name,Value string
    }

    // github.com/prometheus/prometheus/pkg/labels/labels.go
    type Lables []Label


    // github.com/prometheus/prometheus/promql/value.go
    type Point struc {
        T int64
        V float64
    }

    // github.com/prometheus/prometheus/promql/value.go
    type Sample struc {
        Point

        Metric labels.Labels
    }
2.Prometheus四种查询类型
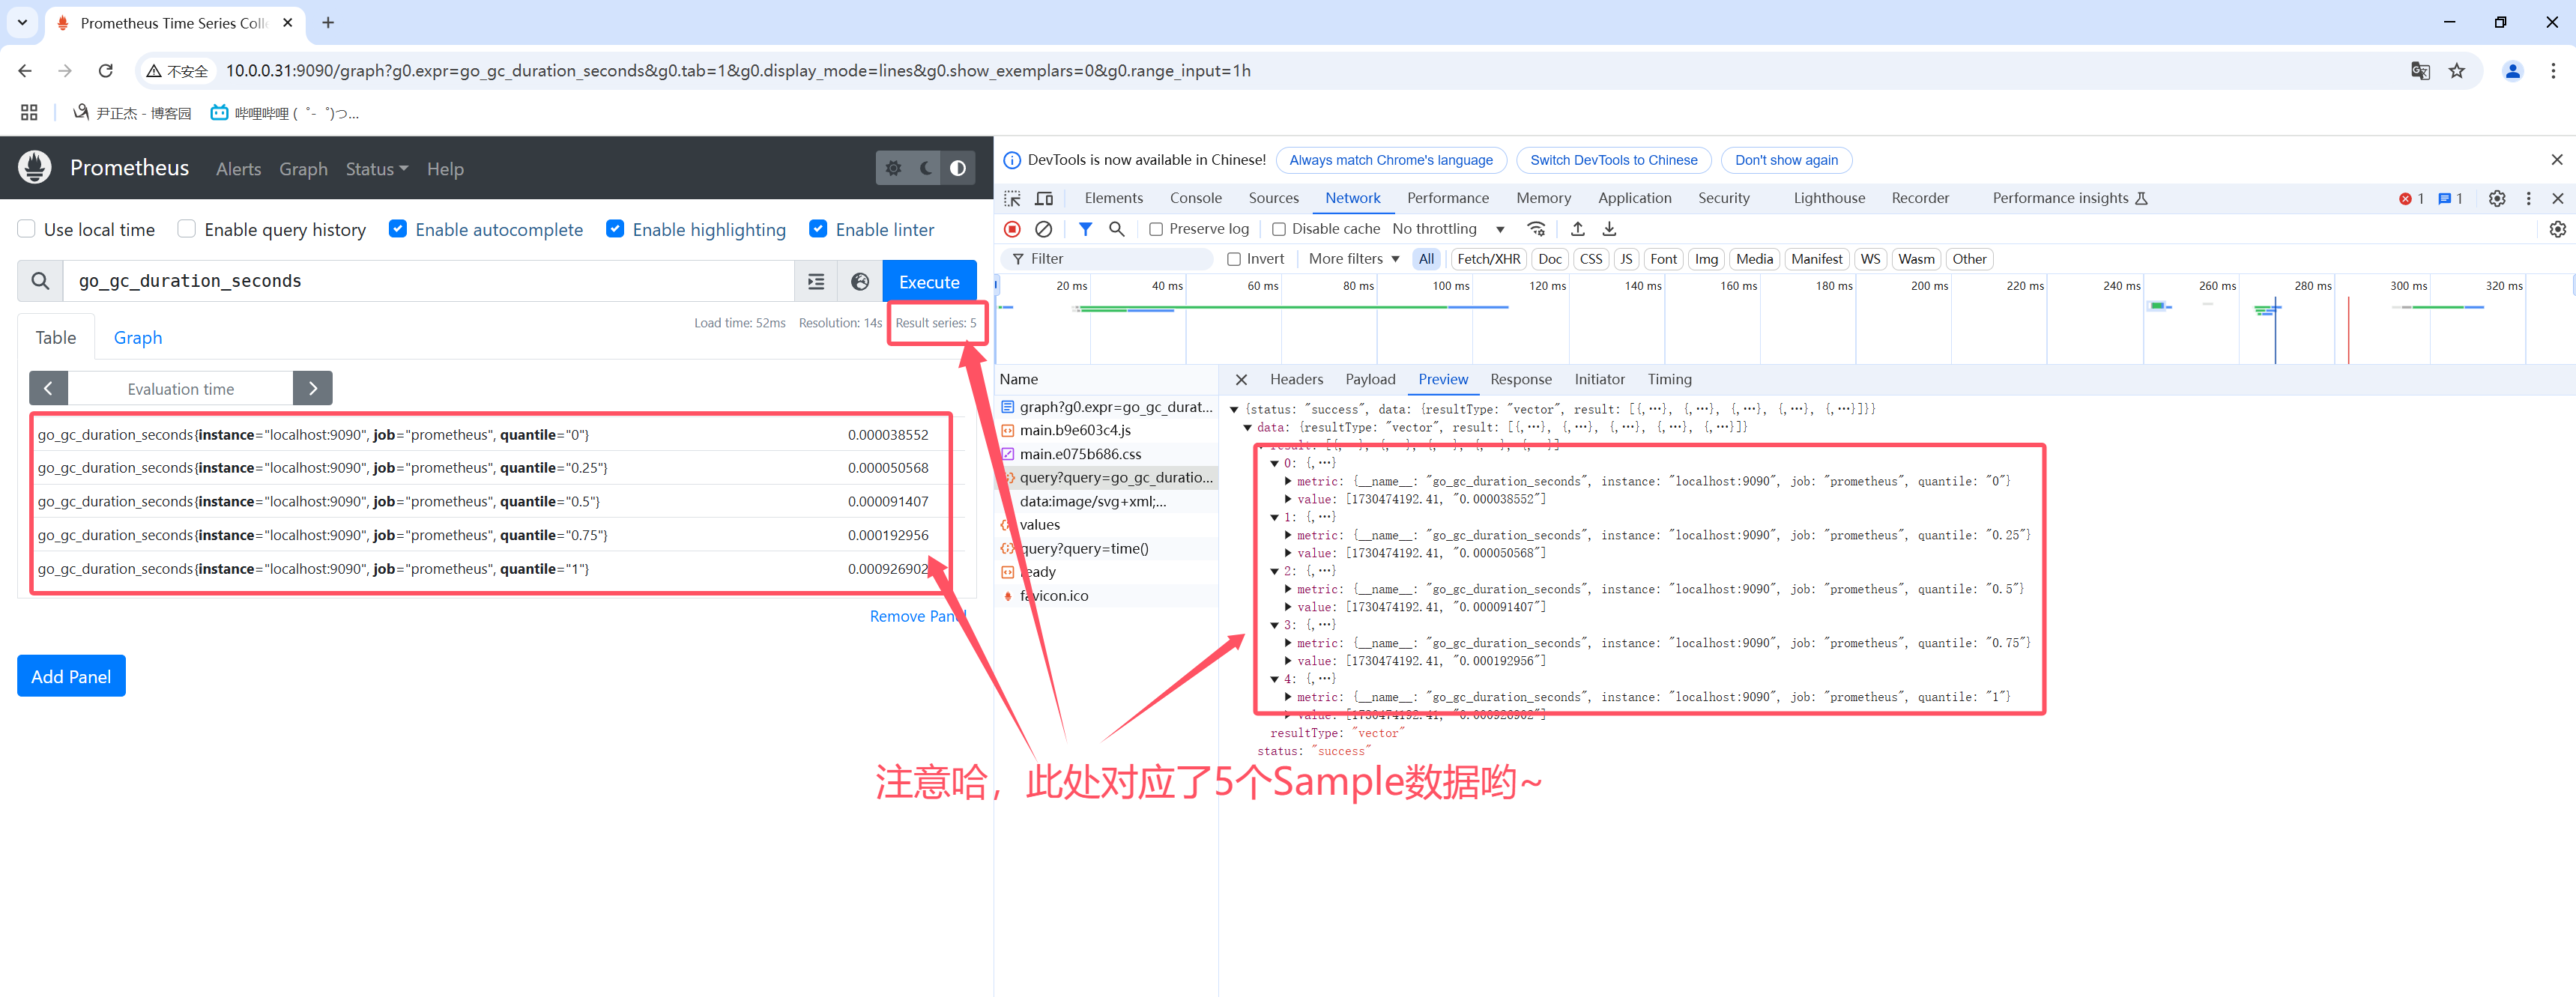
如上图所示,官方提供了四种查询类型
	- Instant vector(即时向量):
		一组时间序列,包含每个时间序列的单个样本,所有样本共享相同的时间戳,表示一个时刻的结果。

	- Range vector(范围向量):
		一组时间序列,包含每个时间序列随时间变化的数据点范围,表示一段时间的结果。

	- Scalar(标量)
		一个简单的数字浮点值。

	- String(字符串)
		一个简单的字符串值;当前未使用

参考地址:
	https://prometheus.io/docs/prometheus/latest/querying/basics/#expression-language-data-types
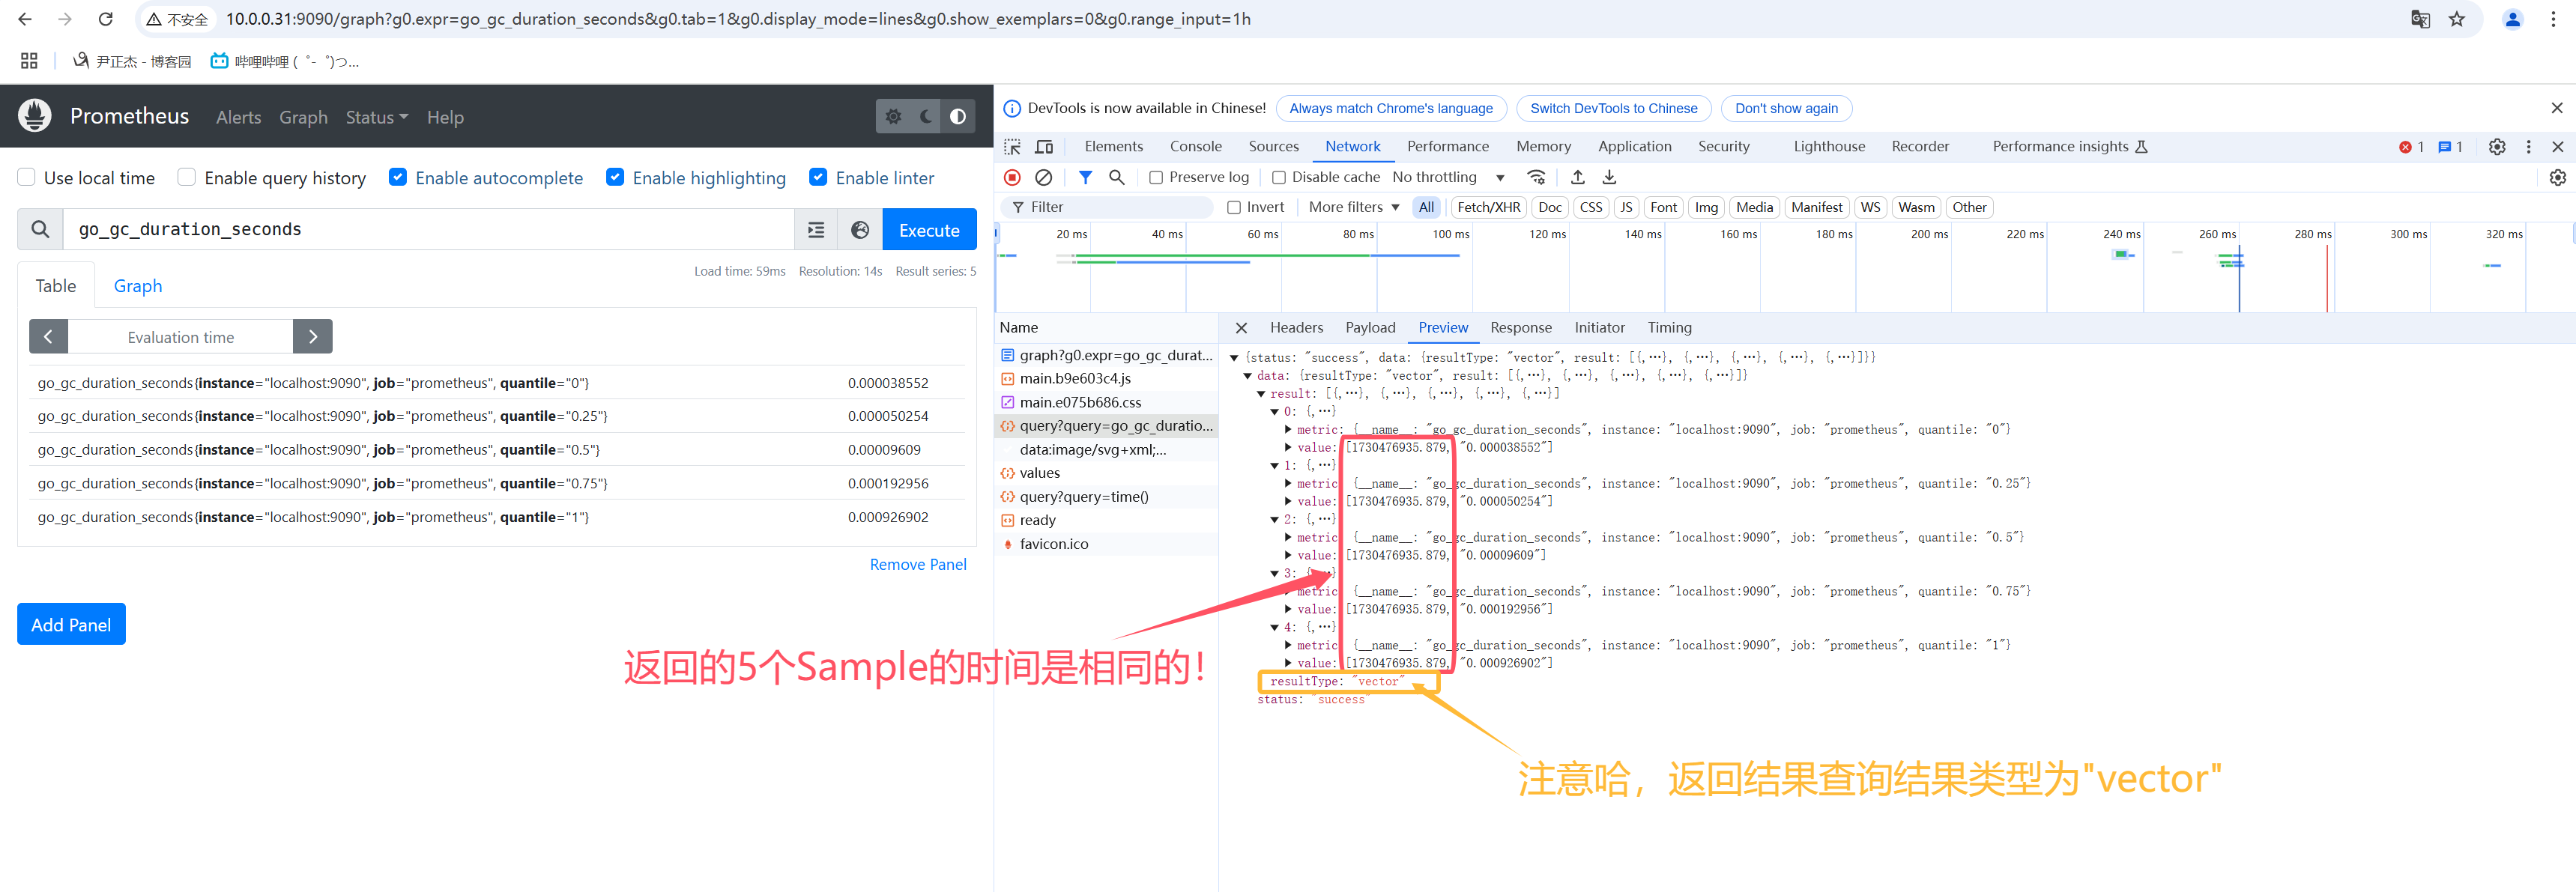
2.1 Instant vector(即时向量,一个时刻的结果)
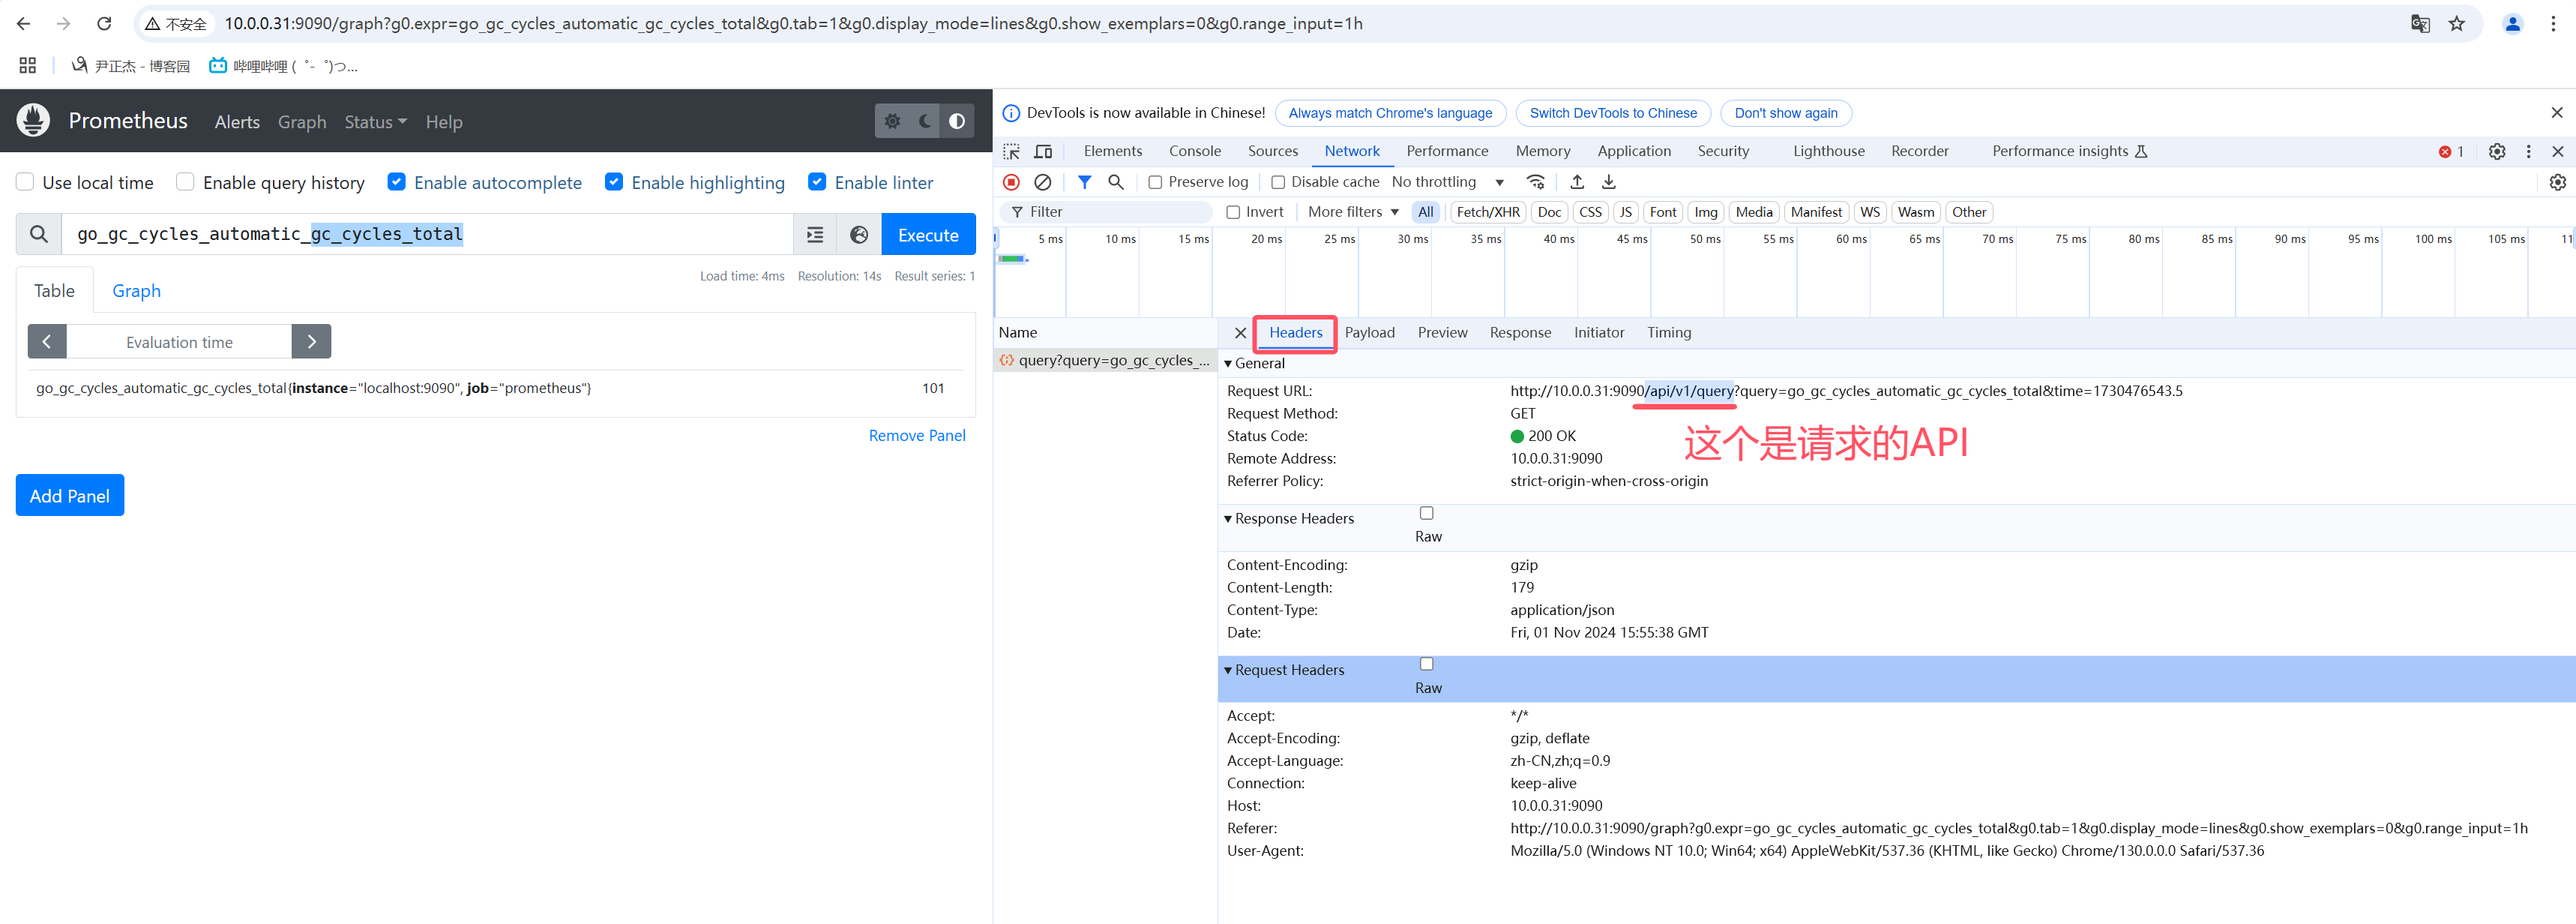
Instant vector(即时向量):
	一组时间序列,包含每个时间序列的单个样本,所有样本共享相同的时间戳,表示一个时刻的结果。

Instant vector概要:
	- 1.vector向量源码位置:
		// github.com/prometheus/prometheus/promql/value.go
		type Vector []Sample

	- 2.vector向量是Sample的别名,但是所有Sample具有相同timetamp,常用做instant_query的结果;

	- 3.如上图所示,在Prometheus的WebUI上table查询,对应查询接口是"/api/v1/query"

	- 4.如下图所示,在Prometheus的WebUI上返回值的类型(resultType)是: "vector"
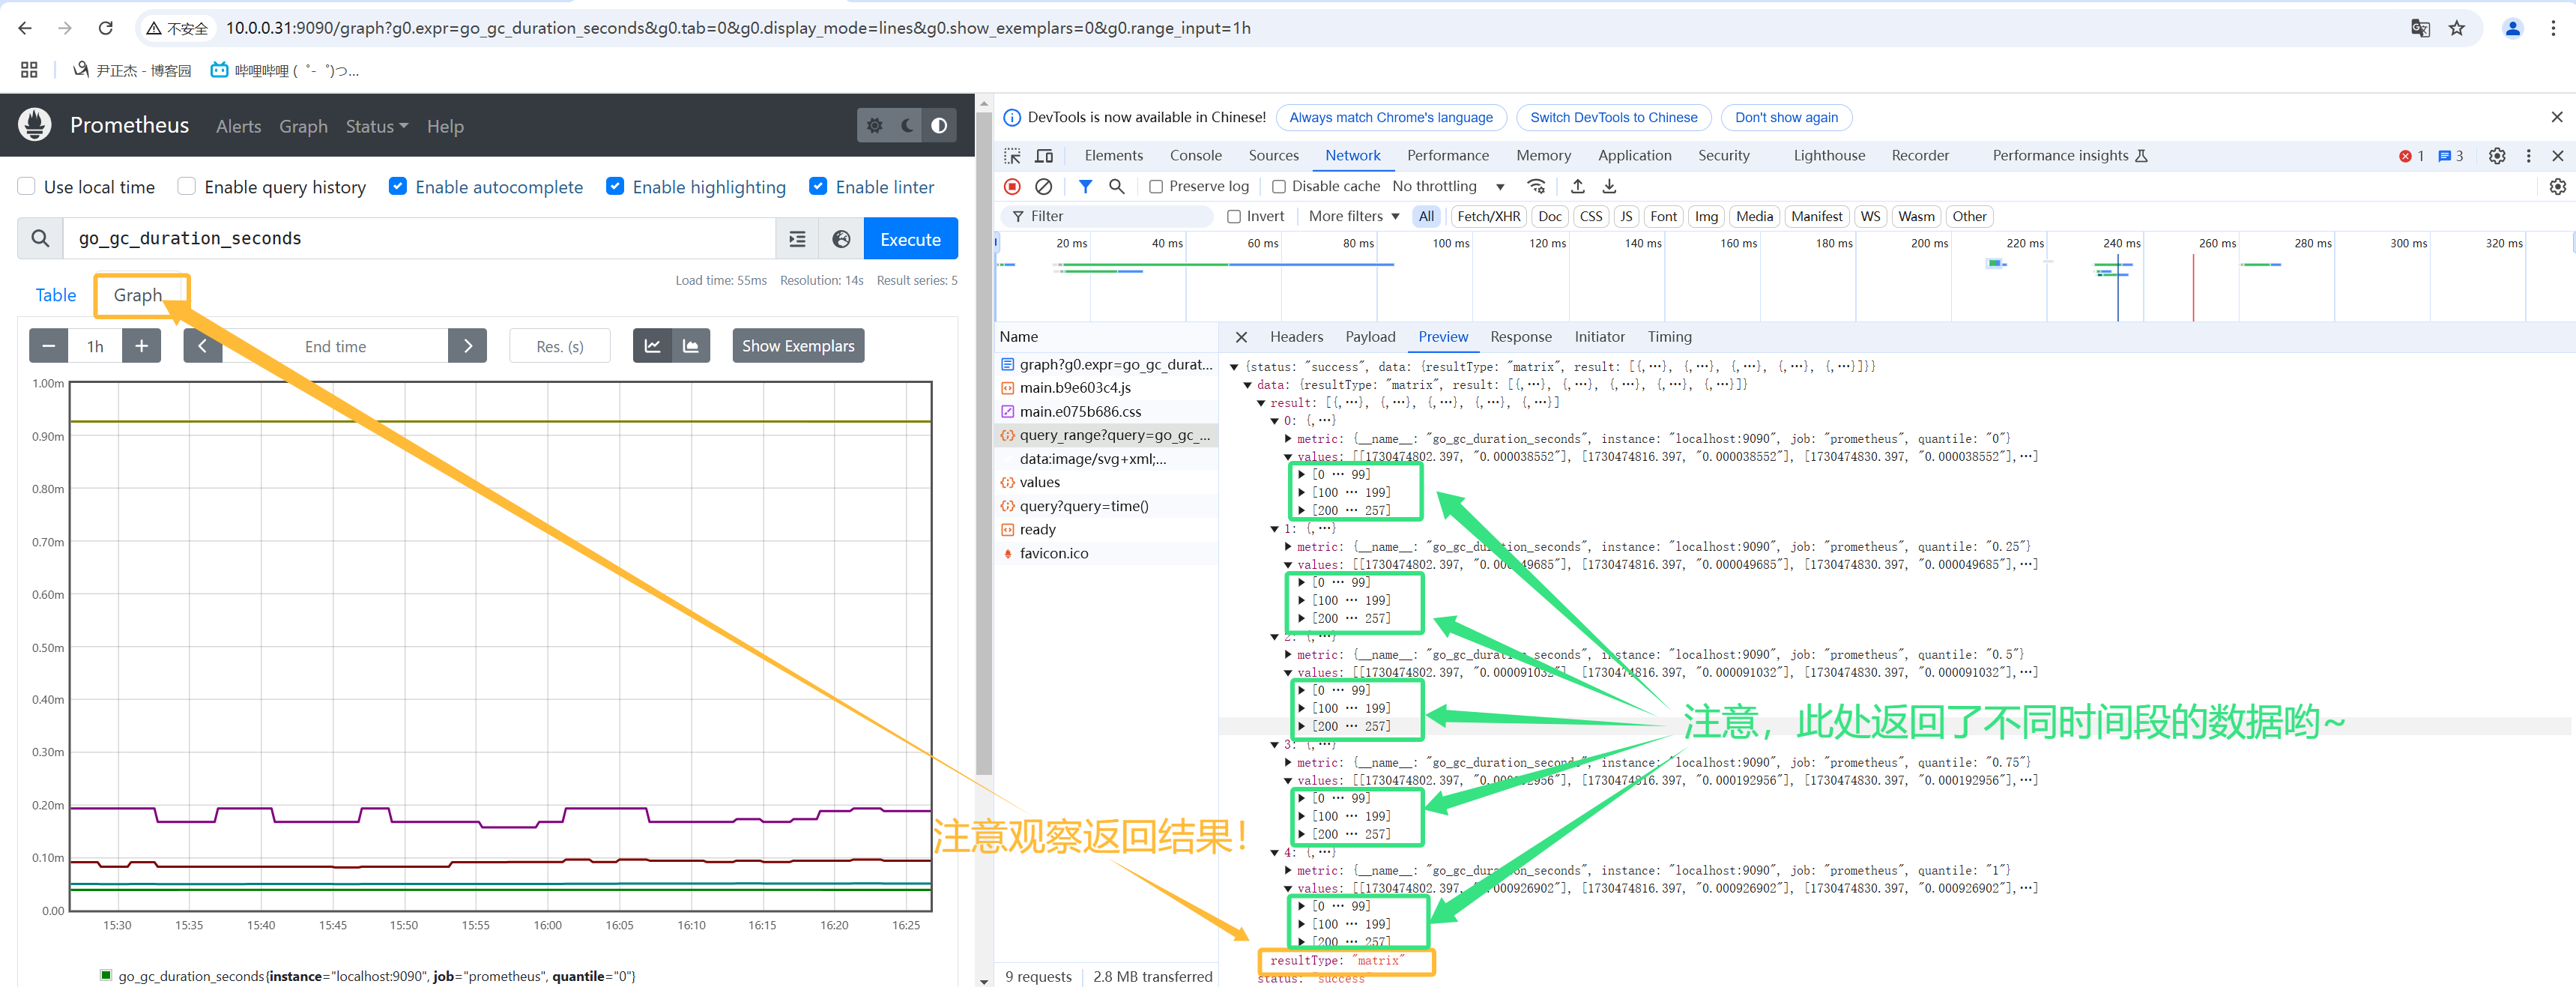
2.2 Range vector(范围向量,一段时间的结果)
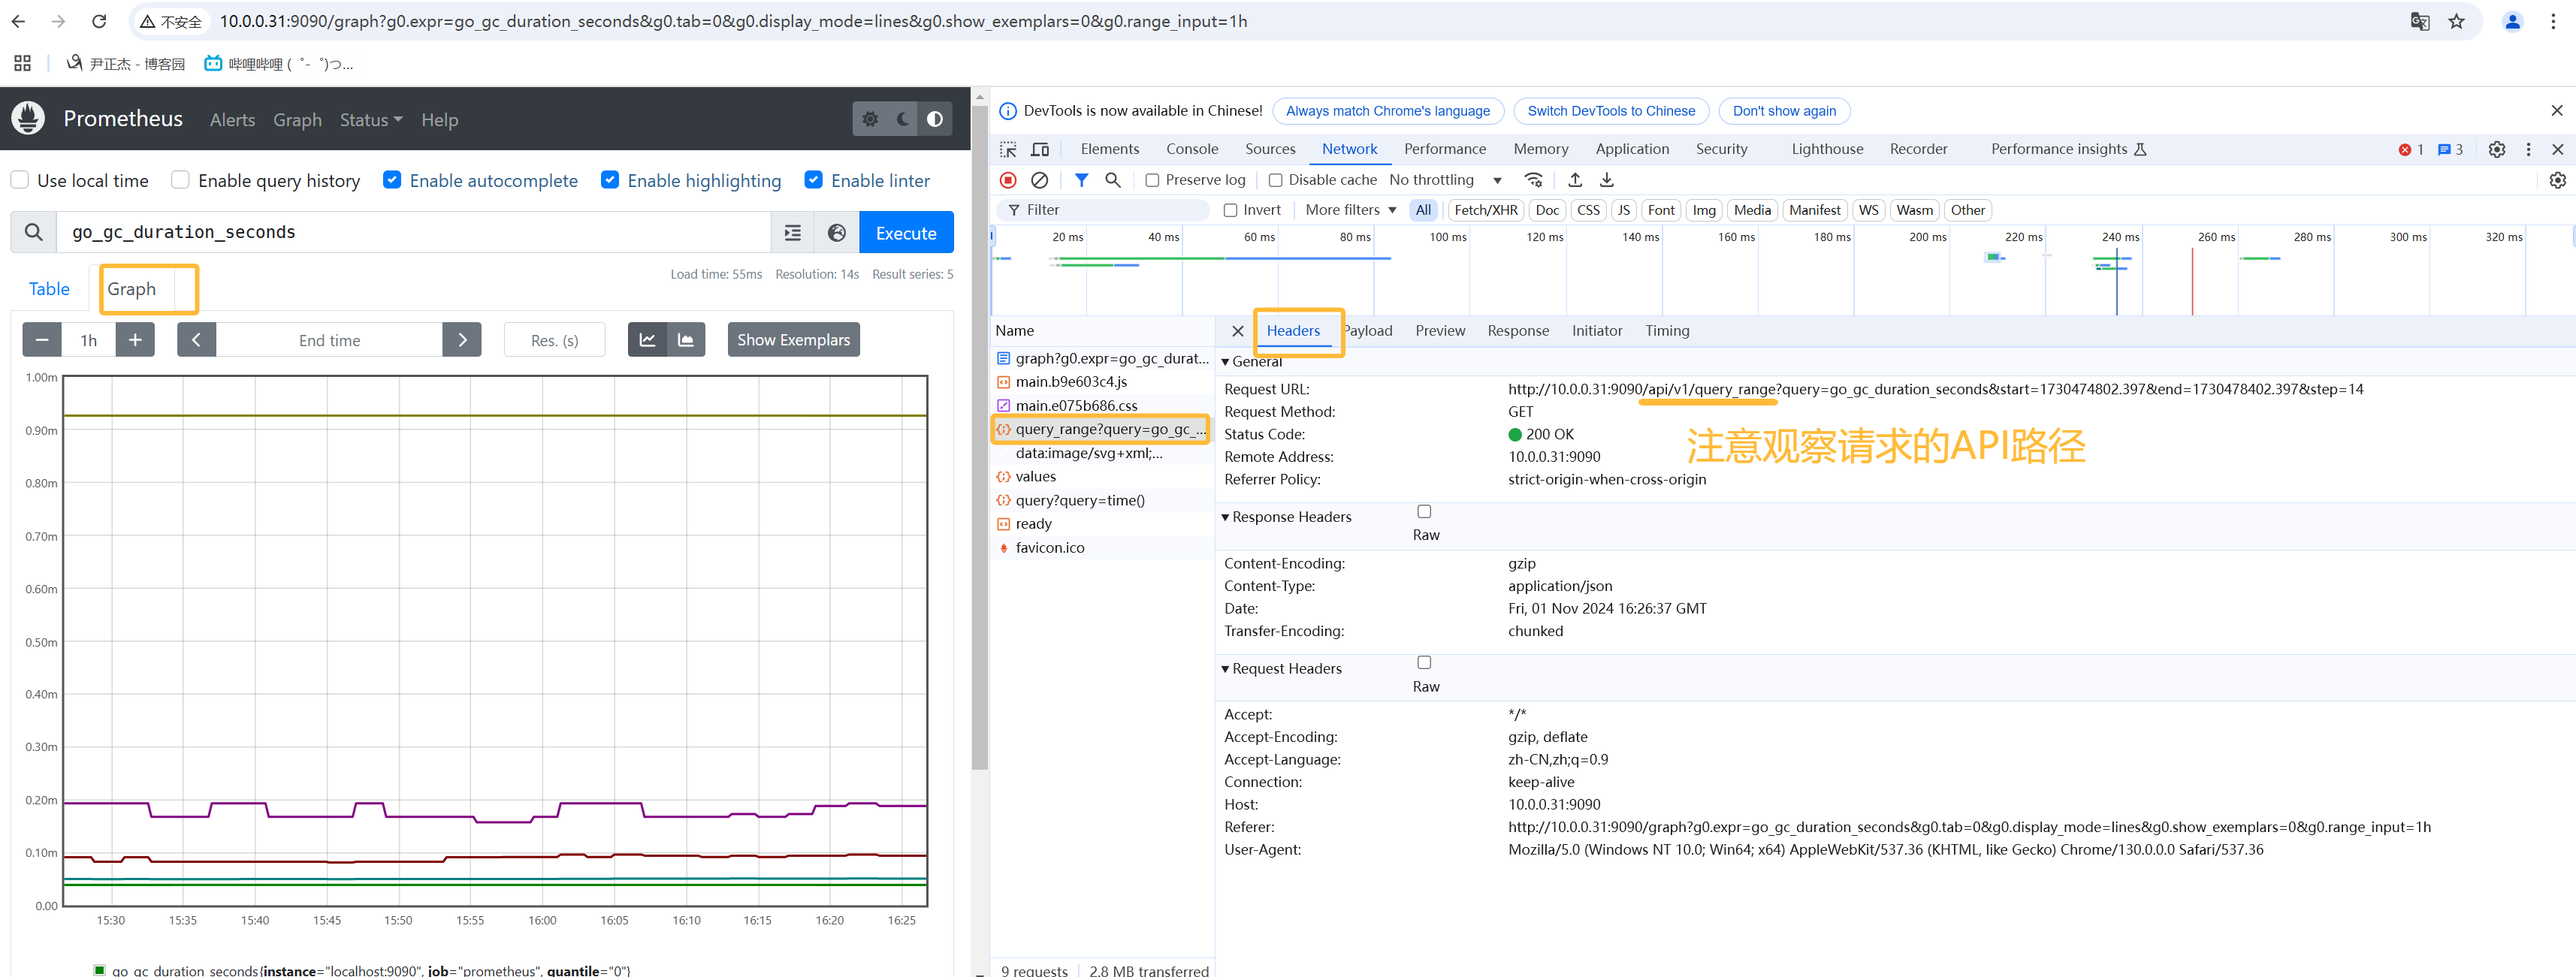
Range vector(范围向量):
	一组时间序列,包含每个时间序列随时间变化的数据点范围,表示一段时间的结果。

Range vector(范围向量)概要:
	- 1.如上图所示,在Prometheus页面上就是graph查询,对应查询接口是"/api/v1/query_range";

	- 2.如下图所示,返回的结果就是Matrix矩阵;

	- 3.Matrix是Series的切片,源码位置:
		// github.com/prometheus/prometheus/promql/value.go
		type Matrix []Series

	- 4.Series是标签组和Points的组合,源码位置:
		// github.com/prometheus/prometheus/promql/value.go
        type Series struct {
            Metric []Lables.Labels `json:"metric"`
            Points	[]Point	`json:"values"`
        }
2.3 Scalar(标量,浮点数应用场景)
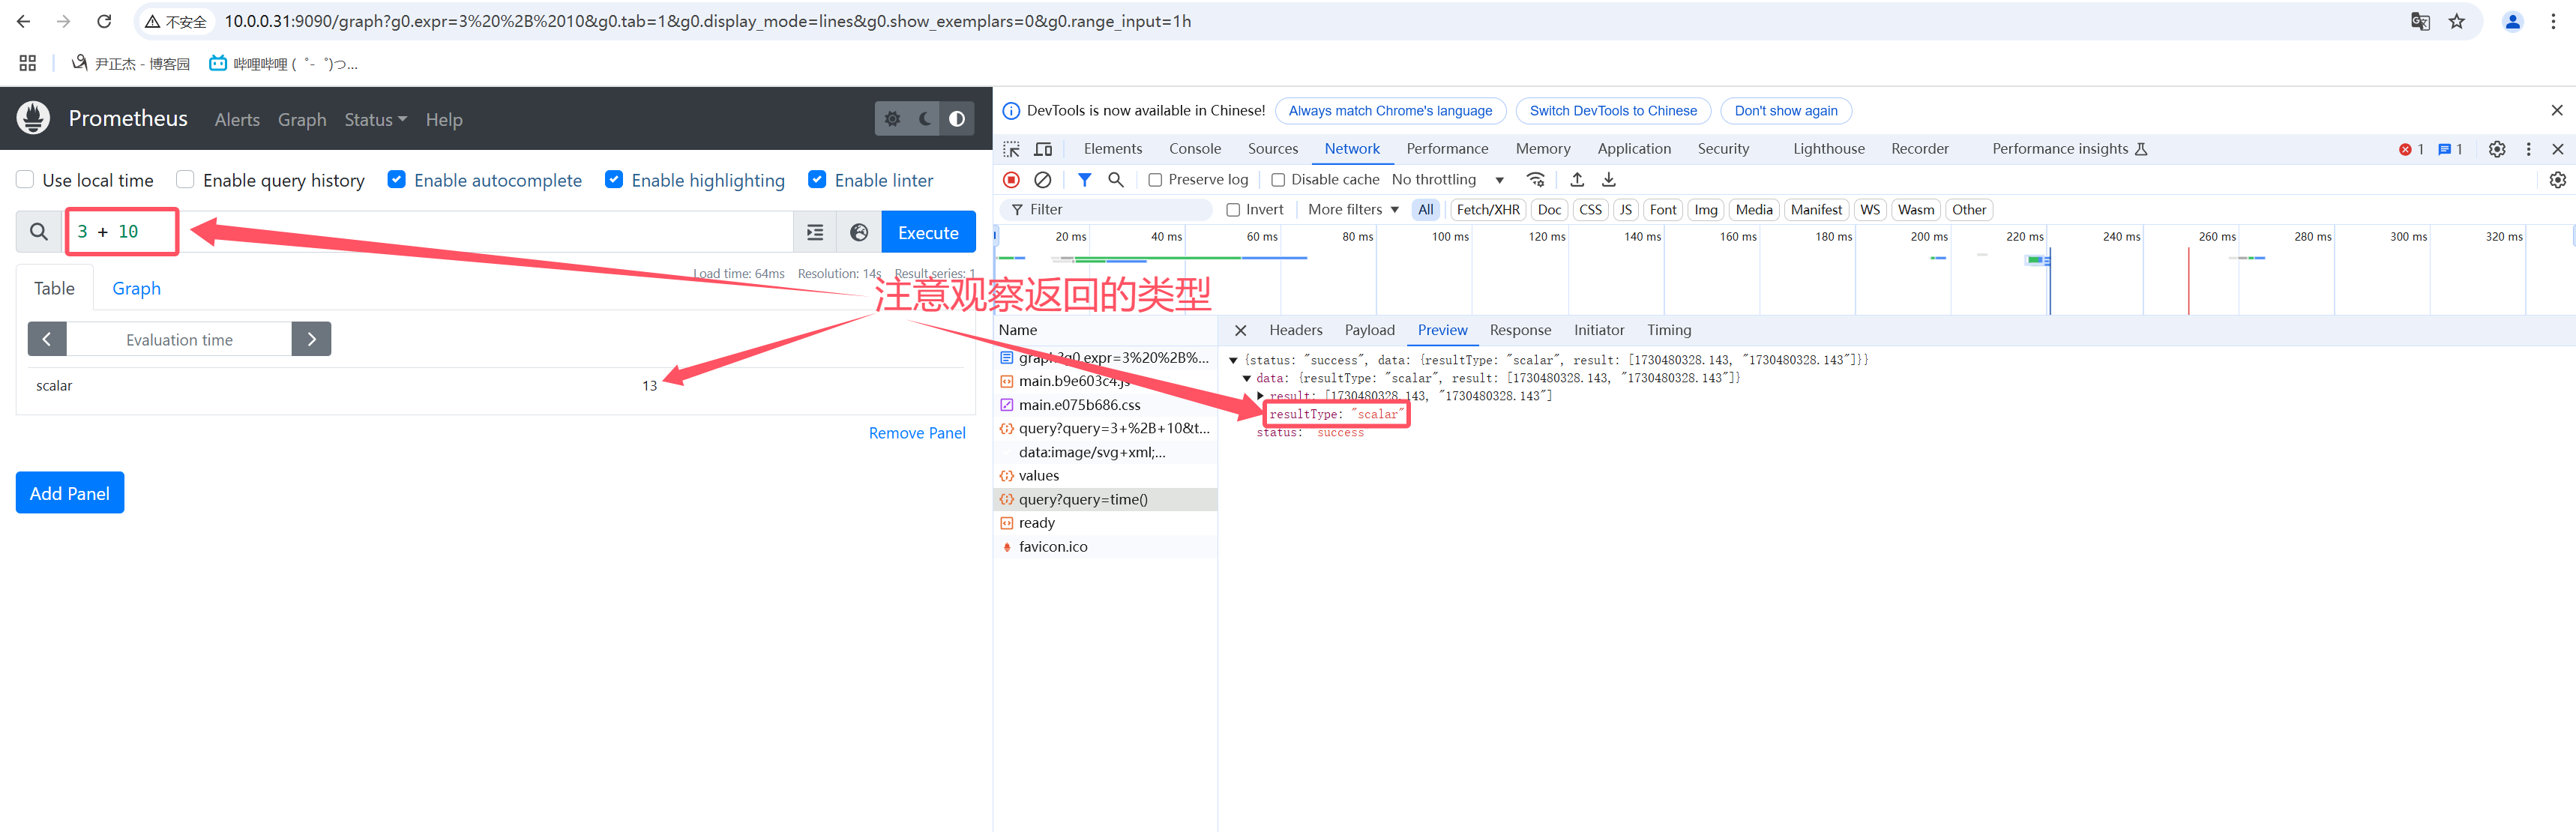
Scalar(标量):
	一个简单的数字浮点值。

如上图所示,在做一些数值运算时,返回的类型就是Scalar了哟~
2.4 String(字符串)
String(字符串)
	一个简单的字符串值;当前未使用
3.Prometheus四种标签匹配模式
3.1 等于
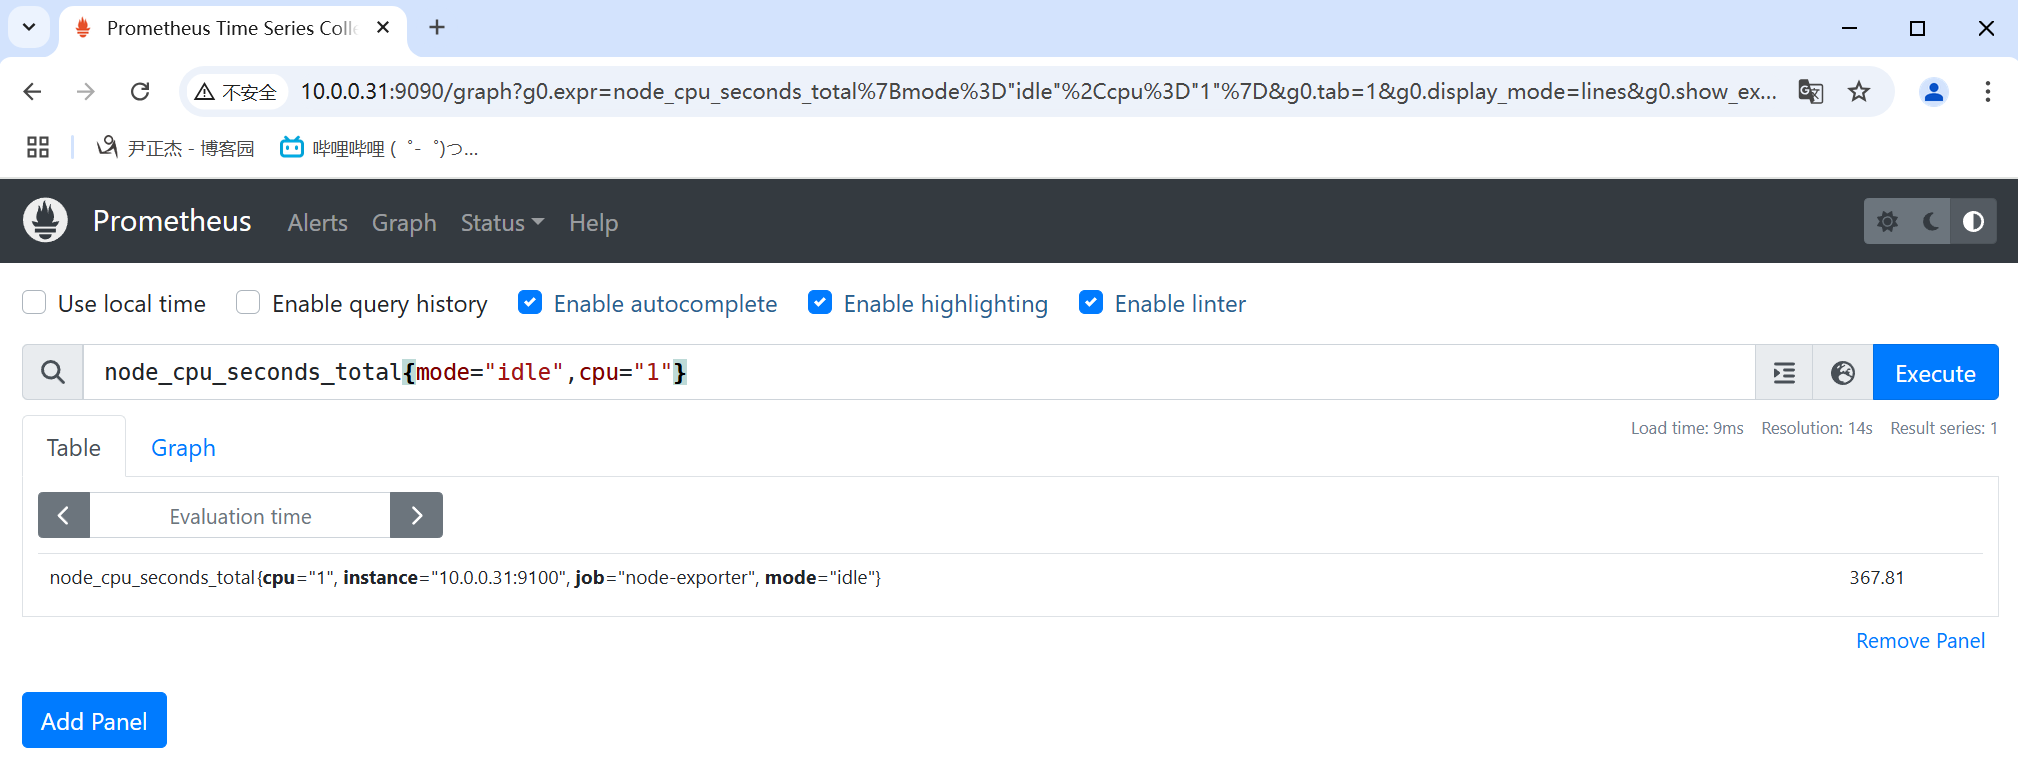
等于的关系使用"="表示。


举个例子:
	node_cpu_seconds_total{mode="idle",cpu="1"}
3.2 不等于
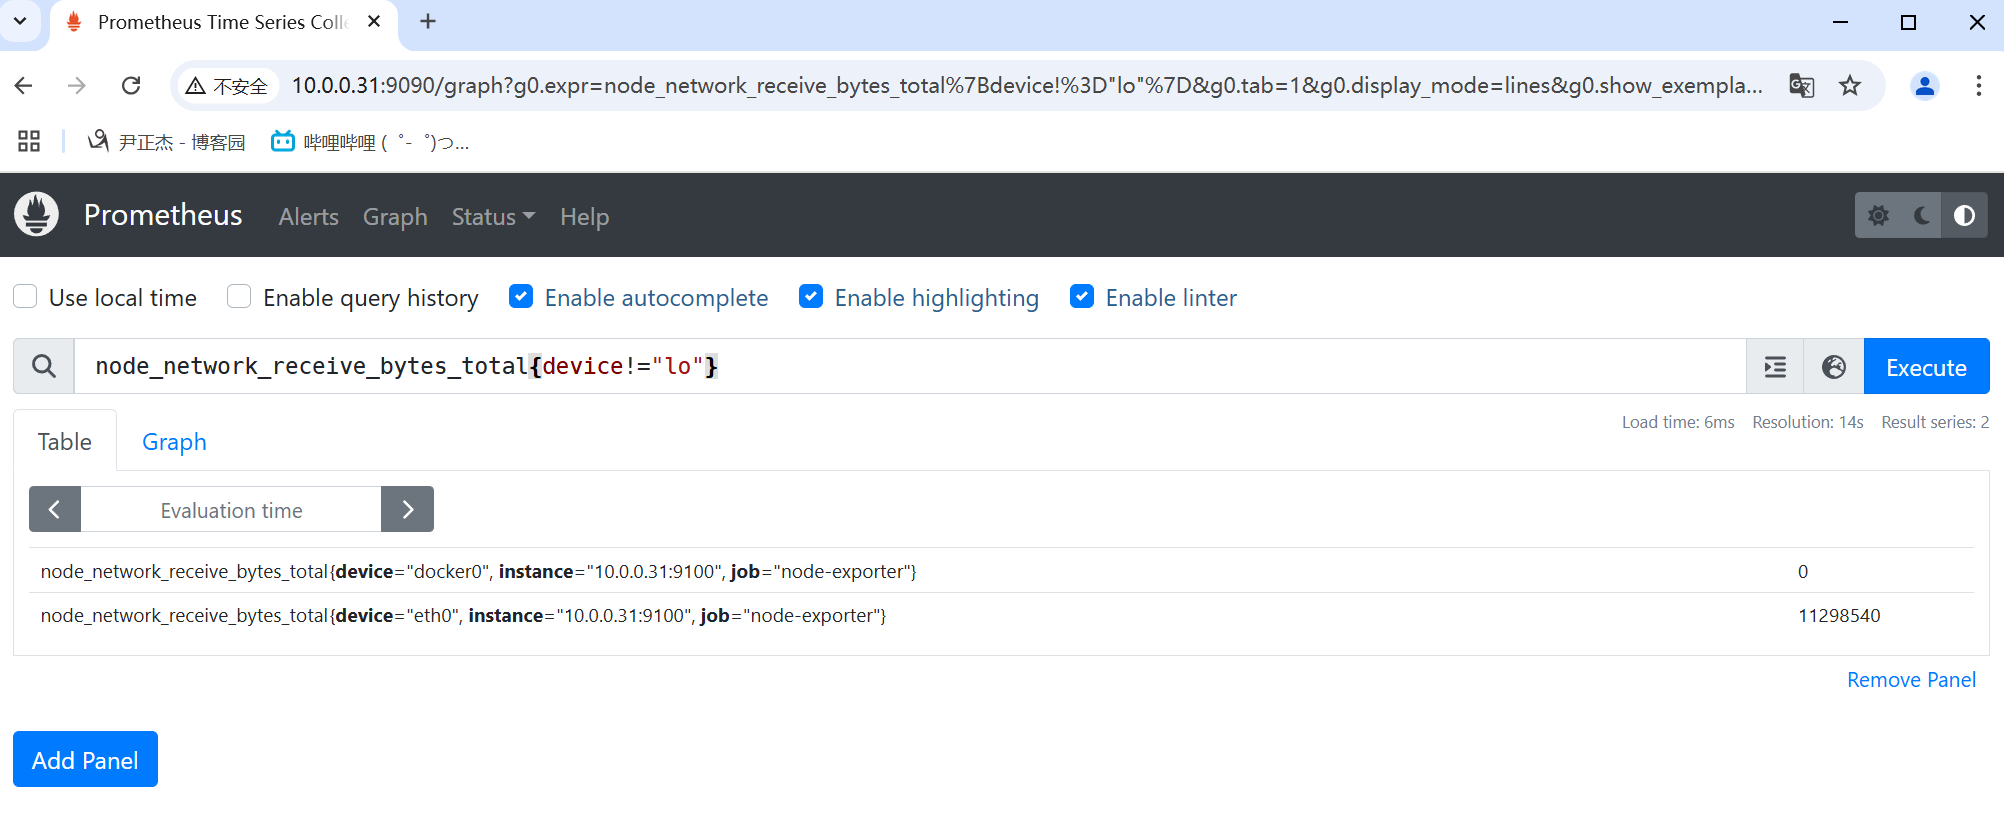
不等于使用"!="表示。

举个例子:
	- node_network_receive_bytes_total{device!="lo"}
	-  prometheus_http_requests_total{code!="200"}
3.3 正则匹配
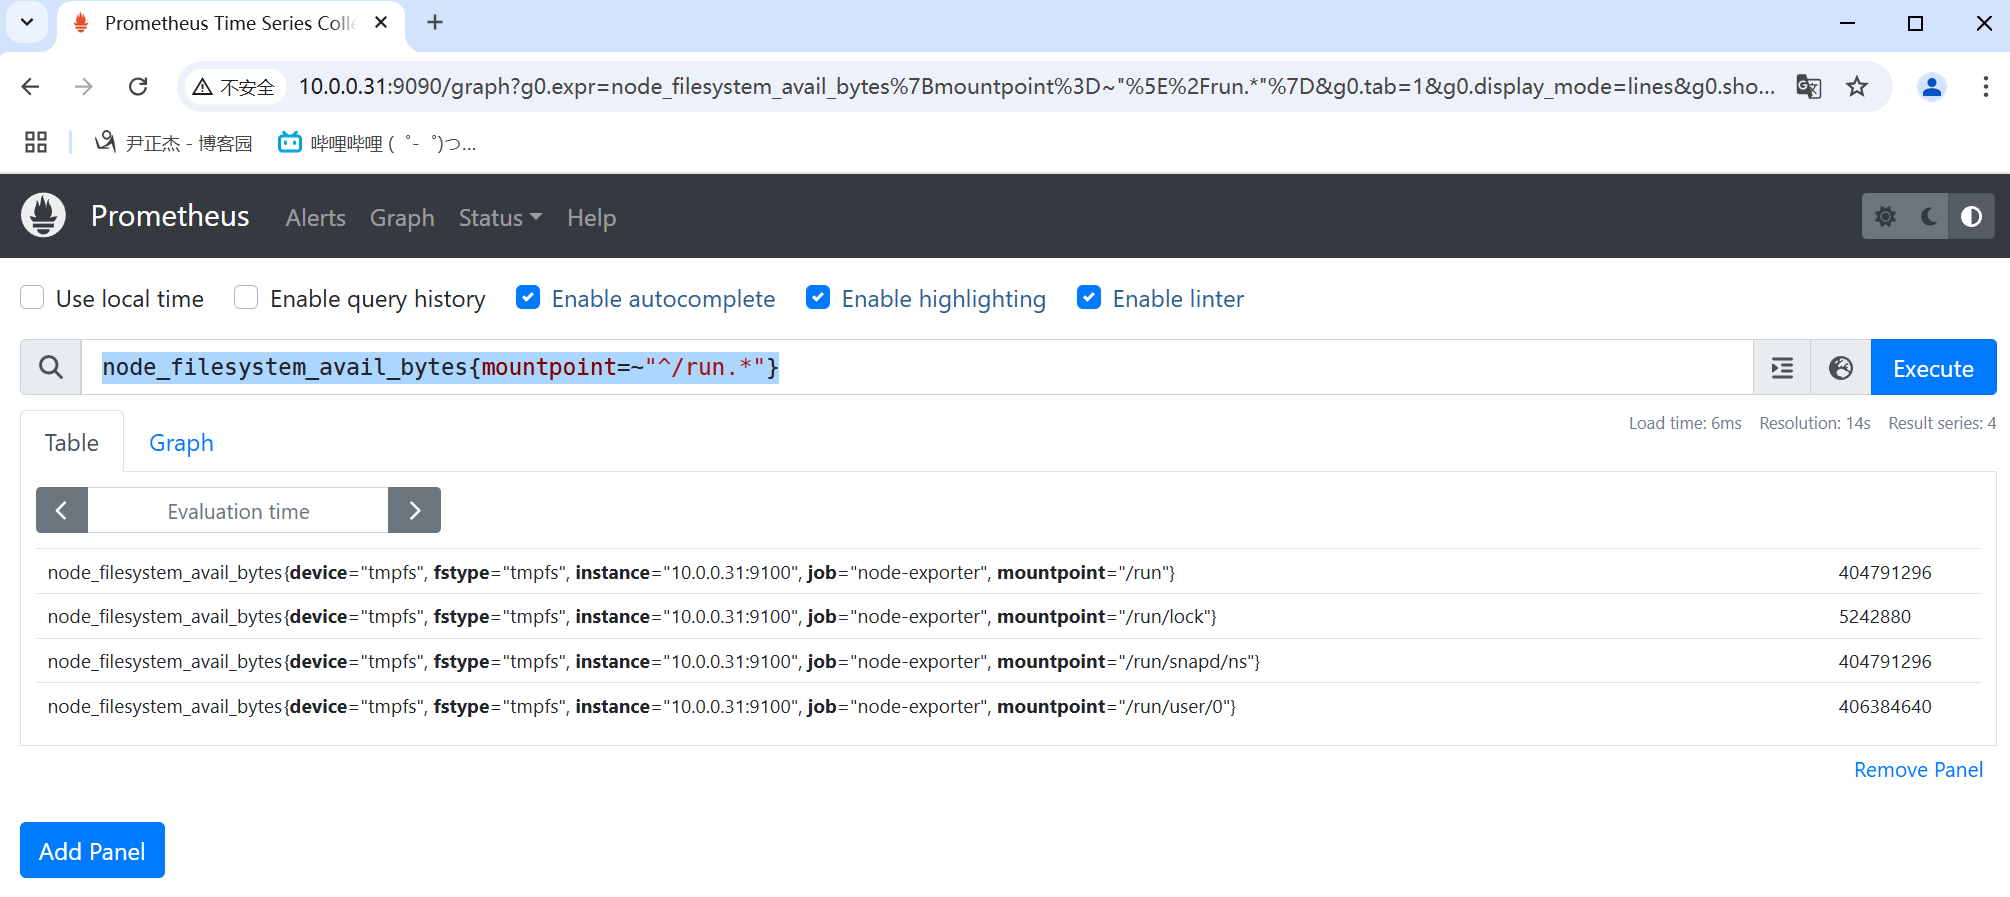
正则匹配使用"=~"表示。其中"__name__"也是个标签,可以匹配metrics。

举个例子:
	- node_filesystem_avail_bytes{mountpoint=~"^/run.*"}
	- prometheus_http_requests_total{handler=~"^/api.*"}
	- {__name__=~"prometheus_engine.*",quantile=~".*0.*"}
4.4 正则非匹配
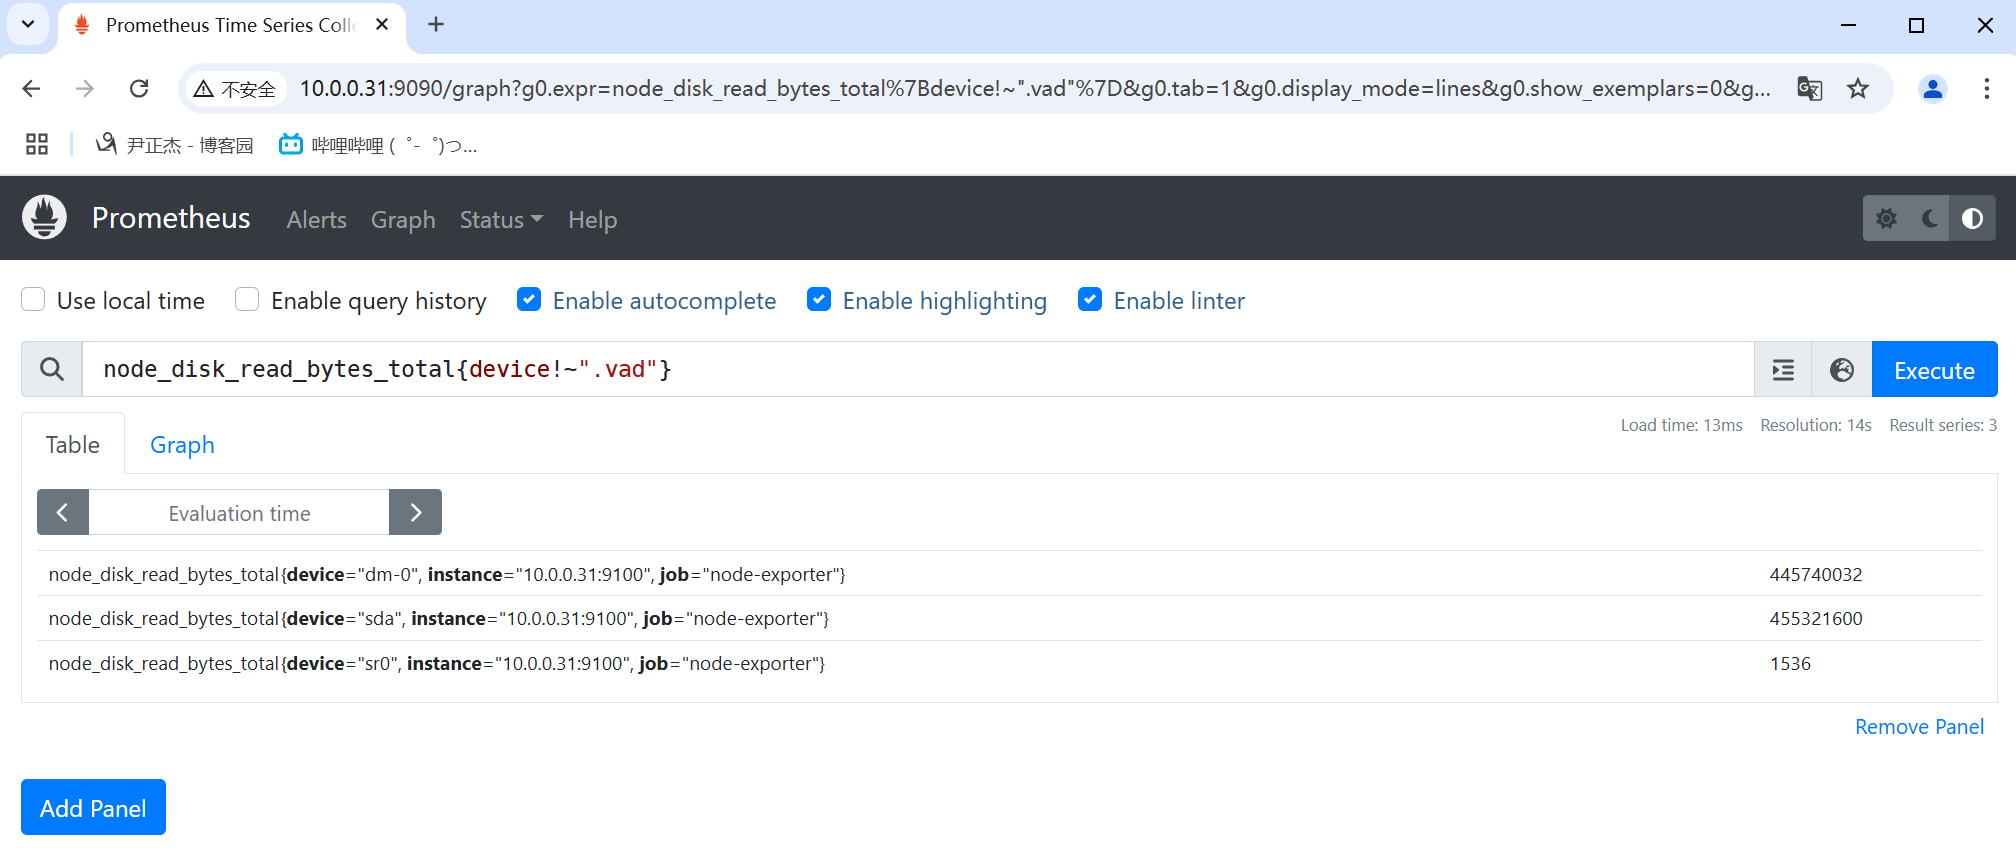
正则非匹配使用"!~"表示。

举个例子:
	- node_disk_read_bytes_total{device!~".vad"}
	- prometheus_http_requests_total{code!=".*00"}
4.Prometheus的四种数据类型
4.1 gauge
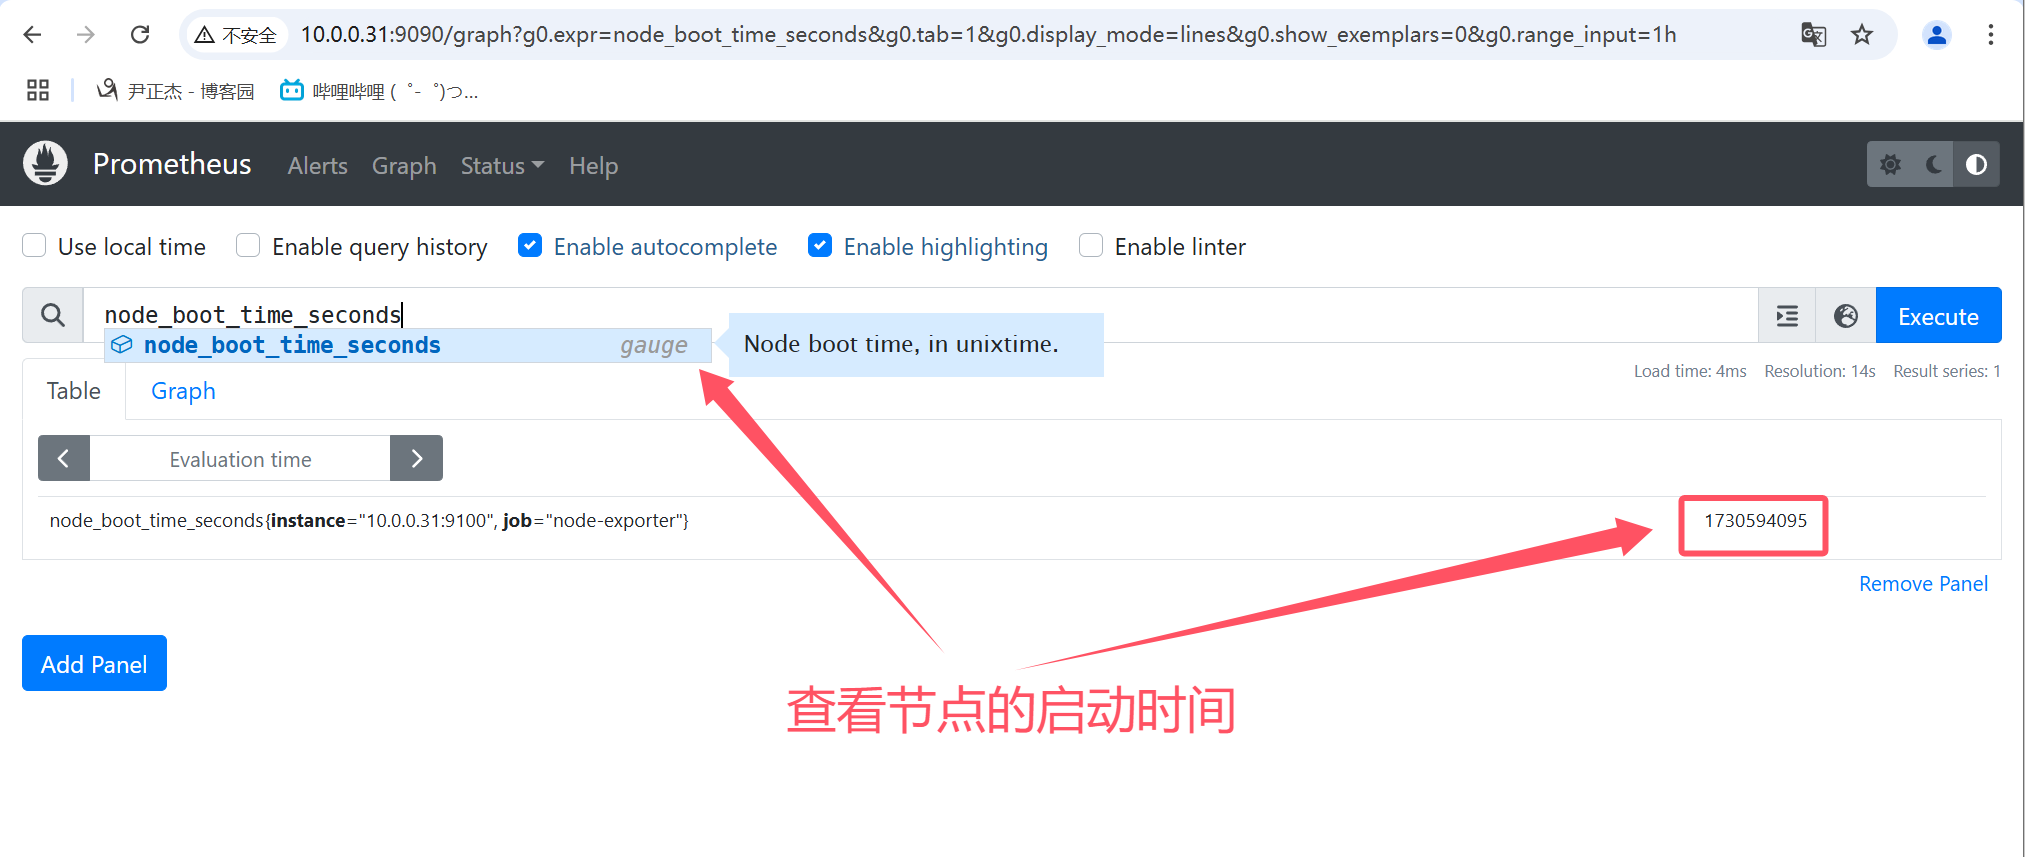
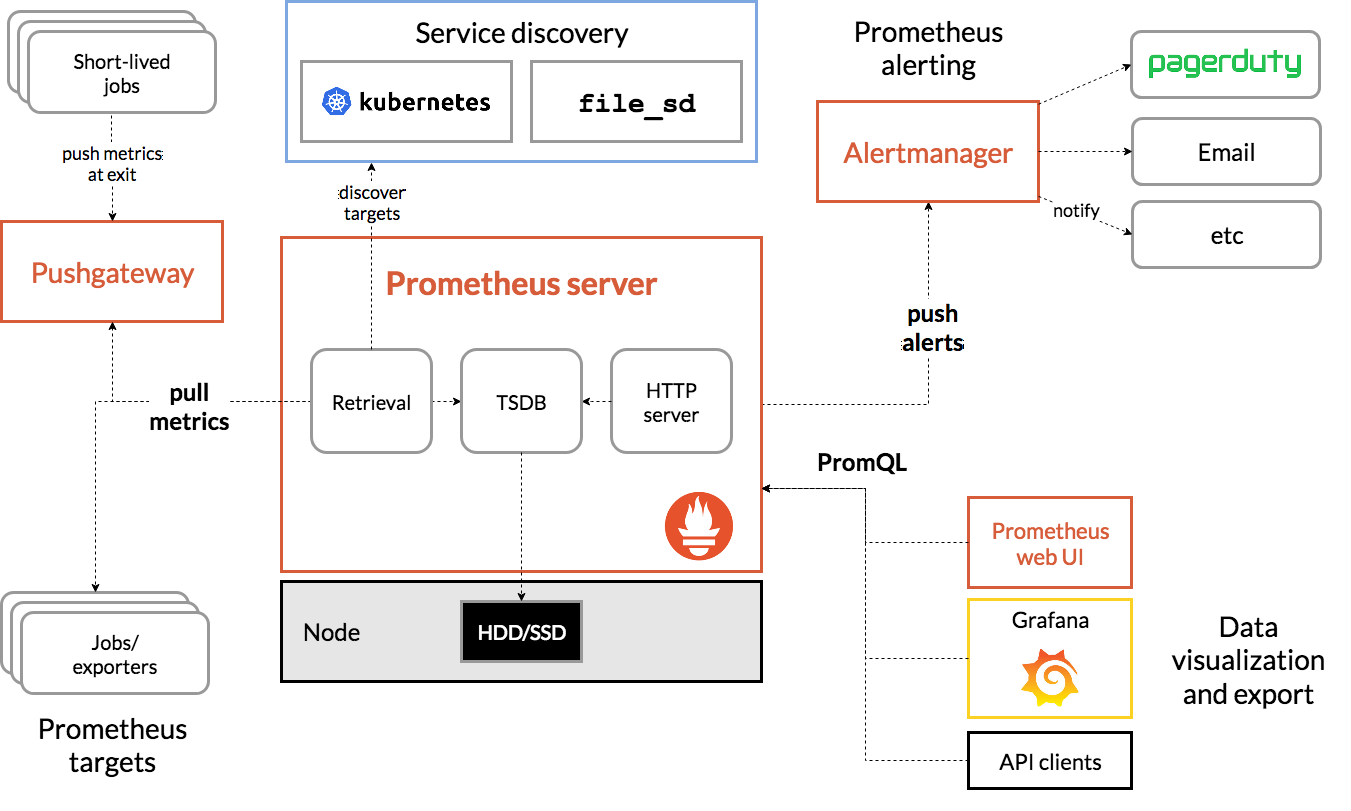
gauge数据类型表示当前的值,是一种所见即所得的情况。
如上图所示,使用"node_boot_time_seconds"指标查看节点的启动时间,表示的是当前值。
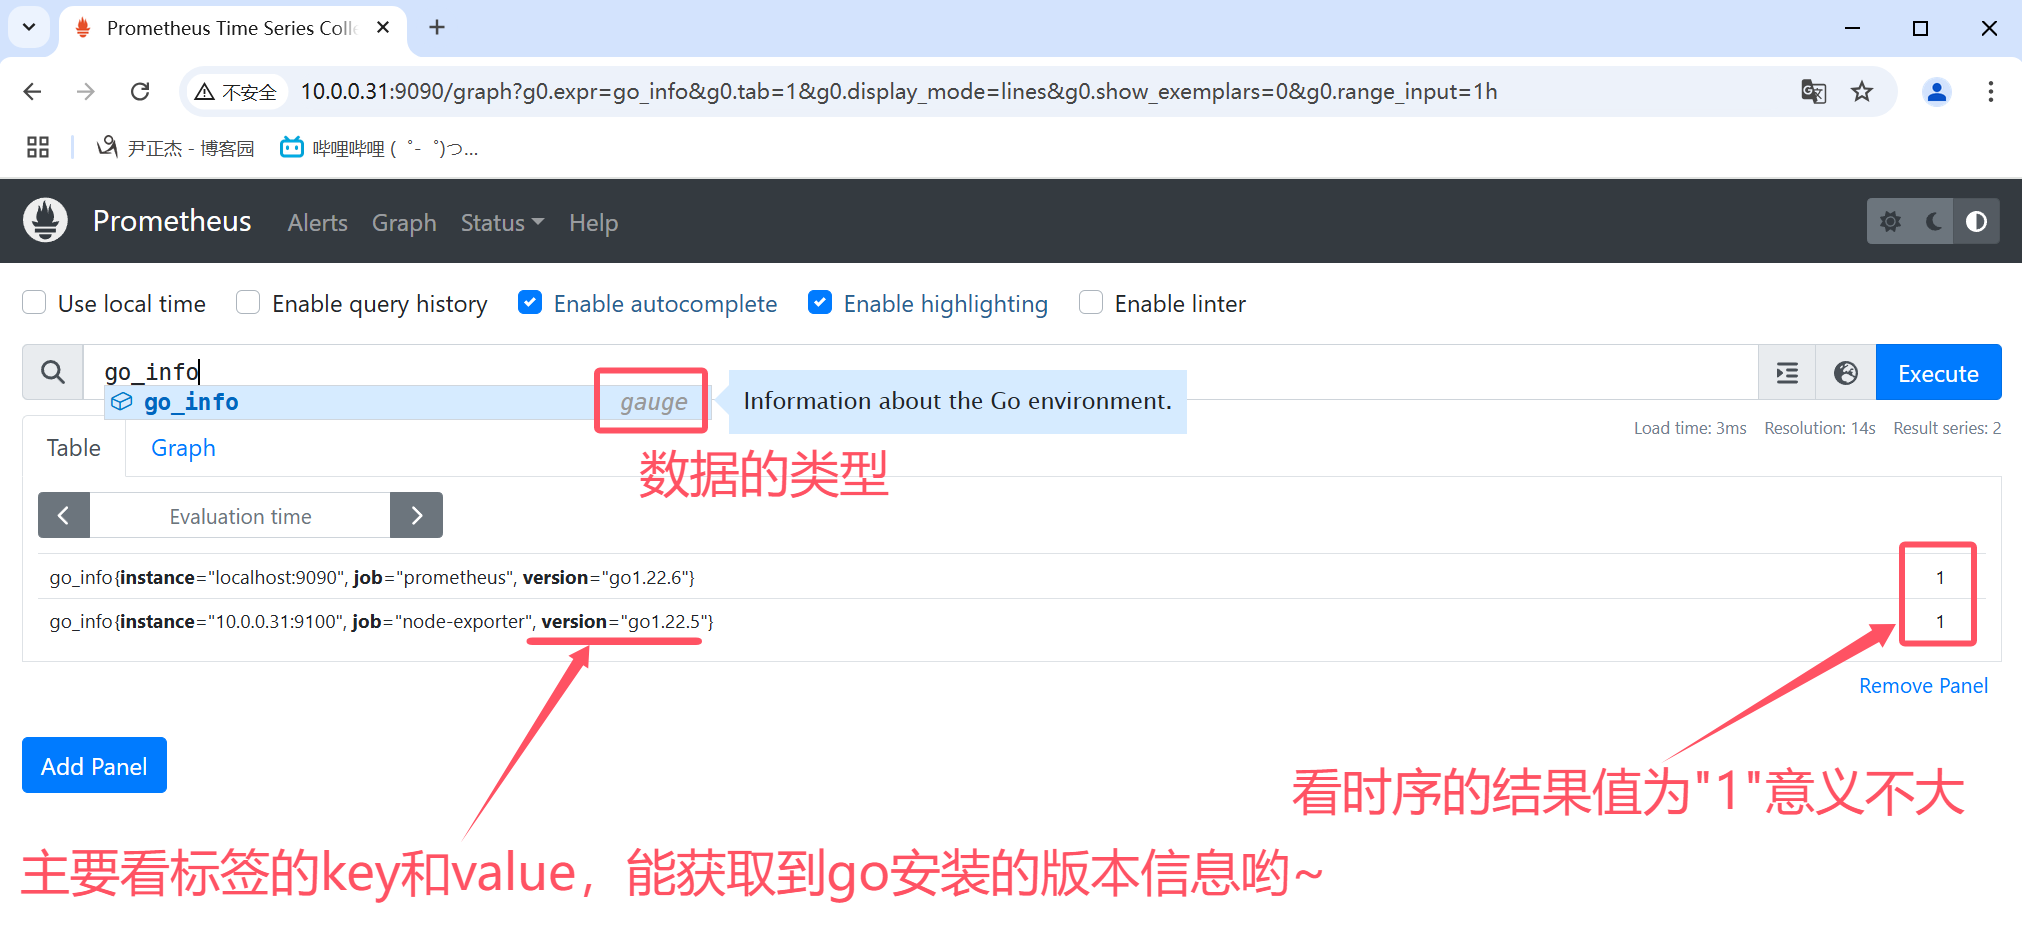
如下图所示,使用"go_info"指标查看go的版本信息,其返回值意义不大,这个时候标签的KEY和VALUE就能获取到我们想要的信息。
4.2 counter
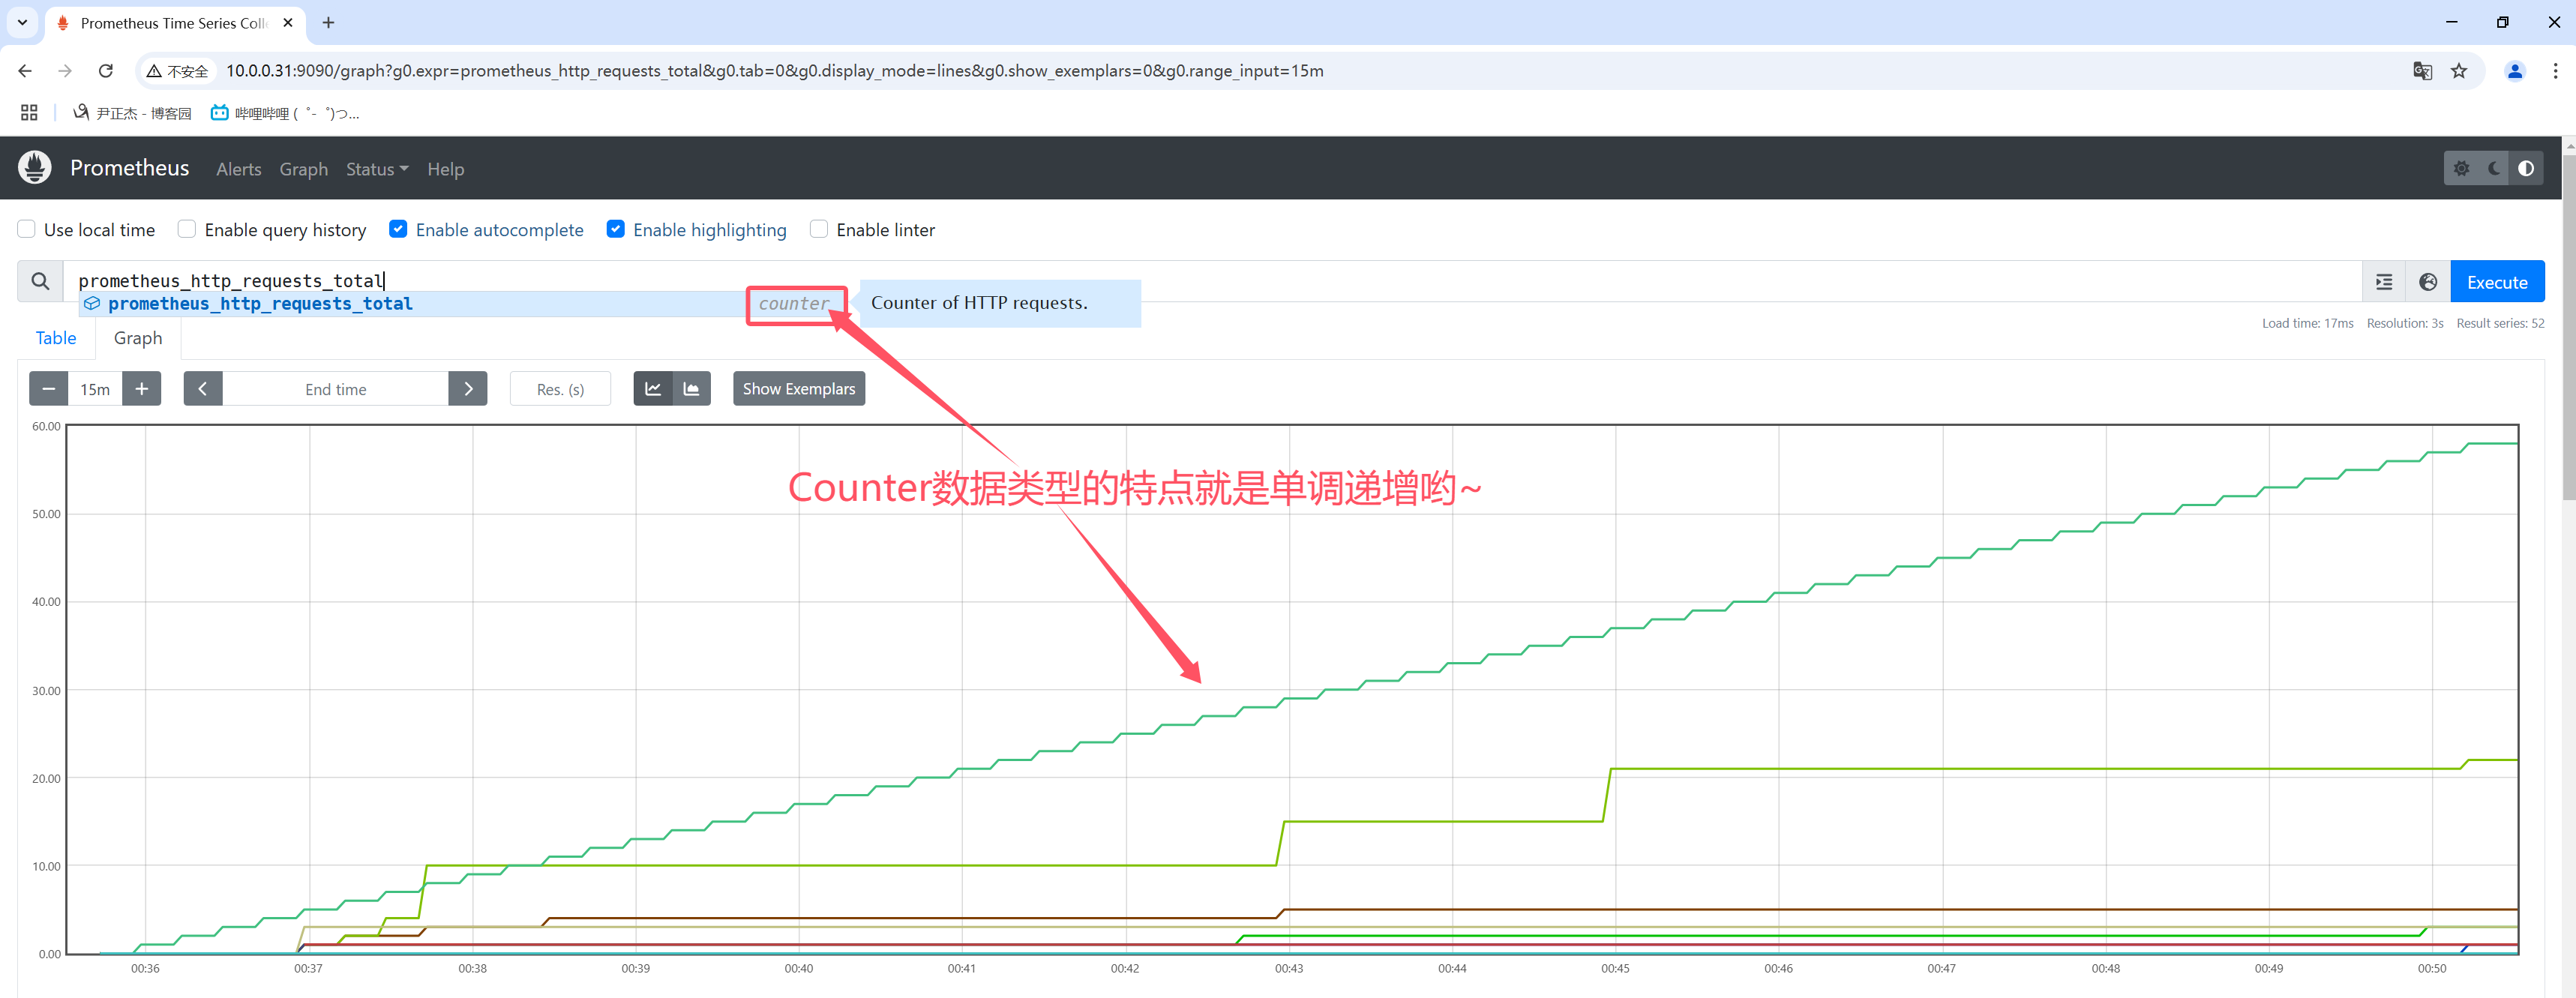
counter数据类型表示一个指标单调递增的计数器。

一般可以结合rate查看QPS,比如: rate(prometheus_http_requests_total[1m])

也可以结合increase查看增量,比如: increase(prometheus_http_requests_total[1m])

查询平均访问时间:
	prometheus_http_request_duration_seconds_sum / prometheus_http_request_duration_seconds_count
4.3 histogram
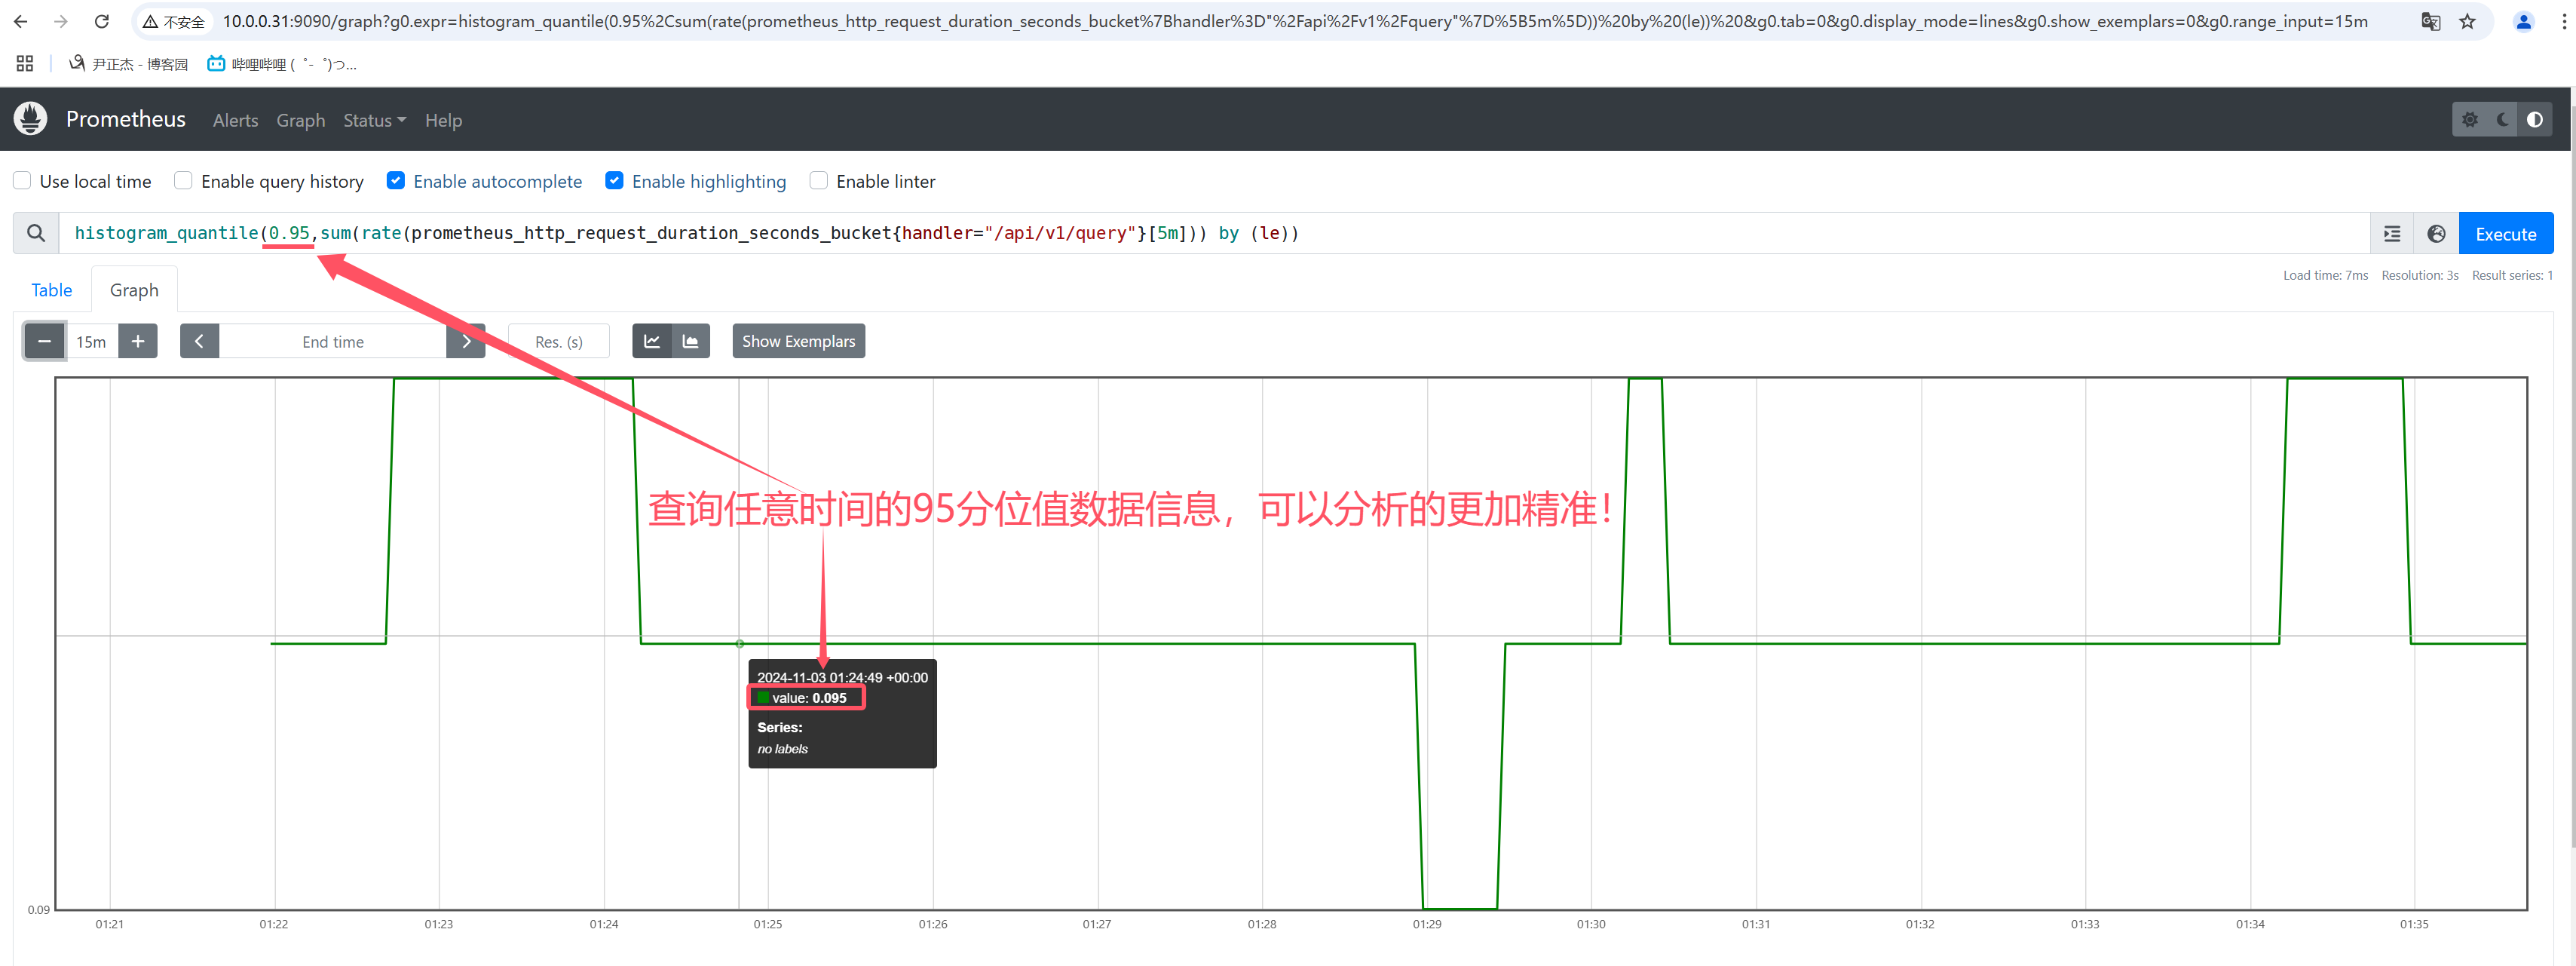
histogram数据类型表示直方图样本观测,通常用于查询"所有观察值的总和","请求持续时间","响应时间"等场景。


上一个案例中,我们可以使用"prometheus_http_request_duration_seconds_sum / prometheus_http_request_duration_seconds_count"查询平均访问时间。

但这种统计方式比较粗糙,用"请求的响应时间/请求的次数",算的是平均响应时间,并不能反应在某个时间段内是否有故障,比如在"12:30~12:35"之间出现大面积服务无法响应,其他时间段都是正常提供服务的,最终使用上面的公式算出来的是没有延迟的,因为5分钟的微小延迟在24小时内平均下来的话可能就可以忽略了,从而运维人员就无法及时发现问题并处理,这对于用户体验是比较差的。

因此Prometheus可以使用histogram数据类型可以采用分位值的方式随机采样短时间范围内的数据,从而及时发现问题,这需要配合histogram_quantile函数来使用。

举个例子: HTTP请求的延迟柱状图(下面的"0.95"表示的是分位值,你可以根据需求自行修改即可。)
histogram_quantile(0.95,sum(rate(prometheus_http_request_duration_seconds_bucket[1m])) by (le))

histogram_quantile(0.95,sum(rate(prometheus_http_request_duration_seconds_bucket{handler="/api/v1/query"}[5m])) by (le))

输出格式请参考:
    https://www.cnblogs.com/yinzhengjie/p/18522782#二-histogram数据说明
4.4 summary
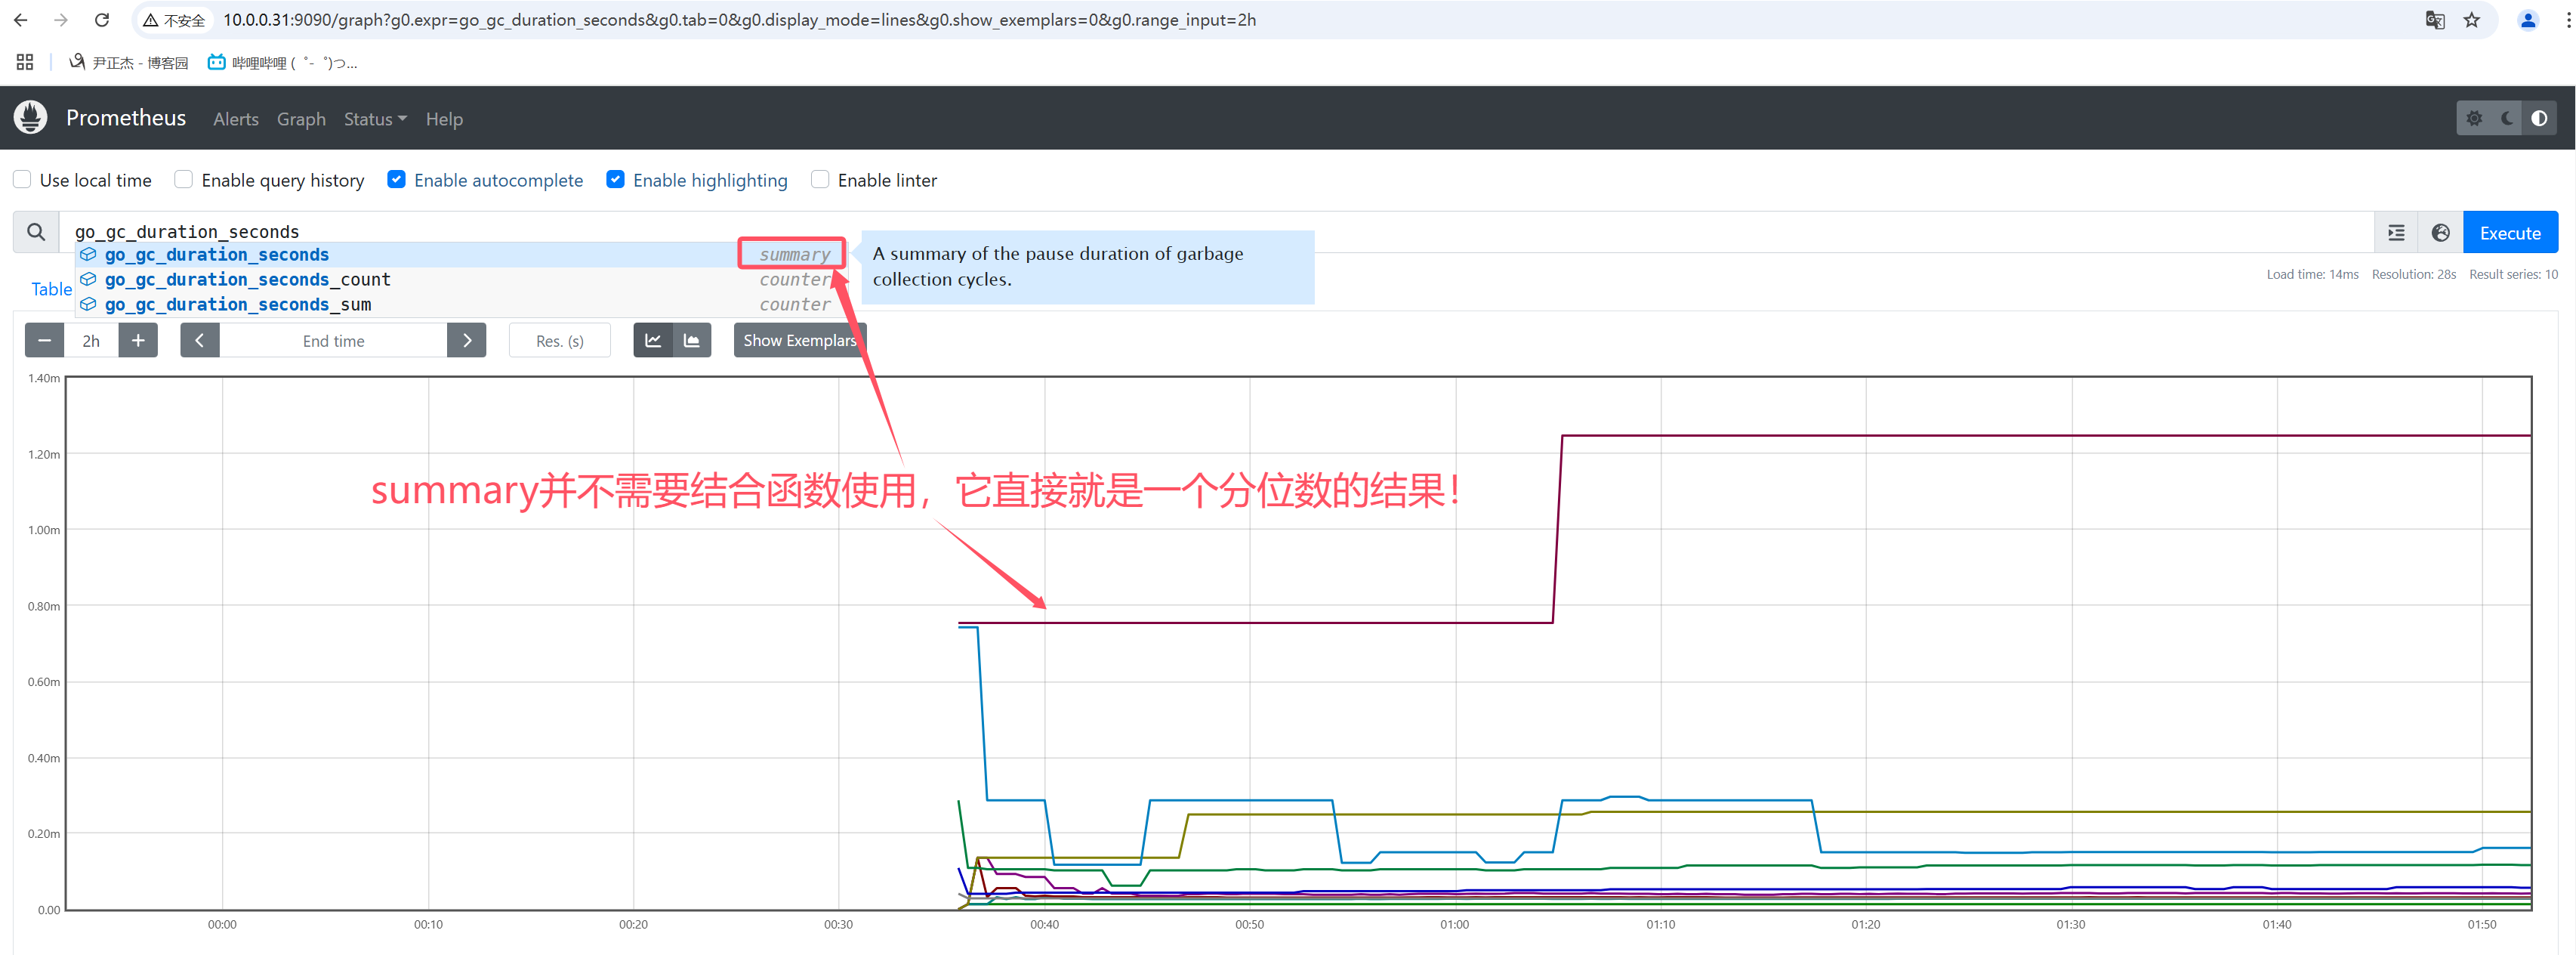
相比于histogram需要结合histogram_quantile函数进行实时计算结果,summary数据类型的数据是分值值的一个结果。


输出格式请参考:
    https://www.cnblogs.com/yinzhengjie/p/18522782#三-summary数据说明
5.范围向量选择器(Range Vector Selectors)
5.1 范围向量元素时间单位
范围矢量的工作方式与即时矢量一样,不同之处在于它们从当前即时中选择了一定范围的样本。语法上,将持续时间附加在"[]"向量选择器末尾的方括号"()"中,以指定应为每个结果范围向量元素提取多远的时间值。
常见的范围向量元素时间单位:
- 毫秒 : ms
- 秒 : s
- 分钟 : m
- 小时 : h
- 天 : d
- 周 : w
- 年 : y
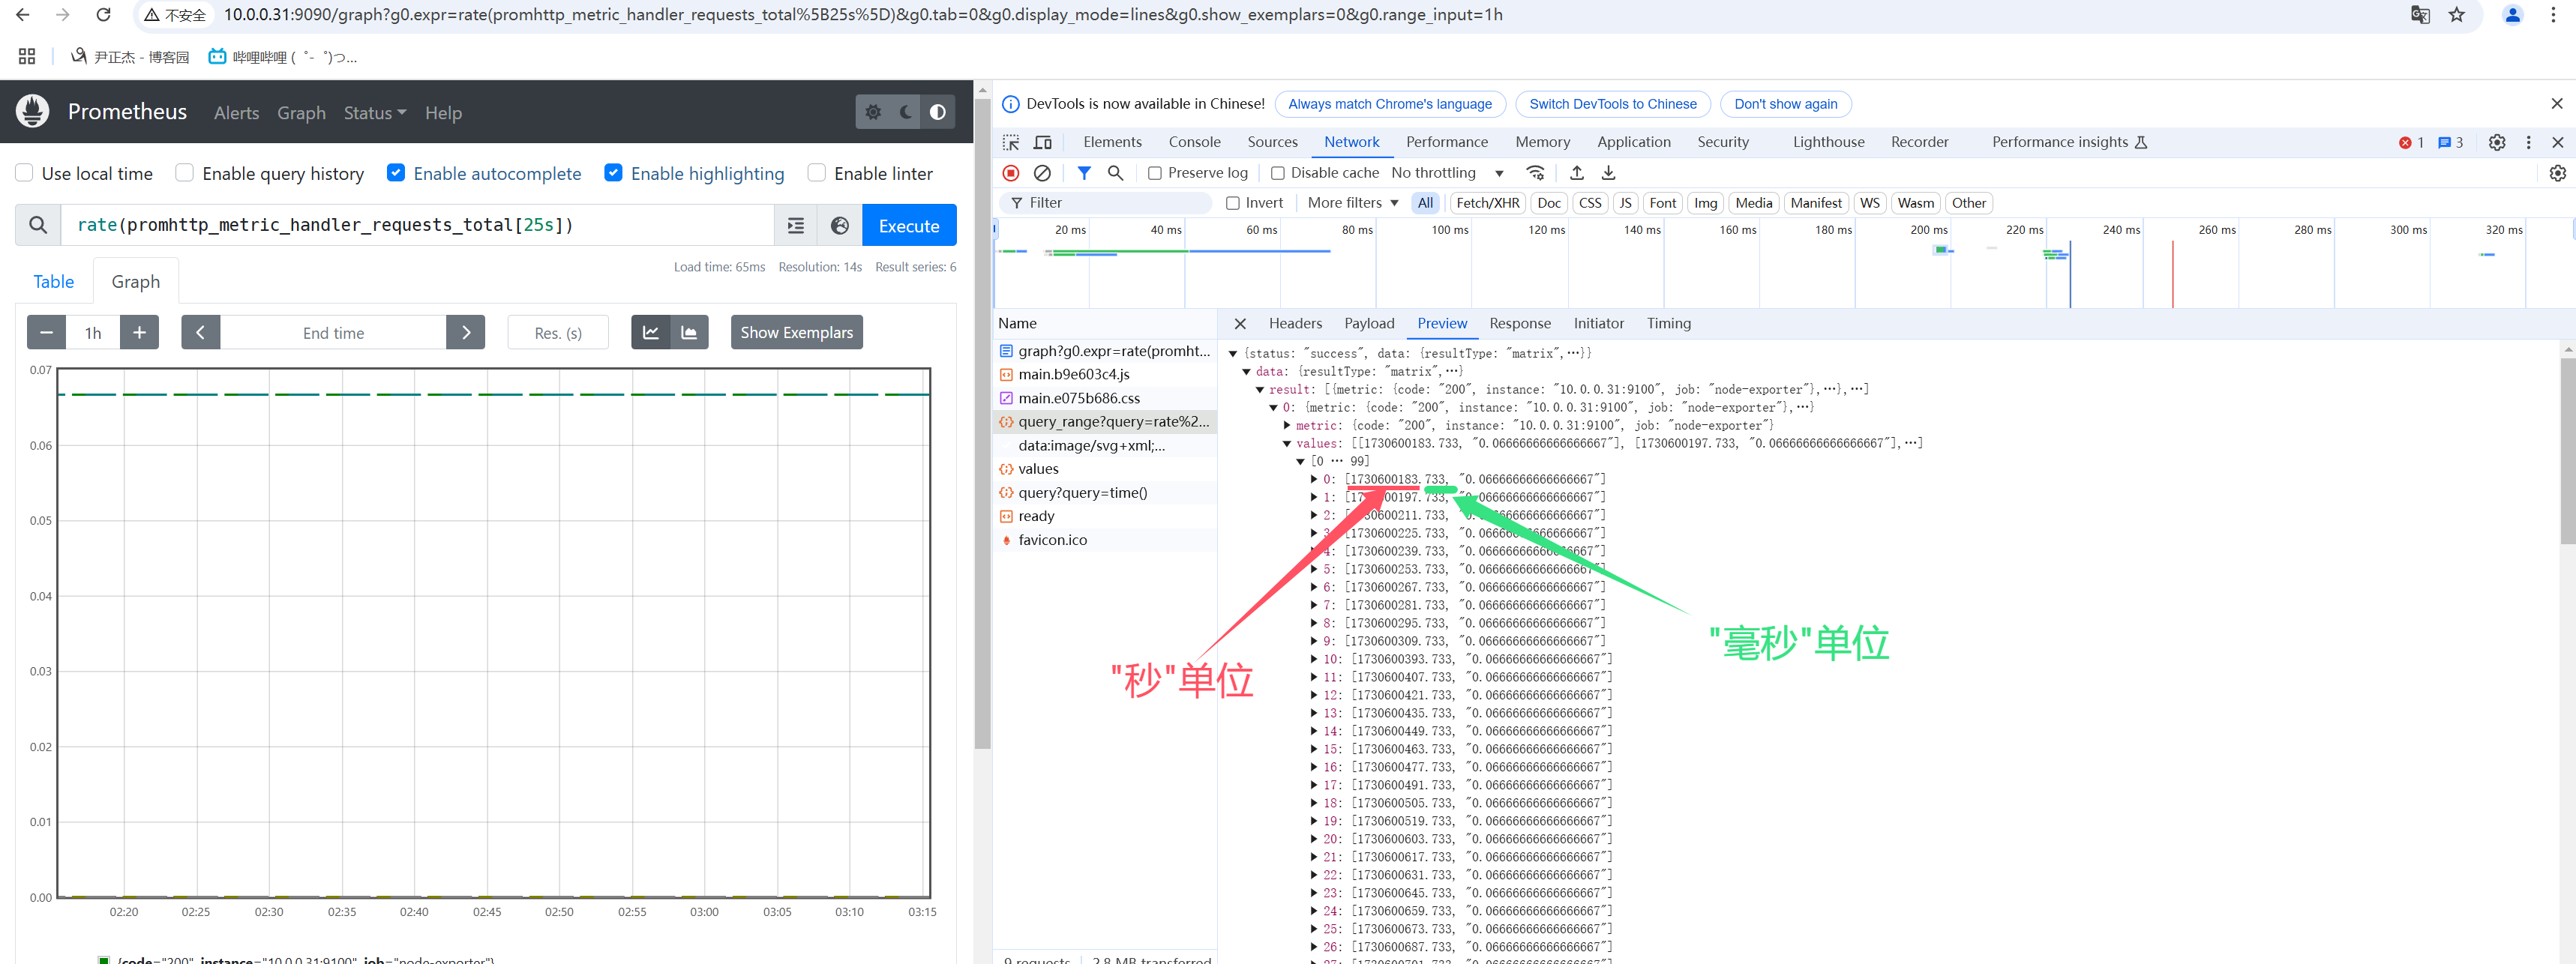
如上图所示,Prometheus返回的都是毫秒时间戳
- 10位代表"秒时间戳"
- 13位代表"毫秒时间戳"(毫秒时间戳代表着数据采集的更加精确)
5.2 时间范围使用注意事项
- 时间范围向量选择器只能作用在Counter类型上;

- 时间范围一般搭配非聚合函数,如: rate,irate,delta,idelta,sum等;
	例如:计算网卡流量
		rate(promhttp_metric_handler_requests_total[1m])

- 时间范围,不能低于采集间隔,否则查不到数据
	例如: 采集时间是"scrape_interval: 15s"采集一次, 则5s内的数据查不到
		rate(promhttp_metric_handler_requests_total[5s])
三.PromQL快速入门
1.使用without去掉保留label
去掉标签:
	sum without(code) (rate(prometheus_http_requests_total[10m]))
	sum without(code,handler) (rate(prometheus_http_requests_total[10m]))

保留标签:
	sum by(code) (rate(prometheus_http_requests_total[10m]))
2.前后top查看
查看最前面的5个排名数据:
	topk(5,prometheus_http_response_size_bytes_bucket)


查看最后面的3个排名数据:
	bottomk(3,prometheus_http_response_size_bytes_bucket)
3.offset查看数据偏移量
- 查看5分钟内的QPS总量:
	sum(rate(prometheus_http_requests_total[5m]))


- 查看2小时前,5分钟内的QPS总量:
	sum(rate(prometheus_http_requests_total[5m] offset 2h))


- 查看最近2小时内数据的增量:
	sum(rate(prometheus_http_requests_total[5m]))  - sum(rate(prometheus_http_requests_total[5m] offset 2h))
4.absent报警
absent的返回值为1时表示查询的数据为空,此时absent返回空,则说明查询到了数据。

一般使用absent来判断是否需要触发报警功能。

举个例子:
	- absent(yinzhengjie)
		返回值为1,表示查询的结果为空,就会触发报警。

	- absent(sum(rate(prometheus_http_requests_total[5m])))
		返回值如果为空,则说明查询到数据,因此不会触发报警。
5.分位值展示
histogram_quantile可以查看分位置。

比如查看9999的分位置:
	histogram_quantile(0.9999,sum(rate(prometheus_http_request_duration_seconds_bucket[5m])) by (le))
6.series关联
多组series时可以相互关联计算的。

举个例子: 计算Prometheus网站访问成功率的百分比:
	100 * (sum(prometheus_http_requests_total{code=~"2.*|3.*"}) / sum(prometheus_http_requests_total) )
7.prometheus的百分比
- 统计一小时内Prometheus网站访问的时间总和:
	sum_over_time(prometheus_http_requests_total[1h])
8.推荐阅读
https://prometheus.io/docs/prometheus/latest/querying/functions/
本文来自博客园,作者:尹正杰,转载请注明原文链接:https://www.cnblogs.com/yinzhengjie/p/18419616,个人微信: "JasonYin2020"(添加时请备注来源及意图备注,有偿付费)
当你的才华还撑不起你的野心的时候,你就应该静下心来学习。当你的能力还驾驭不了你的目标的时候,你就应该沉下心来历练。问问自己,想要怎样的人生。
标签:
Prometheus


【推荐】国内首个AI IDE,深度理解中文开发场景,立即下载体验Trae
【推荐】编程新体验,更懂你的AI,立即体验豆包MarsCode编程助手
【推荐】抖音旗下AI助手豆包,你的智能百科全书,全免费不限次数
【推荐】轻量又高性能的 SSH 工具 IShell:AI 加持,快人一步
· winform 绘制太阳,地球,月球 运作规律
· 震惊!C++程序真的从main开始吗?99%的程序员都答错了
· 【硬核科普】Trae如何「偷看」你的代码?零基础破解AI编程运行原理
· 超详细:普通电脑也行Windows部署deepseek R1训练数据并当服务器共享给他人
· 上周热点回顾(3.3-3.9)
2020-09-19 Python软件包管理工具pip实战篇