
Debug Your ASP.NET Application that Hosted on IIS
- Overview
- ASP.NET Debugging VS IIS Debugging
- What is Worker Process?
- Application Pool
- How to start?
- Which Process to attach?
- How to Attach a Particular worker process when multiple is running.
- Summary
Overview
Generally we debug our Asp.Net web application from Visual Studio. Visual Studio having it own ASP.Net engine which is capable enough to run and debug your web sites inside visual studio. But If your site is hosted on IIS and you want to debug that site, how will you debug it? When we hosted sites on IIS, worker process(w3wp.exe) is used to run the web application. We need to attach the particular process in Visual Studio to debug the application. This article describes the overall idea of debugging an application with process attached. It also describe about worker process, application pool and selecting particular process if there are multiple worker process running on IIS using iisapp.vbs . Hope you will enjoy this article and provide your valuable suggestion and feedback.
ASP.NET Debugging VS IIS Debugging
Visual studio is having its own integrated debugging engine which debugs our code when we run the application from Visual Studio. If we are developing a sites and need to debug the code, we just set the Breakpoints and do the debugging. [Note : In this article I am not describing how to set the debug mode]. When we run the application, code breaks when certain break point comes in. It is very simple because when a ASP.NET application is running from the Visual studio it is under control of the Asp.Net Engine which is integrated with Visual Studio. If you want to check which process is running for debugging, run the web application from Visual Studio, you will get a popup notification like below
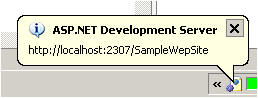
Fig: Showing Popup when debugging is start from Visual Studio
which indicates a process is starting for run the ASP.NET application . Double Click on the Icon. A popup window will come and will show the details.
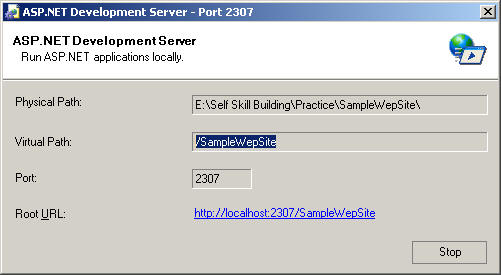
Fig: Development Server Process Details
and behind the running process is "WebDev.WebServer.Exe" . When We Press F5 to run, this process starts to execute the Asp.Net Application. if you want run the application from command prompt you have to perform the following steps.
Steps :
- Open The Visual Studio Command Prompt
- Run
Webdev.WebServer
Following screen will come. Check out the Example Section.
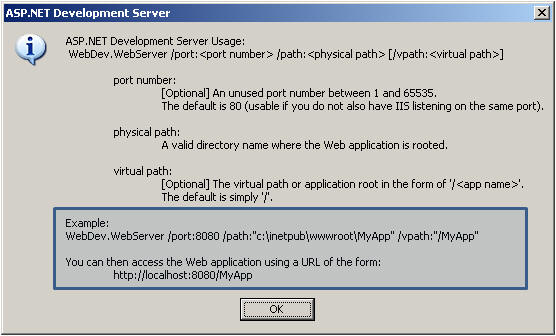
Fig : Webdev.WebServer
Now back to the IIS Debugging. IIS comes into the picture when we deployed or Host the Site. After deploying the sites on IIS if we want to debug the site from, we can't do it directly as in Visual studio. IIS having its own worker process who takes care of all the execution and maintenance of deployed web application. I have described the details of worker process in later section. So if we have running process in IIS and we need to the application, first of all we have to attach the correct process in Visual Studio. Before going to check that how to attach process just have a look on worker process and Application Pool.
What is Worker Process?
Worker Process (w3wp.exe) runs the ASP.Net application in IIS. All the ASP.Net functionality runs under the scope of worker process. When a request comes to the server from a client worker process is responsible to generates the request and response. Its also maintain the InProc session data. If we recycle the worker process we will lost the state of worker process. For more information read this article A low-level Look at the ASP.NET Architecture
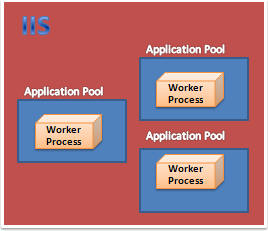
Application Pool:
This is one of the most important thing that you should create for your own application in Production environment. Application pools used to separate sets of IIS worker processes that share the same configuration. Application pools enable us to isolate our web application for better security, reliability, and availability. The worker process serves as the process boundary that separates each application pool so that when one worker process or application is having an issue or recycles, other applications or worker processes are not affected.
Default Application Pool
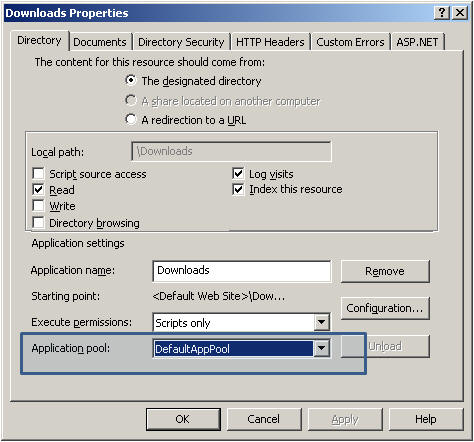
Name of the default application of IIS 6.0 is "DefaultAppPool" . After hosting the site on IIS, if we check the properties of Virtual directory we can able to view that.
Start-Run-Inetmgr- Expand the "
DefaultWebSites" or Other Web Sites, where you have created the Virtual Directory - Right Click on the
Virtual Directory - Click on
Properties
Following screen will come, Now virtual Directory properties showing the application pool name which is assigned to the selected site.
If you want to check all the list of application pool IIS have to expand the Application Pool Node on IIS Server.
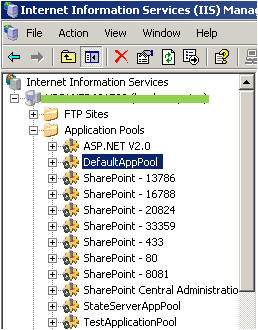
Fig: Default Application Pool
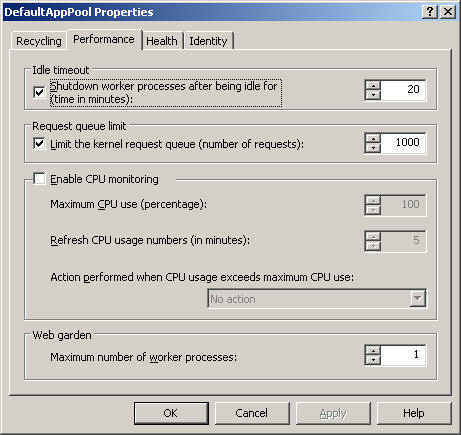
Now, each and every Application pool should have minimum one worker process which takes care of the operation of the site which is associated with the application pool. Right Click on the Application Pool - Goto performance tab, check at the below of the tab, there is a web garden section. and By default worker process is 1. An application pool containing more than one worker process called Web Garden.
Creating and Assigning Application Pool
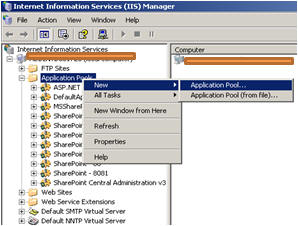
Open IIS Console, Right Click on Application Pool Folder > Create New
Give the Application Pool ID and Click Ok.
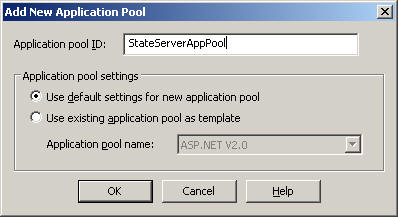
Now, Right Click on the Virtual Directory and assign the newly created application to that Virtual Directory.

So, this Web sites will run independently with StateServerAppPool. So any problem related with other application does not affects your Application. This is the main advantages of creating application pool separately.
How to start?
Till now what ever I have told, that already give you a good idea on worker process and Application Poll. And you should be cleared on thing before start the next part. Now I will show you how to debug a site which is hosted on IIS Server.
I have created one web sites called sampleWebSite and hosted it on to my local IIS. Bellow is default page output.

Fig: Sample web site
Which Process to attach?
Now As I have already discussed the process name is w3wp.exe, so we can check it from our Task Manager that whether the Worker Process is running or not
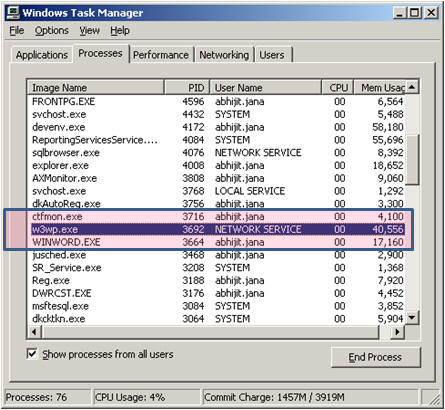
Fig: Task Manager showing the running process
Now we are going to attach the process. Goto Debug > Attach to Process
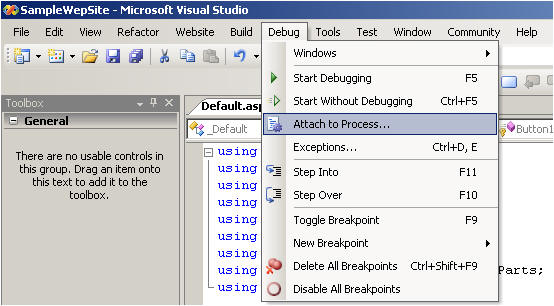
Fig: Open the Process attach window
After click Attach to Process, Following Screen will come,
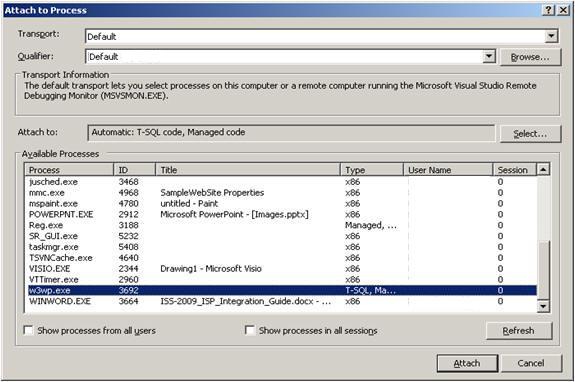
Fig : Single Worker process is running
Now we can able to view that same worker process is running. And we need to Attach that Process. Select the Process and Click on the Attach Button. After the check the below two images,

Fig: 1 ) Process Attached Successfully 2) Process is not attached
Did you noticed the break point symbol? If the Worker process attached successfully with code break point symbol should be clear other wise it should have some warning icon. For a Single worker process the scenario is not common. But when we have multiple worker process running on IIS then we can have some confusion. I will discuss the same in later section.
Now if we click the debug button the web page, code will stop at breakpoint.
Now have a look, If we are having multiple worker process running
How to Attach a Particular worker process when multiple is running ?
Now, when this scenario will come? If we are having the multiple site hosted on IIS and those sites are having there own application pool. Now multiple application pool means multiple worker process is running .
Now I am having 3 Application pool in my IIS and those are,
-
Default Application Pool -
Generic Application Pool -
State Server Application Pool
Now, my SampleWebSite is associated defaultAppPool. and now I want to attach the process for debug my SampleWebSite. Do the same step for open Process Attach windows
Fig: List of Worker Process
Just have a look, there worker process is currently running and you have to attach one of them but you do not know which Worker process is for default Application pool. What you did, you have select any one of them let say ID = 4308 and suppose it is not the worker process for default application pool . So what will happen if you attach a wrong process? Check the below image,
Fig: Process is not attach correctly
Getting List of Running Worker Process
Now what is the solution for that. Here is an quick tips.
-
Start > Run >
Cmd -
Go To Windows >
System32 -
Run
cscript iisapp.vbs
and wait for the ouput. WoW
You will get the list of Running Worker Process , PID and the Application Pool Name.
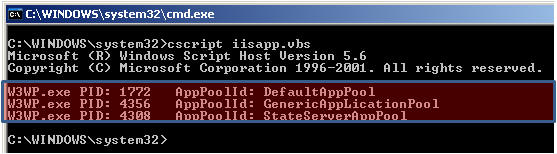
Fig: List of running worker process with PID and Application Pool Name
Attach Correct Process
From here you can easily identify the application pool name and there process Id. Now again back to VS > Attach Process . Now you know the process Id for Default application pool is 1772, So Attach the process.

Fig: Attach the process for debug
Now, enjoy the debugging
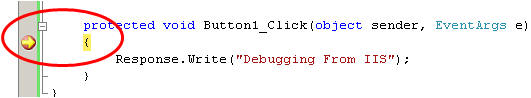
Fig: Break point is ready
Some times we need to debug our application which is hosted on IIS, for that we need to attach the running worker process with the Visual Studio code. If we have multiple worker process running on IIS server we can identify the proper worker process by using cscript iisapp.vbs command. Hope this will help the beginners who are struggling with debugging the application that are hosted on IIS. Please give your feedback and suggestions to improve the article. Thank you.

 浙公网安备 33010602011771号