ELK安装使用
安装版本
elasticsearch 2.4.6
logstash2.4.0
kibana4.6.1
一、elasticsearch
#启动前先关闭防火墙
systemctl stop firewalld
tar -xvf elasticsearch-2.4.6.tar.gz
#由于安全原因,es不能用root用户安装,所以创建一个用户(直接使用useradd es也可以,无需设置密码)
adduser es
passwd es
chown -R es elasticsearch-2.4.6/
su es
cd elasticsearch-2.4.6/config
mv elasticsearch.yml elasticsearch.yml.bak
vim elasticsearch.yml #配置文件在下面
./bin/elasticsearch -d #-d表示后台启动
./bin/plugin install mobz/elasticsearch-head -Dhttps.protocols=TLSv1.2 #安装head插件
验证是否安装成功
http://192.168.0.201:9200
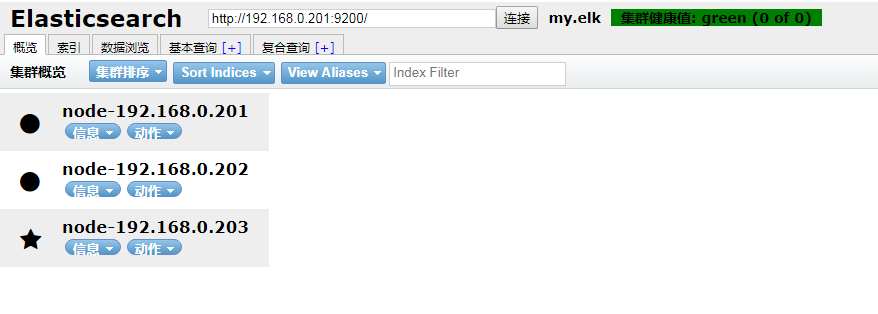
head图形界面:http://192.168.0.201:9200/_plugin/head/
es配置文件
cluster.name: my.elk	#集群名称,如果有多个集群,那么每个集群名就得是唯一的
node.name: node-192.168.0.201		#节点名称
node.master: true		#该节点是否可以是master,true表示是的,false表示否,默认是true,表示可以参与master选举
node.data: true			#该节点是否存储数据,默认true表示是的
http.port: 9200			#http访问端口,默认是9200,通过这个端口,调用方可以索引查询请求
transport.tcp.port: 9300	#节点之间通信的端口,默认为9300
network.host: 0.0.0.0		#访问地址 配置外网访问
discovery.zen.ping.unicast.hosts: ["192.168.0.201:9300","192.168.0.202:9300","192.168.0.203:9300"]
#node.max_local_storage_nodes: 2		#设置一台机子能运行的节点数目,一般采用默认的1即可,因为我们一般也只在一台机子上部署一个节点
http.cors.enabled: true
http.cors.allow-origin: "*"
可能遇到的警告报错
max file descriptors [4096] for elasticsearch process likely too low, consider increasing to at least [65536]
su root
vim /etc/security/limits.conf
#在最后添加下面2行
es hard nofile 65536
es soft nofile 65536

max virtual memory areas vm.max_map_count [65530] is too low, increase to at least [262144]
vim /etc/sysctl.conf
vm.max_map_count=655360
sysctl -p
二、logstash
tar -xvf logstash-2.4.0.tar.gz
#创建配置文件
mkdir config
cd config
#配置内容在下面
vim logstash.conf
bin/logstash -f config/logstash.conf
#后台启动:nohup bin/logstash -f config/logstash.conf > logstash.log &
有多个不同的目录或者日志文件格式不同
指定启动目录,然后启动目录下配置多个*.conf文件。里面指定不同的logpath
bin/logstash -f config
logstash配置文件
input 	{																//收集标志
        file {
                type => "log"
                path => ["/data/project/logs/*/*.log"]					//收集日志的地方,注意不能远程收取
                start_position => "end"									//如果log文件已经很大了 不要配start,第二次会有记录
				ignore_older => 0										//忽略最后修改时间是大于多少s的
				codec=> multiline {										//重点注意 解决日志换行问题
                        pattern => "%{TIMESTAMP_ISO8601}"               //每条日志的匹配规则
                        negate => true
                        what => "previous"
                }
        }
        beats {
            port => 5044                                              	//logstash端口
        }
}
output {
        if [type] == "log" {
		elasticsearch {
			hosts => ["http://192.168.0.201:9200"]
			index => "log-%{+YYYY.MM.dd}"								//表示的是索引库 按日期分
			//user => user												//如果使用nginx对es的head界面进行了权限控制,则需要填写
			//password => pwd
		}
	}
}
json格式日志
input 	{
        file {
                type => "log"
                path => ["/data/project/logs/oper.log"]
                start_position => "end"
				ignore_older => 0
        }
        beats {
            port => 5044
        }
}
filter {
    if [type] == "log" {
        json {
            source => "message"
            target => "doc"
            remove_field => ["message"]
        }
    }
}
output {
        if [type] == "log" {
		elasticsearch {
			hosts => ["http://192.168.200.201:9202","http://192.168.200.201:9203","http://192.168.200.201:9204"]
			index => "log-%{+YYYY.MM.dd}"
		}
	}
}
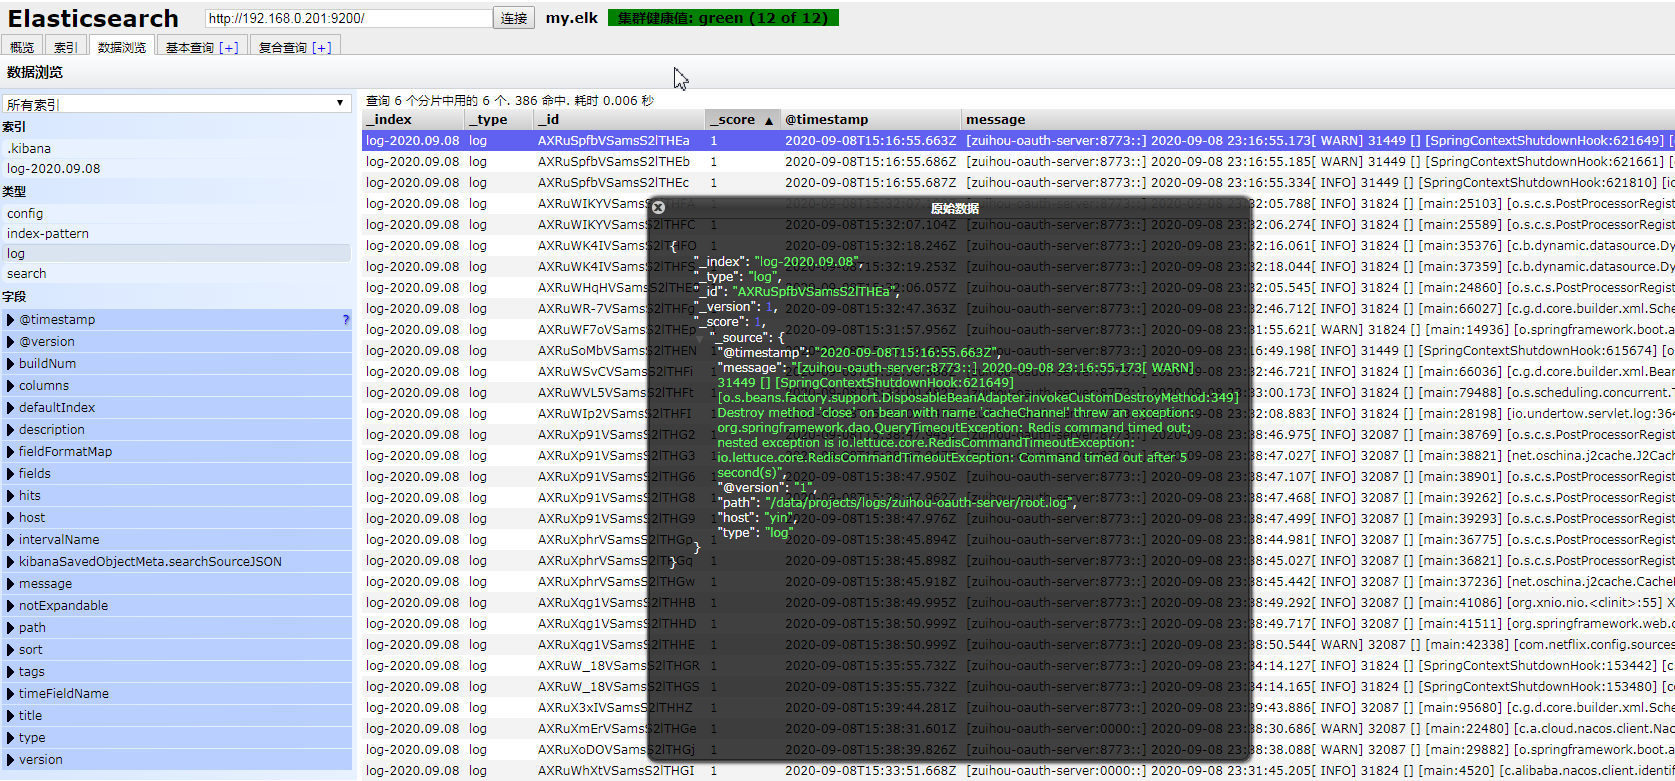
启动应用,从es的head插件查看日志是否正常收集
常用做法是把日志写成一行json格式,供logstash收集
https://blog.csdn.net//jiao_fuyou/article/details/49174269
三、kibana
tar -xvf kibana-4.6.1-linux-x86_64.tar.gz
vim config/kibana.yml
#取消注释并编辑以下2行记录
elasticsearch.url: http://192.168.0.201:9200
server.host: 0.0.0.0
#启动
bin/kibana
#后台启动
nohup bin/kibana &
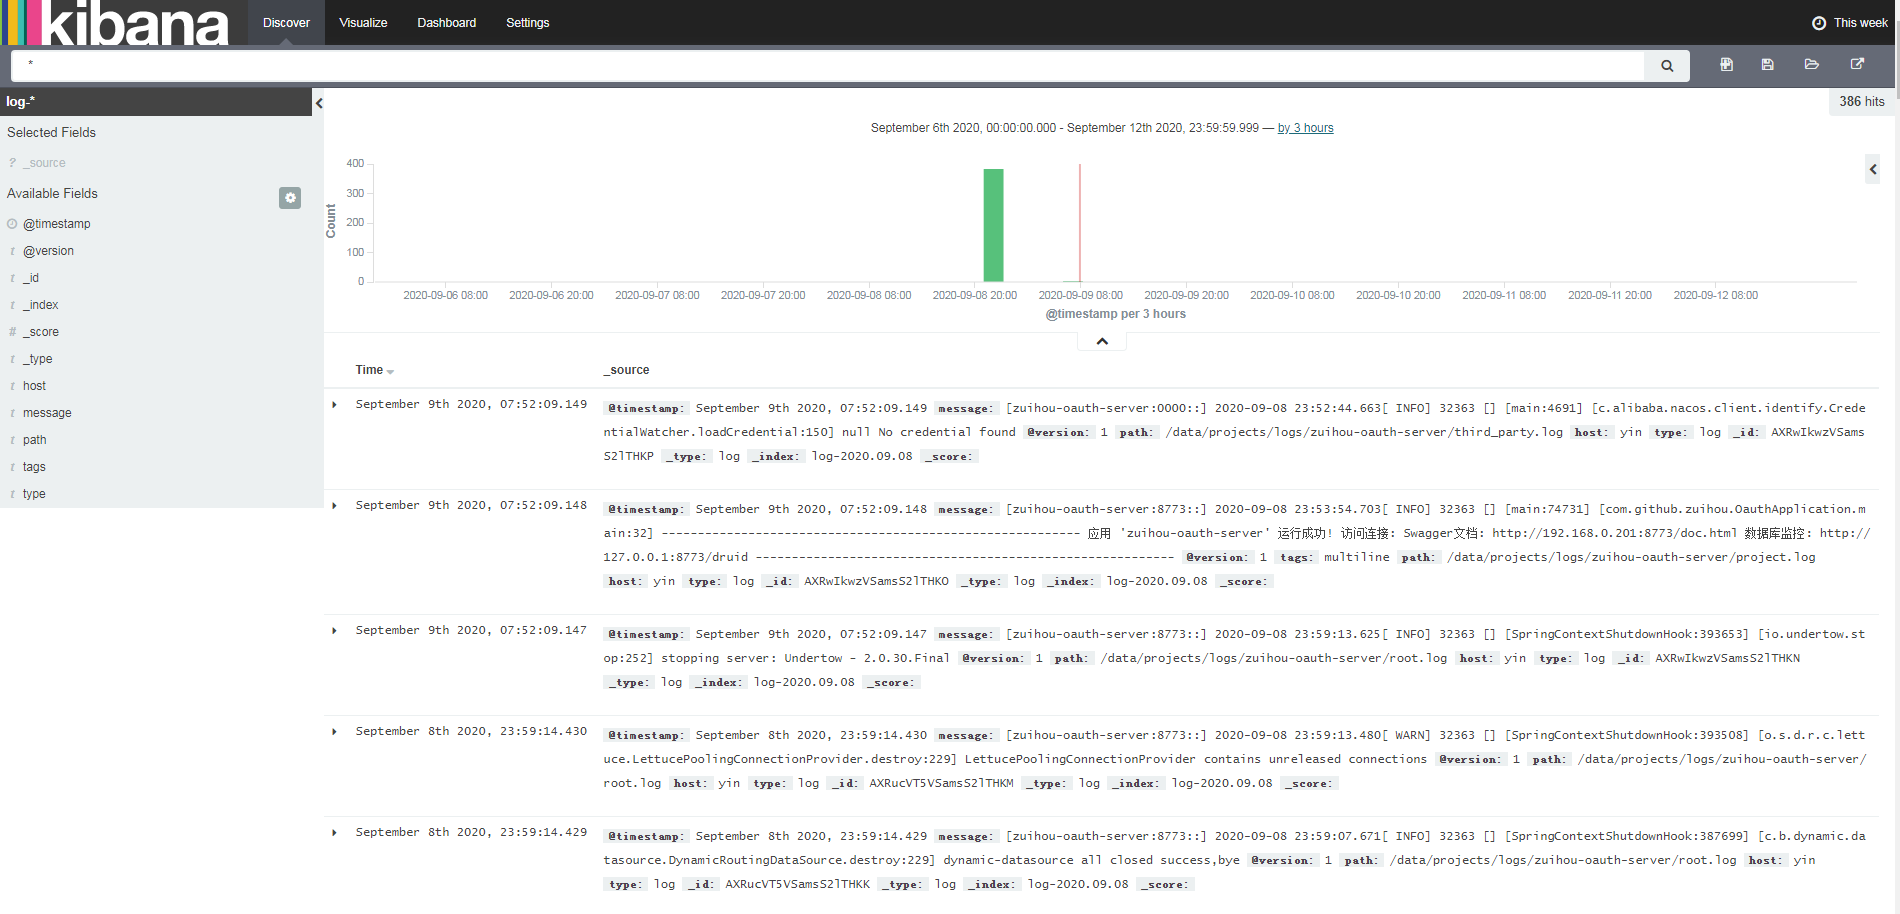
访问kibana:http://192.168.0.201:5601/
架构进阶:logstash elasticsearch kibana =》filebeat kafka logstash elasticsearch ibana

 浙公网安备 33010602011771号