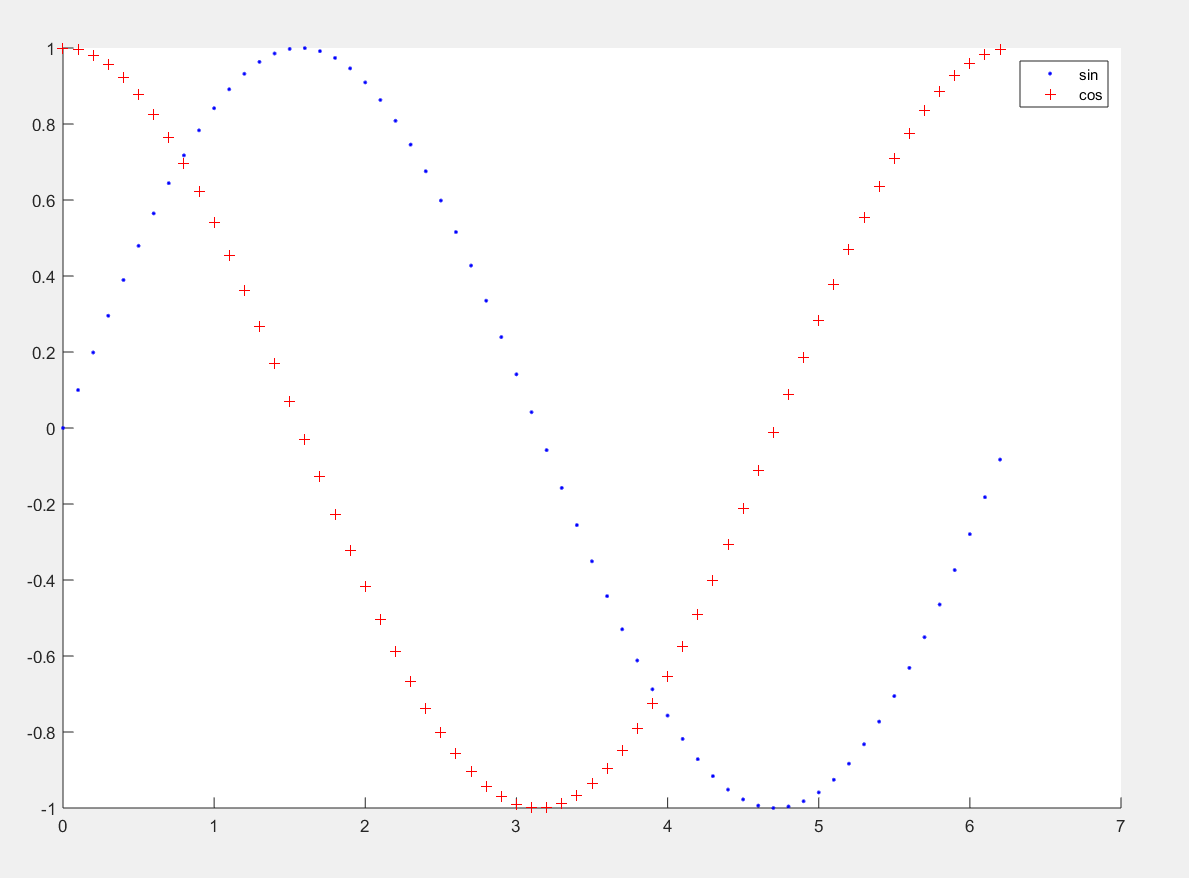
clc;clear;close all;x=0:0.1:2*pi();figure(1);hold on;plot(x,sin(x),'b.',x,cos(x),'r+');legend('sin','cos');%这样可以把"."标识为'sin',把"+"标识为"cos"
感谢分享
你的图片不都是直接搬运B站上小崔老师的吗
俏皮
博主用的是哪个源码呢


【推荐】国内首个AI IDE,深度理解中文开发场景,立即下载体验Trae
【推荐】编程新体验,更懂你的AI,立即体验豆包MarsCode编程助手
【推荐】抖音旗下AI助手豆包,你的智能百科全书,全免费不限次数
【推荐】轻量又高性能的 SSH 工具 IShell:AI 加持,快人一步
· AI与.NET技术实操系列:向量存储与相似性搜索在 .NET 中的实现
· 基于Microsoft.Extensions.AI核心库实现RAG应用
· Linux系列:如何用heaptrack跟踪.NET程序的非托管内存泄露
· 开发者必知的日志记录最佳实践
· SQL Server 2025 AI相关能力初探
· winform 绘制太阳,地球,月球 运作规律
· 震惊!C++程序真的从main开始吗?99%的程序员都答错了
· AI与.NET技术实操系列(五):向量存储与相似性搜索在 .NET 中的实现
· 超详细:普通电脑也行Windows部署deepseek R1训练数据并当服务器共享给他人
· 【硬核科普】Trae如何「偷看」你的代码?零基础破解AI编程运行原理