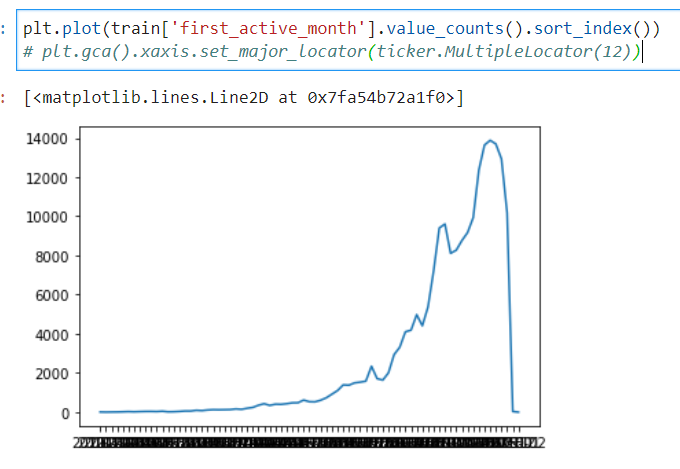
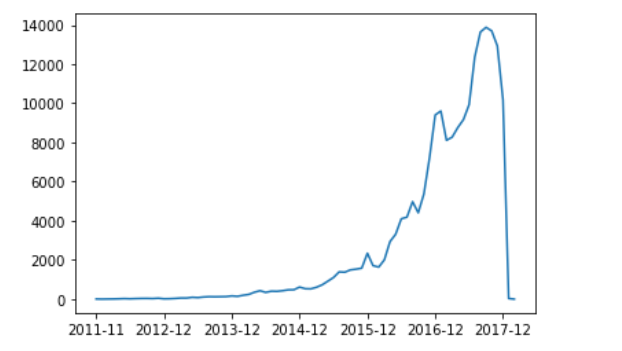
from matplotlib import ticker
plt.plot(train['first_active_month'].value_counts().sort_index())

# 参数为间隔数量
plt.gca().xaxis.set_major_locator(ticker.MultipleLocator(12))