图像分类识别——(2)单张图片的分类识别
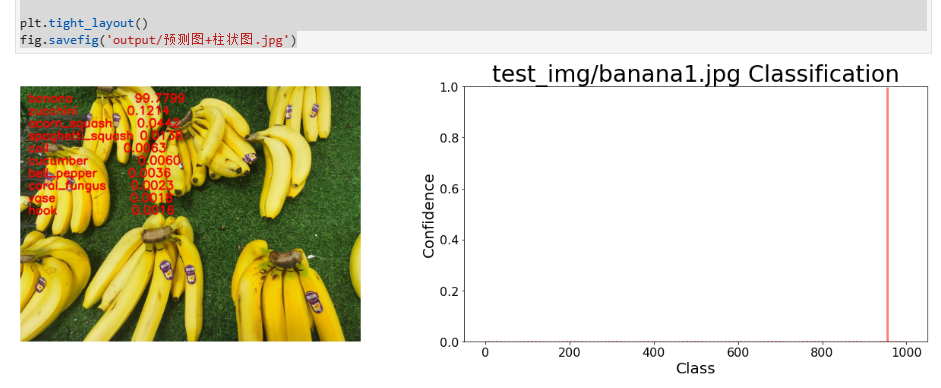
本项目的最终实现效果:
实现步骤如下:
导入基础库
# 导入操作系统库
import os
# 导入opencv库
import cv2
# 导入数据分析处理库
import pandas as pd
import numpy as np
# 导入pytorch
import torch
# 导入数据可视化库用来画图
import matplotlib.pyplot as plt
%matplotlib inline
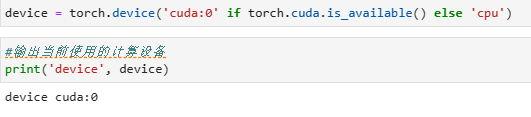
获取计算设备信息
# 获取设备信息,有 GPU 就用 GPU,没有就用 CPU
device = torch.device('cuda:0' if torch.cuda.is_available() else 'cpu')
#输出当前使用的计算设备
print('device', device)
载入预训练模型
from torchvision import models
# 载入预训练图像分类模型
# 这里使用的是最基础的resnet18模型
model = models.resnet18(pretrained=True)
# 也可换成下面更精准的模型,有152层,数字代表层数
# model = models.resnet152(pretrained=True)
# 把模型调整到评估模式
model = model.eval()
# 把模型放到刚才找到的计算设备中
model = model.to(device)
进行图像预处理
from torchvision import transforms
# 测试集图像预处理-RCTN:缩放裁剪、转 Tensor、归一化。为固定的代码模板
# Resize:缩放,把任何一张图像缩放成256*256方框
# CenterCrop 裁剪,把上步缩放的图片裁剪成224的小方框
# ToTensor:转换,把上一步的小方框图像转换成pytroch的张量Tensor
# Normalize:归一化,对图像色彩的三通道进行归一化,减去均值,除以标准差。是公认的固定参数
test_transform = transforms.Compose([transforms.Resize(256),
transforms.CenterCrop(224),
transforms.ToTensor(),
transforms.Normalize(
mean=[0.485, 0.456, 0.406],
std=[0.229, 0.224, 0.225])
])
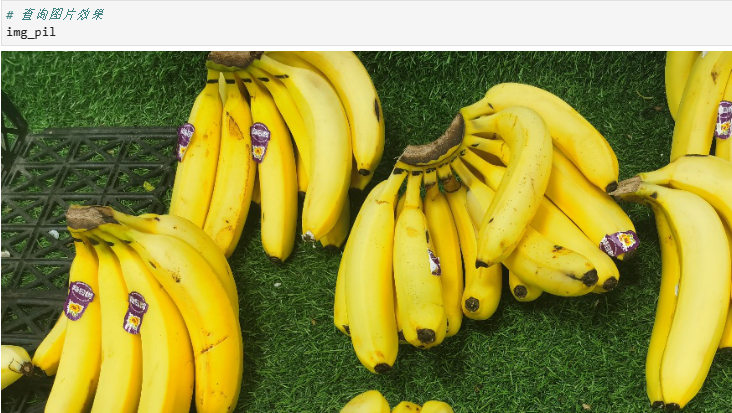
载入一张测试图像
# 从之前准备的图片文件夹 test_img 里选择一张图片加载
img_path = 'test_img/banana1.jpg'
# 用 pillow 图像处理工具载入,pytroch的预处理函数只接受pillow格式的图像
from PIL import Image
# 用Image.open载入图像
img_pil = Image.open(img_path)
# 查询显示图片效果
img_pil
分类预测
# 把img_pil传入给transform图像预处理函数
input_img = test_transform(img_pil) # 预处理
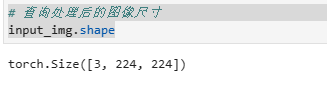
# 查询处理后的图像尺寸
input_img.shape
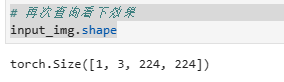
# 用 unsqueeze(0) 函数,给图像增加一个维度,因为pytroch模型输入模型必须整理成这样的维度
input_img = input_img.unsqueeze(0).to(device)
# 再次查询看下效果
input_img.shape
# 执行前向预测,得到所有类别的 logit 预测分数
pred_logits = model(input_img)
pred_logits.shape
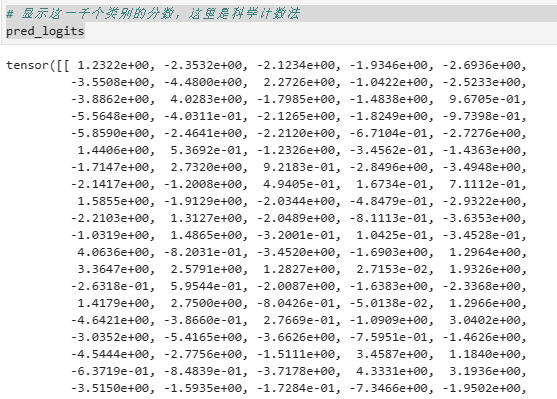
# 显示这一千个类别的分数,这里是科学计数法
pred_logits
import torch.nn.functional as F
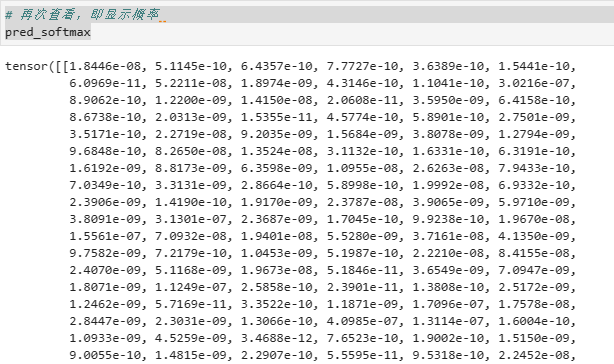
# 对 logit 分数做 softmax 归一化运算,把所有类别的分类转成0到1之间的概率,且所有类别求和为1
pred_softmax = F.softmax(pred_logits, dim=1)
pred_softmax.shape
# 再次查看,即显示概率
pred_softmax
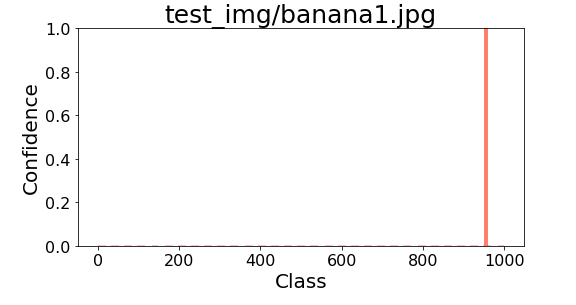
画柱状图展示
# 指定图像大小
plt.figure(figsize=(8,4))
# 横轴是1000个类别
x = range(1000)
# 纵轴是每一个类别的置信度
y = pred_softmax.cpu().detach().numpy()[0]
# 画柱状图
ax = plt.bar(x, y, alpha=0.5, width=0.3, color='yellow', edgecolor='red', lw=3)
# y轴取值范围
plt.ylim([0, 1.0])
# plt.bar_label(ax, fmt='%.2f', fontsize=15) # 置信度数值
# 横轴与纵轴的图像的说明,字体的大小
plt.xlabel('Class', fontsize=20)
plt.ylabel('Confidence', fontsize=20)
# 坐标文字大小
plt.tick_params(labelsize=16)
# 图的标题
plt.title(img_path, fontsize=25)
# 展示图
plt.show()
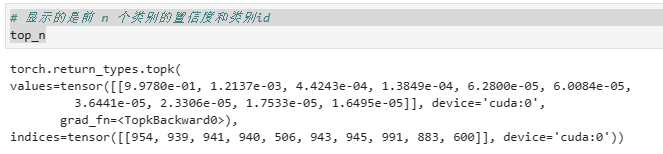
# 设置取置信度最大的 n 个结果
n = 10
top_n = torch.topk(pred_softmax, n)
# 显示的是前 n 个类别的置信度和类别id
top_n
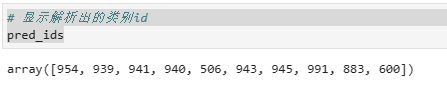
# 解析出类别
pred_ids = top_n[1].cpu().detach().numpy().squeeze()
# 显示解析出的类别id
pred_ids
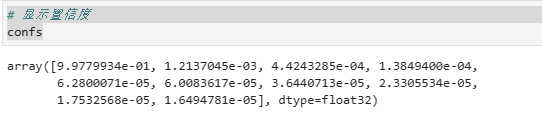
# 解析出置信度,对应每个类别
confs = top_n[0].cpu().detach().numpy().squeeze()
# 显示置信度
confs
# 把1000类别字典的文件读入
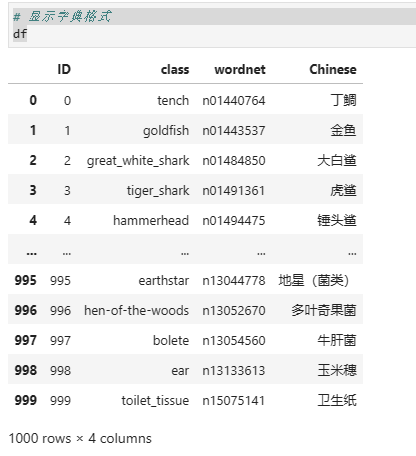
df = pd.read_csv('imagenet_class_index.csv')
# 显示字典格式
df
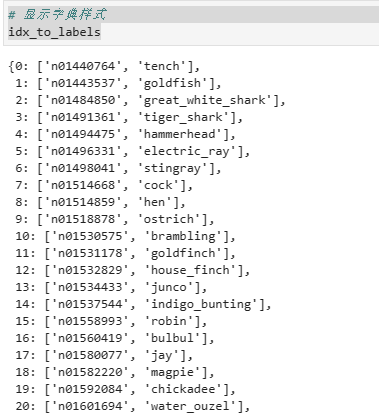
# 把表格信息转成python的字典,键值对形式。
# 如果指定的是文件的class就是英文,chinese列就是中文
idx_to_labels = {}
for idx, row in df.iterrows():
idx_to_labels[row['ID']] = [row['wordnet'], row['class']]
# 显示字典样式
idx_to_labels
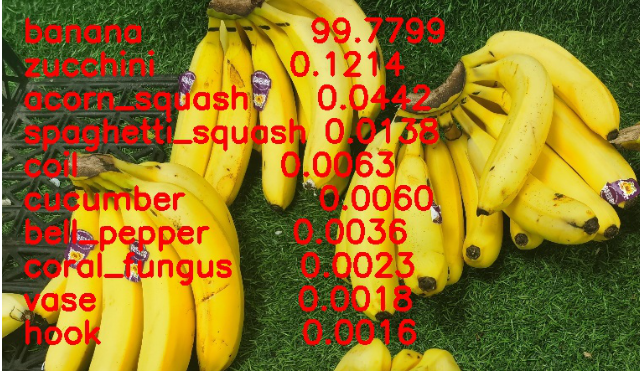
将分类结果写在原图上
# 用 opencv 载入原图
img_bgr = cv2.imread(img_path)
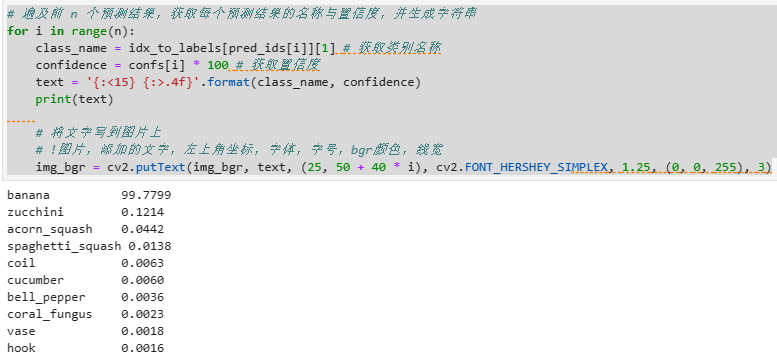
# 遍及前 n 个预测结果,获取每个预测结果的名称与置信度,并生成字符串
for i in range(n):
class_name = idx_to_labels[pred_ids[i]][1] # 获取类别名称
confidence = confs[i] * 100 # 获取置信度
text = '{:<15} {:>.4f}'.format(class_name, confidence)
print(text)
# 将文字写到图片上
# !图片,添加的文字,左上角坐标,字体,字号,bgr颜色,线宽
img_bgr = cv2.putText(img_bgr, text, (25, 50 + 40 * i), cv2.FONT_HERSHEY_SIMPLEX, 1.25, (0, 0, 255), 3)
# 保存图像
cv2.imwrite('output/img_pred.jpg', img_bgr)
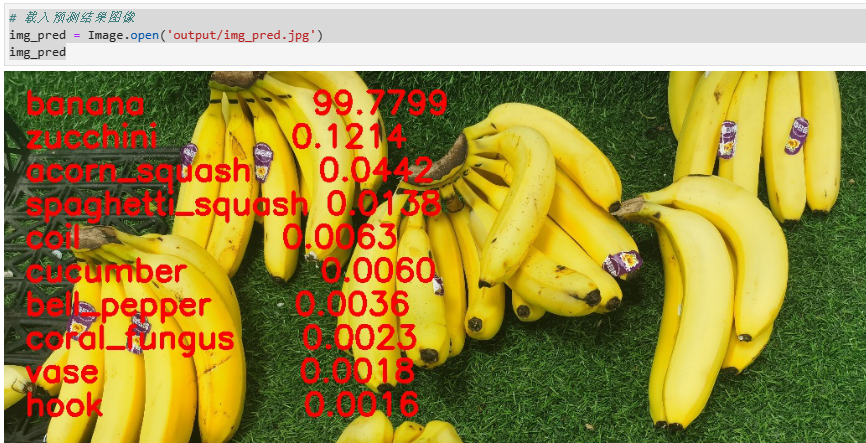
# 载入预测结果图像
img_pred = Image.open('output/img_pred.jpg')
img_pred
到这里简单的图像分类就基本完成了,也可以再进行一些加工。
将图像和柱状图一起显示
fig = plt.figure(figsize=(18,6))
# 绘制左图-预测图
ax1 = plt.subplot(1,2,1)
ax1.imshow(img_pred)
ax1.axis('off')
# 绘制右图-柱状图
ax2 = plt.subplot(1,2,2)
x = df['ID']
y = pred_softmax.cpu().detach().numpy()[0]
ax2.bar(x, y, alpha=0.5, width=0.3, color='yellow', edgecolor='red', lw=3)
plt.ylim([0, 1.0]) # y轴取值范围
plt.title('{} Classification'.format(img_path), fontsize=30)
plt.xlabel('Class', fontsize=20)
plt.ylabel('Confidence', fontsize=20)
ax2.tick_params(labelsize=16) # 坐标文字大小
plt.tight_layout()
fig.savefig('output/预测图+柱状图.jpg')
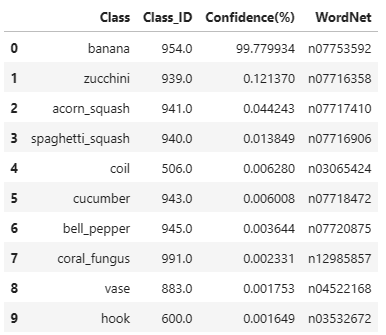
做成表格输出的代码模板
pred_df = pd.DataFrame() # 预测结果表格
for i in range(n):
class_name = idx_to_labels[pred_ids[i]][1] # 获取类别名称
label_idx = int(pred_ids[i]) # 获取类别号
wordnet = idx_to_labels[pred_ids[i]][0] # 获取 WordNet
confidence = confs[i] * 100 # 获取置信度
pred_df = pred_df.append({'Class':class_name, 'Class_ID':label_idx, 'Confidence(%)':confidence, 'WordNet':wordnet}, ignore_index=True) # 预测结果表格添加一行
display(pred_df) # 展示预测结果表格
设置中文显示
# 设置matplotlib中文字体
# # windows操作系统
# plt.rcParams['font.sans-serif']=['SimHei'] # 用来正常显示中文标签
# plt.rcParams['axes.unicode_minus']=False # 用来正常显示负号
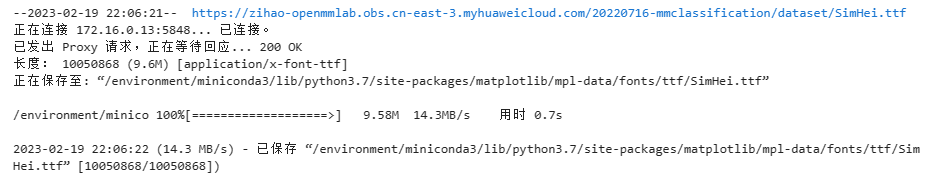
# Mac操作系统,参考 https://www.ngui.cc/51cto/show-727683.html
# 下载 simhei.ttf 字体文件
# !wget https://zihao-openmmlab.obs.cn-east-3.myhuaweicloud.com/20220716-mmclassification/dataset/SimHei.ttf
# Linux操作系统,例如 云GPU平台:https://featurize.cn/?s=d7ce99f842414bfcaea5662a97581bd1
# 如果遇到 SSL 相关报错,重新运行本代码块即可
!wget https://zihao-openmmlab.obs.cn-east-3.myhuaweicloud.com/20220716-mmclassification/dataset/SimHei.ttf -O /environment/miniconda3/lib/python3.7/site-packages/matplotlib/mpl-data/fonts/ttf/SimHei.ttf
!rm -rf /home/featurize/.cache/matplotlib
import matplotlib
matplotlib.rc("font",family='SimHei') # 中文字体
# 对于pillow在图像上写中文的字体,也要进行导入
from PIL import ImageFont, ImageDraw
# 导入中文字体,指定字号
font = ImageFont.truetype('SimHei.ttf', 32)
# 导入工具包
import os
import cv2
from PIL import Image, ImageFont, ImageDraw
import numpy as np
import pandas as pd
import matplotlib.pyplot as plt
%matplotlib inline
import torch
from torchvision import models
import torch.nn.functional as F
from torchvision import transforms
# 有 GPU 就用 GPU,没有就用 CPU
device = torch.device('cuda:0' if torch.cuda.is_available() else 'cpu')
print('device', device)
载入预训练图像分类模型
model = models.resnet18(pretrained=True)
# model = models.resnet152(pretrained=True)
model = model.eval()
model = model.to(device)
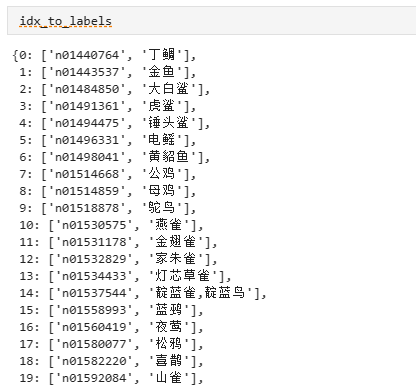
载入ImageNet 1000图像分类中文标签
# 这里的标签就换成了中文chinese
df = pd.read_csv('imagenet_class_index.csv')
idx_to_labels = {}
for idx, row in df.iterrows():
idx_to_labels[row['ID']] = [row['wordnet'], row['Chinese']]
idx_to_labels
图像预处理
# 测试集图像预处理-RCTN:缩放裁剪、转 Tensor、归一化
test_transform = transforms.Compose([transforms.Resize(256),
transforms.CenterCrop(224),
transforms.ToTensor(),
transforms.Normalize(
mean=[0.485, 0.456, 0.406],
std=[0.229, 0.224, 0.225])
])
载入一张测试图像
# img_path = 'test_img/banana1.jpg'
# img_path = 'test_img/husky1.jpeg'
# img_path = 'test_img/watermelon1.jpg'
img_path = 'test_img/cat_dog.jpg'
img_pil = Image.open(img_path) # 用 pillow 载入
img_pil
执行图像分类预测
input_img = test_transform(img_pil).unsqueeze(0).to(device) # 预处理
pred_logits = model(input_img) # 执行前向预测,得到所有类别的 logit 预测分数
pred_softmax = F.softmax(pred_logits, dim=1) # 对 logit 分数做 softmax 运算
各类别置信度柱状图
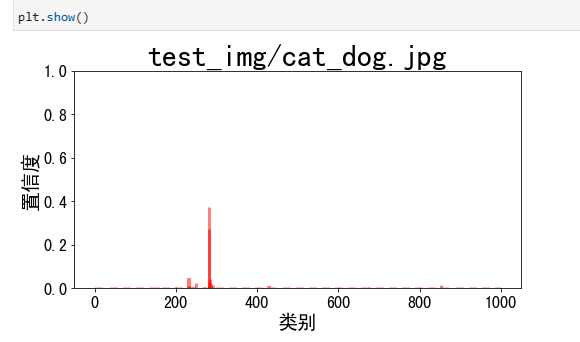
plt.figure(figsize=(8,4))
x = range(1000)
y = pred_softmax.cpu().detach().numpy()[0]
ax = plt.bar(x, y, alpha=0.5, width=0.3, color='yellow', edgecolor='red', lw=3)
plt.ylim([0, 1.0]) # y轴取值范围
# plt.bar_label(ax, fmt='%.2f', fontsize=15) # 置信度数值
plt.title(img_path, fontsize=30)
plt.xlabel('类别', fontsize=20)
plt.ylabel('置信度', fontsize=20)
plt.tick_params(labelsize=16) # 坐标文字大小
plt.show()
取置信度最大的 n 个结果
n = 10
top_n = torch.topk(pred_softmax, n) # 取置信度最大的 n 个结果
pred_ids = top_n[1].cpu().detach().numpy().squeeze() # 解析出类别
confs = top_n[0].cpu().detach().numpy().squeeze() # 解析出置信度
图像分类结果写在原图上
# opencv不能写中文,这里用pil来写中文
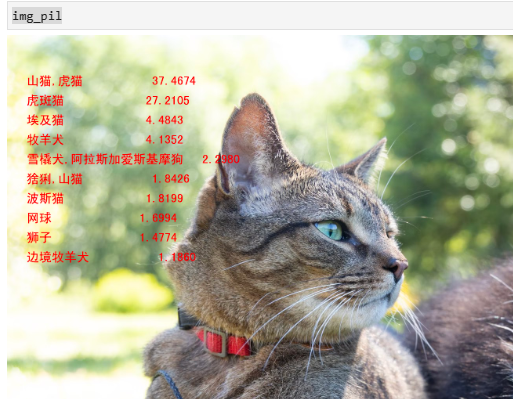
draw = ImageDraw.Draw(img_pil)
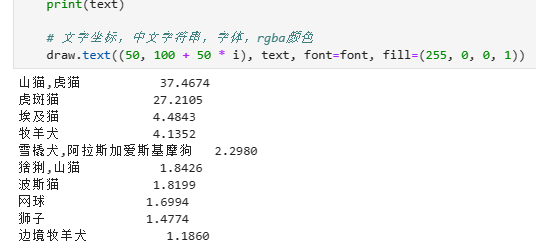
for i in range(n):
class_name = idx_to_labels[pred_ids[i]][1] # 获取类别名称
confidence = confs[i] * 100 # 获取置信度
text = '{:<15} {:>.4f}'.format(class_name, confidence)
print(text)
# 文字坐标,中文字符串,字体,rgba颜色
draw.text((50, 100 + 50 * i), text, font=font, fill=(255, 0, 0, 1))
img_pil

# 保存图像
img_pil.save('output/img_pred.jpg')
图像和柱状图一起显示
fig = plt.figure(figsize=(18,6))
# 绘制左图-预测图
ax1 = plt.subplot(1,2,1)
ax1.imshow(img_pil)
ax1.axis('off')
# 绘制右图-柱状图
ax2 = plt.subplot(1,2,2)
x = df['ID']
y = pred_softmax.cpu().detach().numpy()[0]
ax2.bar(x, y, alpha=0.5, width=0.3, color='yellow', edgecolor='red', lw=3)
plt.ylim([0, 1.0]) # y轴取值范围
plt.xlabel('类别', fontsize=20)
plt.ylabel('置信度', fontsize=20)
ax2.tick_params(labelsize=16) # 坐标文字大小
plt.title('{} 图像分类预测结果'.format(img_path), fontsize=30)
plt.tight_layout()
fig.savefig('output/预测图+柱状图.jpg')

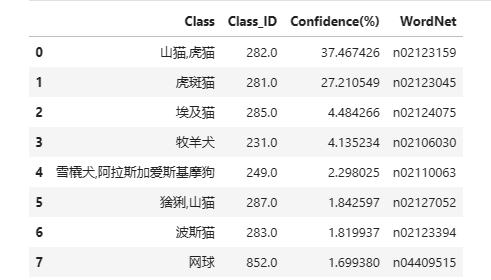
预测结果表格输出
pred_df = pd.DataFrame() # 预测结果表格
for i in range(n):
class_name = idx_to_labels[pred_ids[i]][1] # 获取类别名称
label_idx = int(pred_ids[i]) # 获取类别号
wordnet = idx_to_labels[pred_ids[i]][0] # 获取 WordNet
confidence = confs[i] * 100 # 获取置信度
pred_df = pred_df.append({'Class':class_name, 'Class_ID':label_idx, 'Confidence(%)':confidence, 'WordNet':wordnet}, ignore_index=True) # 预测结果表格添加一行
display(pred_df) # 展示预测结果表格