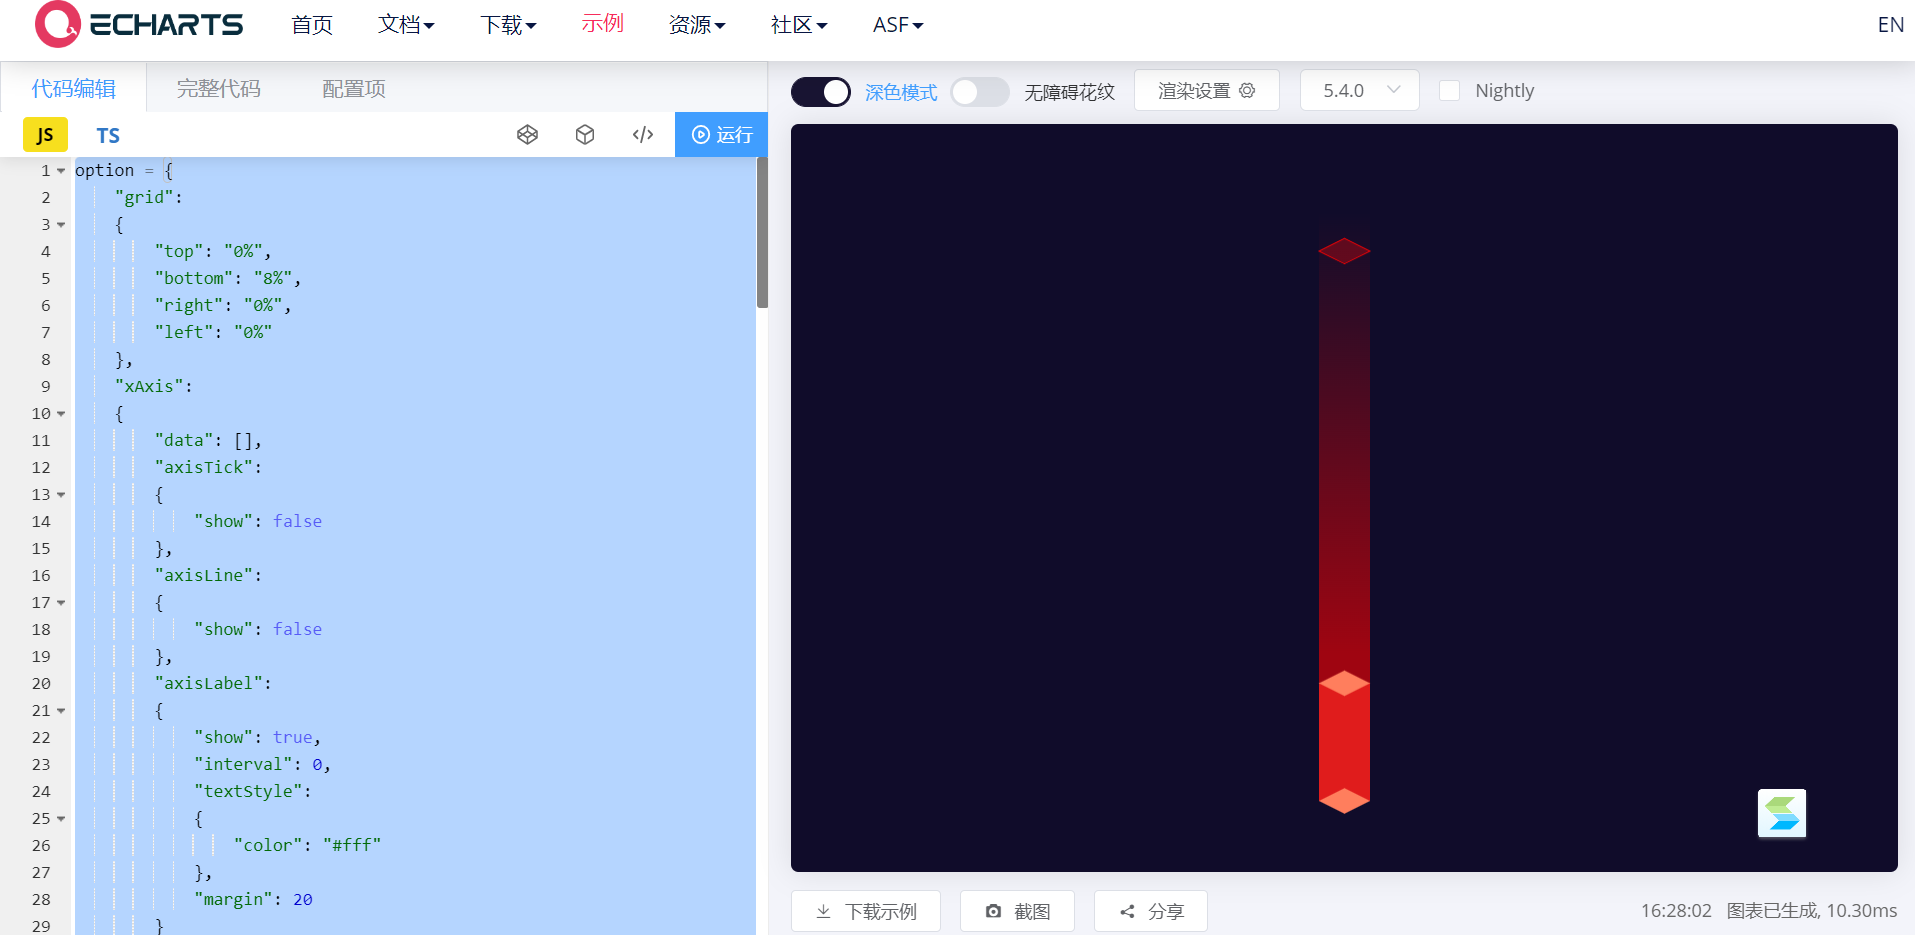
option = {
    "grid":
    {
        "top": "0%",
        "bottom": "8%",
        "right": "0%",
        "left": "0%"
    },
    "xAxis":
    {
        "data": [],
        "axisTick":
        {
            "show": false
        },
        "axisLine":
        {
            "show": false
        },
        "axisLabel":
        {
            "show": true,
            "interval": 0,
            "textStyle":
            {
                "color": "#fff"
            },
            "margin": 20
        }
    },
    "yAxis":
    {
        "splitLine":
        {
            "show": false
        },
        "axisTick":
        {
            "show": false
        },
        "axisLine":
        {
            "show": false
        },
        "axisLabel":
        {
            "show": false
        }
    },
    "series": [
    {
        "z": 1,
        "type": "bar",
        "barWidth": 34,
        "barGap": "-100%",
        "itemStyle":
        {
            "normal":
            {
                "color":
                {
                    "type": "linear",
                    "x": 0,
                    "y": 0,
                    "x2": 0,
                    "y2": 1,
                    "colorStops": [
                    {
                        "offset": 0,
                        "color": "rgba(255,7,7,0)"
                    },
                    {
                        "offset": 0.75,
                        "color": "rgba(255,0,0,0.6)"
                    },
                    {
                        "offset": 1,
                        "color": "rgba(255,0,0,0.6)"
                    }],
                    "global": false
                }
            }
        },
        "data": [16]
    },
    {
        "z": 1,
        "type": "pictorialBar",
        "symbolPosition": "end",
        "data": [16],
        "symbol": "diamond",
        "symbolOffset": [0, "80%"],
        "symbolSize": [34, 17],
        "itemStyle":
        {
            "normal":
            {
                "color": "rgba(255,7,7,0.3)",
                "borderColor": "rgba(255,0,0,1)",
                "borderWidth": 10
            }
        }
    },
    {
        "type": "bar",
        "barWidth": 34,
        "itemStyle":
        {
            "normal":
            {
                "color": "rgba(224,28,28,1)"
            }
        },
        "data": [3.2],
        "z": 1
    },
    {
        "z": 3,
        "legendHoverLink": false,
        "hoverAnimation": false,
        "type": "pictorialBar",
        "symbolPosition": "end",
        "data": [3.2],
        "symbol": "diamond",
        "symbolOffset": [0, "-50%"],
        "symbolSize": [34, 17],
        "itemStyle":
        {
            "normal":
            {
                "borderWidth": 0,
                "color": "rgba(255,126,93,1)"
            }
        }
    },
    {
        "z": 2,
        "legendHoverLink": false,
        "hoverAnimation": false,
        "type": "pictorialBar",
        "data": [0],
        "symbol": "diamond",
        "symbolOffset": [0, "50%"],
        "symbolSize": [34, 17],
        "itemStyle":
        {
            "normal":
            {
                "color": "rgba(255,126,93,1)"
            }
        }
    }]
}


 浙公网安备 33010602011771号