


ECharts 大屏显示图
代码下载包
https://files.cnblogs.com/files/yehuisir/eckarts_open_class-master.zip?t=1650275102
--------------------------------------------------------------------------------------------------------------------------------------------------------------------------------------
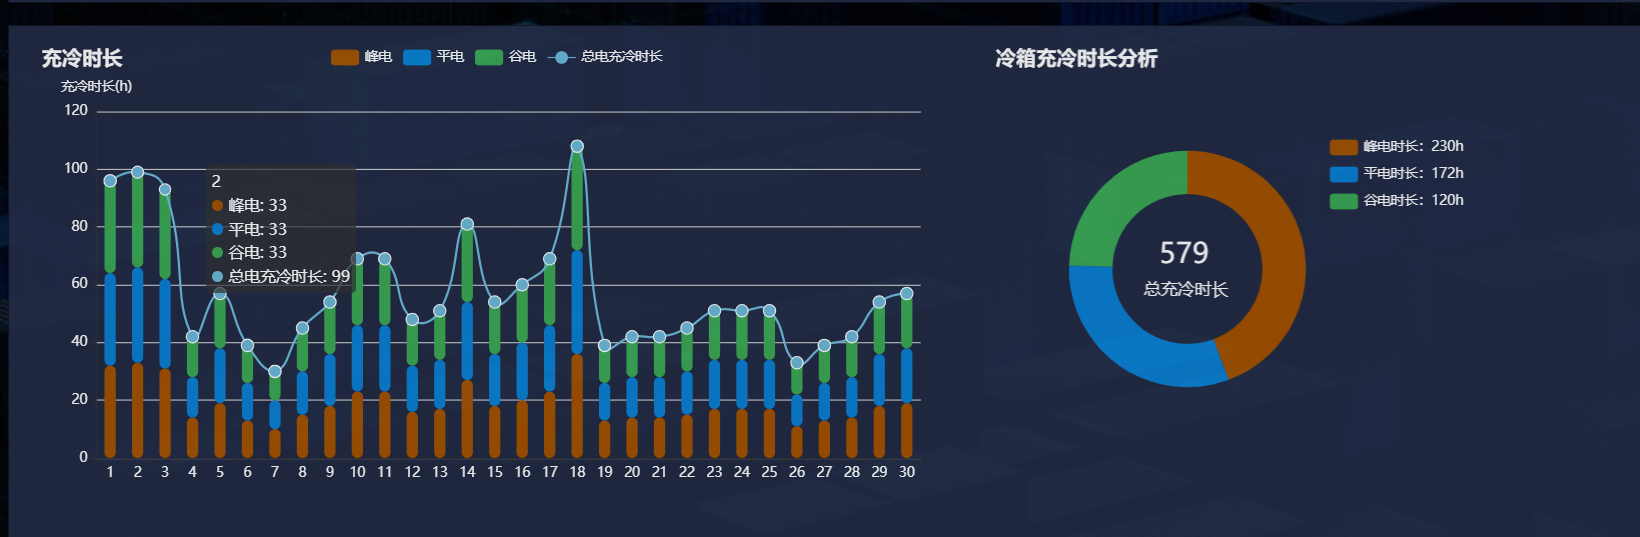
1 2 3 4 5 6 7 8 9 10 11 12 13 14 15 16 17 18 19 20 21 22 23 24 25 26 27 28 29 30 31 32 33 34 35 36 37 38 39 40 41 42 43 44 45 46 47 48 49 50 51 52 53 54 55 56 57 58 59 60 61 62 63 64 65 66 67 68 69 70 71 72 73 74 75 76 77 78 79 80 81 82 83 84 85 86 87 88 89 90 91 92 93 94 95 96 97 98 99 100 101 102 103 104 105 106 107 108 109 110 111 112 113 114 115 116 117 118 119 120 121 122 123 124 125 126 127 128 129 130 131 132 133 134 135 136 137 138 139 140 141 142 143 144 145 146 147 148 149 150 151 152 153 154 155 156 157 158 159 160 161 162 163 164 165 166 167 168 169 170 171 172 173 174 175 176 177 178 179 180 181 182 183 184 185 186 187 188 189 190 191 192 193 194 195 196 197 198 199 200 201 202 203 204 205 206 207 208 209 210 211 212 213 214 215 216 217 218 219 220 221 222 223 224 225 226 227 228 229 230 | var data_f = [ 32, 33, 31, 14, 19, 13, 10,15,18,23, 23, 16, 17,27, 18, 20, 23,36,13,14, 14, 15, 17, 17, 17, 11, 13,14,18,19, ]; var data_p = [ 32, 33, 31, 14, 19, 13, 10,15,18,23, 23, 16, 17,27, 18, 20, 23,36,13,14, 14, 15, 17, 17, 17, 11, 13,14,18,19, ]; var data_g = [ 32, 33, 31, 14, 19, 13, 10,15,18,23, 23, 16, 17,27, 18, 20, 23,36,13,14, 14, 15, 17, 17, 17, 11, 13,14,18,19, ]; var data_z = [96, 99, 93, 42, 57, 39, 30, 45, 54, 69, 69, 48, 51, 81, 54, 60, 69, 108, 39, 42, 42, 45, 51, 51, 51, 33, 39, 42, 54, 57] this.BarOption1 = { color:["#A35200", "#0A7FD2", "#3BA854", "#6DB9D9",], title: { text: '充冷时长', textStyle:{ color: '#FFFFFF' }, }, tooltip: { trigger: 'axis', axisPointer: { type: 'shadow' } }, legend: { textStyle: { color: "#FFFFFF" }, }, grid: { left: '3%', right: '4%', bottom: '3%', containLabel: true , tooltip: { textStyle: { color: "rgba(143, 38, 38, 1)" } } }, xAxis: [ { type: 'category', data: [ '1', '2', '3', '4', '5', '6', '7','8','9','10', '11', '12', '13', '14', '15', '16', '17','18','19','20', '21', '22', '23', '24', '25', '26', '27','28','29','30', ], axisLabel: { color: '#FFFFFF' } }, ], yAxis: [ { type: 'value', axisLabel: { color: '#FFFFFF', interval: 30 }, splitArea: { interval: 6 }, nameTextStyle: { color: "#FFFFFF" }, name: "充冷时长(h)" } ], series: [ { name: '峰电', type: 'bar', emphasis: { focus: 'series' }, stack:"总量", data:data_f, barWidth: 10, itemStyle:{ barBorderRadius: 15, }, }, { name: '平电', type: 'bar', stack:"总量", emphasis: { focus: 'series' }, barWidth: 10, itemStyle:{ barBorderRadius: 15, }, data: data_p, }, { name: '谷电', type: 'bar', stack:"总量", emphasis: { focus: 'series' }, itemStyle:{ barBorderRadius: 15, }, barCategoryGap: "58%", barWidth: 10, data: data_g }, , { name: '总电充冷时长', type: 'line', smooth:true, symbol: 'circle', //设定为实心点 symbolSize: 11, data: data_z, itemStyle: { borderColor: "#FFFFFF", }, } ] }; this.BarOption2 = { color:["#A35200", "#0A7FD2", "#3BA854",], title: { text: '冷箱充冷时长分析', textStyle:{ color: '#FFFFFF' }, }, graphic:[{ type:'text', left:'33%', top:'44%', style:{ text:'579', textAlign:'center', fill:'#FFFFFF', width:30, height:30, color:"#FFFFFF", fontSize: 25, } }, { type:'text', left:'30%', top:'53%', style:{ text:'总充冷时长', textAlign:'center', fill:'#FFFFFF', width:30, height:30, color:"#FFFFFF", fontSize: 15, }}], tooltip: { trigger: 'item' }, legend: { top: '20%', right:"30px", textStyle: { color: "#FFFFFF" }, orient: "vertical", }, series: [ { // name: 'Access From', type: 'pie', radius: ['60%', '38%'], right: "23%", avoidLabelOverlap: false, label: { show: false, position: 'center' }, // emphasis: { // label: { // show: true, // fontSize: '40', // fontWeight: 'bold' // } // }, labelLine: { show: false }, data: [ { value: 1048, name: '峰电时长:230h' }, { value: 735, name: '平电时长:172h' }, { value: 580, name: '谷电时长:120h' }, ] } ] }; |
实例二
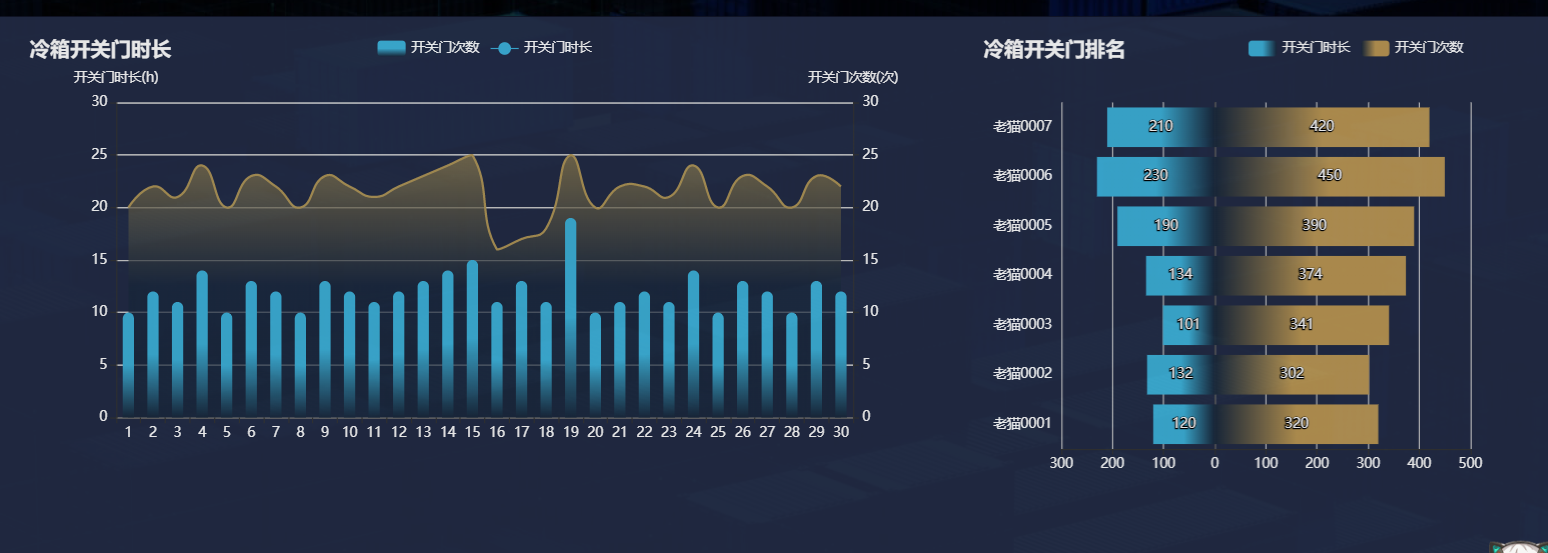

 //初始化echarts
    this.BarOption1 = {

      color:["#3DB1D9","#AE9456"],
      title: {
        text: '冷箱开关门时长',
        textStyle:{
          color: '#FFFFFF'
        },
      },
      tooltip: {
        trigger: 'axis',
        axisPointer: {
          type: 'cross',
          crossStyle: {
            color: '#999'
          }
        }
      },

      legend: {
        data: ['开关门次数', '开关门时长'],
        textStyle: {
          color: "#FFFFFF"
        },
      },
      xAxis: [
        {
          type: 'category',
          data: [
            '1', '2', '3', '4', '5', '6', '7','8','9','10',
            '11', '12', '13', '14', '15', '16', '17','18','19','20',
            '21', '22', '23', '24', '25', '26', '27','28','29','30',
        ],
          axisPointer: {
            type: 'shadow'
          },
          axisLabel: {
            color: '#FFFFFF'
          }
        }
      ],
      yAxis: [
        {
          type: 'value',
          // name: 'Precipitation',
          min: 0,
          max: 30,
          interval: 5,
          axisLabel: {
            formatter: '{value}',
            color: '#FFFFFF'
          },

          name: "开关门时长(h)",
          nameTextStyle: {
            color:'#FFFFFF'
          }
        },
        {
          type: 'value',

          min: 0,
          max: 30,
          interval: 5,
          axisLabel: {
            formatter: '{value}',
            color: '#FFFFFF'
          },
          name: "开关门次数(次)",
          nameTextStyle: {
            color:'#FFFFFF'
          }
        }
      ],
      series: [
        {
          name: '开关门次数',
          type: 'bar',
          tooltip: {
            valueFormatter: function (value) {
              return value ;
            }
          },
          data: [
            10, 12,11, 14, 10, 13, 12,10, 13, 12,
            11, 12,13, 14, 15, 11, 13,11, 19, 10,
            11, 12,11, 14, 10, 13, 12,10, 13, 12,
          ],
          barWidth: 10,
          itemStyle: {
            barBorderRadius: [15,15,0,0],

              // // 填充色渐变
              color: new echarts.graphic.LinearGradient(0, 0, 0, 1, [
                { offset: 0, color: "#3DB1D9" },
                { offset: 0.5, color: "#3DB1D9" },
                { offset: 1, color: "#19283C" }
              ])

          },

        },

        {
          name: '开关门时长',
          type: 'line',
          symbol: "none",
          lineStyle: {
            color: "#AE9456"
          },
          yAxisIndex: 1,
          tooltip: {
            valueFormatter: function (value) {
              return value + '';
            }
          },
          scale: false,
          data: [ 20, 22,21, 24, 20, 23, 22,20, 23, 22,
                  21, 22,23, 24, 25, 16, 17,18, 25, 20,
                  22, 22,21, 24, 20, 23, 22,20, 23, 22,],
            smooth:true,
            areaStyle: {

                // 填充色渐变
                color: new echarts.graphic.LinearGradient(0, 0, 0, 1, [
                  { offset: 0, color: "#98834F" },
                  { offset: 0.5, color: "#19283C" },
                  { offset: 1, color: "#19283C" }
                ])


            }
        }
      ]
    };


    this.BarOption2 = {
      color:["#AE9456","#3DB1D9"],
      title: {
        text: '冷箱开关门排名',
        textStyle:{
          color: '#FFFFFF'
        },
      },
      tooltip : {
          trigger: 'axis',
          axisPointer : {            // 坐标轴指示器,坐标轴触发有效
              type : 'shadow'        // 默认为直线,可选为:'line' | 'shadow'
          }
      },
      legend: {
          data:['开关门时长','开关门次数',],
          textStyle: {
            color: "#FFFFFF"
          },
          right:"20px",
      },
      grid: {
          left: '3%',
          right: '4%',
          bottom: '3%',
          containLabel: true
      },
      xAxis : [
          {
              type : 'value',

              splitLine:{
                  show:true,
              },
              //横坐标的负半轴的  "坐标轴" 上显示是正数
              axisLabel:{
                color: '#FFFFFF',
                  show:true,//不显示坐标轴的数字
                  formatter:function(value){
                      if (value<0) {
                          return -value;
                      }else{
                        return value;
                      }
                  }
              }
          }
      ],
      yAxis : [
          {
              show:true,//纵坐标显示
              type : 'category',
              position:'left',//纵向坐标显示位置 可选为:left | right
              axisTick : {show: false},
              // splitArea : {show : true},

              splitLine:{
             show:false//网格线不显示
            },
              data : ['老猫0001','老猫0002','老猫0003','老猫0004','老猫0005','老猫0006','老猫0007'],
              axisLabel: {

                color: '#FFFFFF'
              },
          }
      ],

      series : [
          {
              name:'开关门时长',
              type:'bar',
              stack: '总量',
              label: {
                  normal: {
                      show: true,
                      /*
                      *处理横坐标负半轴这边的  "柱状"  显示的数
                      *后台传过来是负数,显示时是正数
                       */
                      formatter: function (value) {
                          if(value.data<0){
                              return -value.data;
                          }else{
                            return value.data;
                          }
                      },
                  }
              },
              data:[-120, -132, -101, -134, -190, -230, -210],
              itemStyle: {


                  // // 填充色渐变
                  color: new echarts.graphic.LinearGradient(0,0, 1, 0, [
                    { offset: 0, color: "#3DB1D9" },
                    { offset: 0.5, color: "#3DB1D9" },
                    { offset: 1, color: "#19283C" }
                  ])

              },
          },
           {
              name:'开关门次数',
              type:'bar',
              stack: '总量',
              label: {
                  normal: {
                      show: true
                  }
              },
              data:[320, 302, 341, 374, 390, 450, 420],
              itemStyle: {


                // // 填充色渐变
                color: new echarts.graphic.LinearGradient(1,0, 0, 0, [
                  { offset: 0, color: "#BB9753" },
                  { offset: 0.5, color: "#BB9753" },
                  { offset: 1, color: "#19283C" }
                ])

            },
          },
      ]
  };
实例三
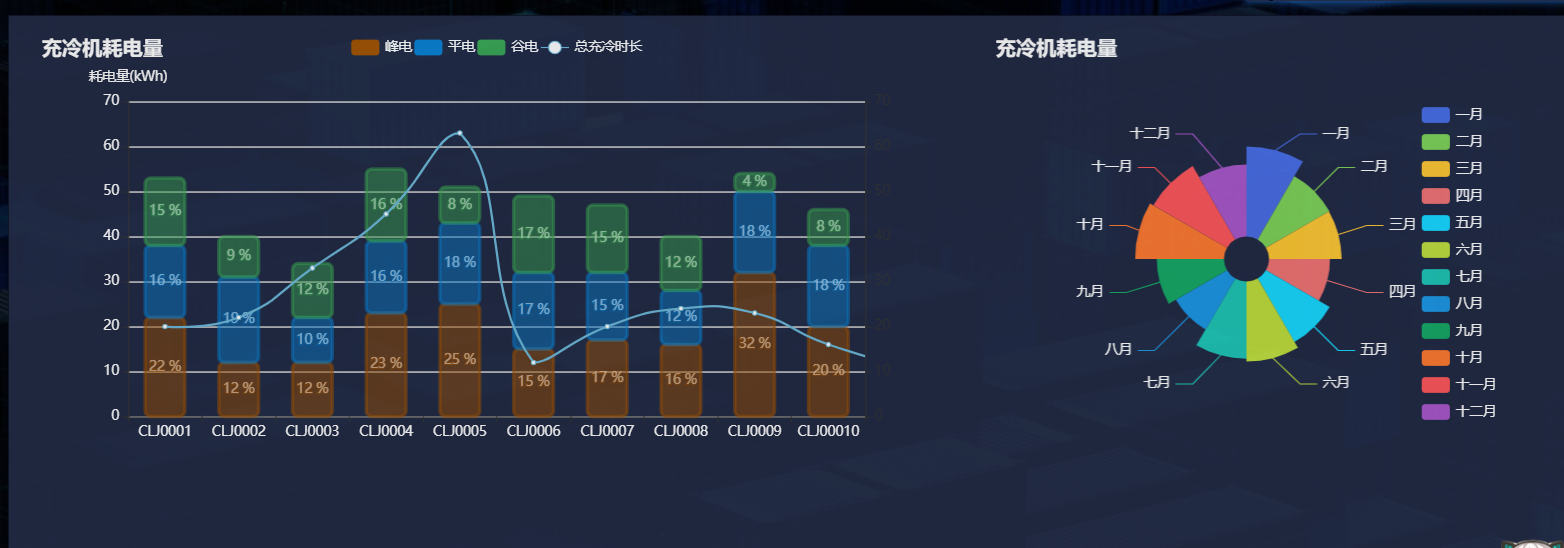
 this.BarOption1 = {
      color:["#A35200", "#0A7FD2", "#3BA854", "#6DB9D9",],
      title: {
        text: '充冷机耗电量',
        textStyle:{
          color: '#FFFFFF'
        },
      },
      tooltip: {

        axisPointer: {
          type: 'cross',
          crossStyle: {
            color: '#999'
          }
        },
        trigger: 'axis',
      },

      legend: {
        data: ['峰电', '平电', '谷电', '总充冷时长'],
        textStyle: {
          color: "#FFFFFF"
        },
        itemGap: 2
      },
      xAxis: [
        {
          type: 'category',
          data: [
            'CLJ0001', 'CLJ0002', 'CLJ0003', 'CLJ0004', 'CLJ0005', 'CLJ0006', 'CLJ0007', 'CLJ0008', 'CLJ0009', 'CLJ00010',

          ],

          axisLabel: {
            color: "#FFFFFF",
            interval: 0
          },


        }
      ],
      yAxis: [
        {
          type: 'value',
          name: '耗电量(kWh)',
          min: 0,
          max: 70,
          interval: 10,
          axisLabel: {
            formatter: '{value}',
            color: "#FFFFFF"
          },
          nameTextStyle: {
            color: "#FFFFFF"
          },

        },
        {

        }
      ],
      series: [

        {
          name: '峰电',
          type: 'bar',
          // tooltip: {
          //   valueFormatter: function (value) {
          //     return value + '%';
          //   }
          // },
          data: [
            22, 12, 12, 23, 25, 15, 17, 16, 32, 20,
          ],
          stack: 'sum',
          label: {
            show: true,
            formatter: '{c} %',
            padding:5,
          },
          itemStyle: {

            barBorderRadius: 5,
            borderWidth: 3,

            opacity: 0.5,
              borderColor:"#A35200",
          },

          barCategoryGap: "46%",

        }
      ,
        {
          name: '平电',
          type: 'bar',
          // tooltip: {
          //   valueFormatter: function (value) {
          //     return value + ' %';
          //   }
          // },
          data: [
            16, 19, 10, 16, 18, 17, 15, 12, 18, 18,
          ],
          stack: 'sum',
          label: {
            show: true,
            formatter: '{c} %',
            padding:5,
          },
          itemStyle: {
            opacity: 0.5,
              barBorderRadius: 5,
              borderWidth: 3
              ,
              borderColor:"#0A7FD2",
          },

          barCategoryGap: "46%",
        },
        ,
        {
          name: '谷电',
          type: 'bar',
          // tooltip: {
          //   valueFormatter: function (value) {
          //     return value + ' %';
          //   }
          // },
          data: [
            15, 9, 12, 16, 8, 17, 15, 12, 4, 8,
          ],
          stack: 'sum',
          label: {
            show: true,
            formatter: '{c} %',
            padding:5,
          },
          itemStyle: {

            opacity: 0.5,
              barBorderRadius: 5,
              borderWidth: 3,
              borderColor:"#3BA854",
          },

          barCategoryGap: "46%",
        }
  ,

        {
          name: '总充冷时长',
          type: 'line',
          yAxisIndex: 1,
          tooltip: {
            valueFormatter: function (value) {
              return value + ' %';
            }
          },
          smooth:true,
          data: [20, 22, 33, 45, 63, 12, 20, 24, 23, 16, 12, 62]
        }
     ]
    };
    this.BarOption2 = {
      color: ["#496EE6", "#7FD359", "#FFC832", "#F27475", "#17D9FF", "#C0DF3E", "#1FC5B6", "#1D98E5", "#17A966", "#FF7B32", "#FF575B", "#A958CB"],
      title: {
        text: '充冷机耗电量',
        textStyle:{
          color: '#FFFFFF'
        },
      },
      legend: {
        // top: 'bottom',
        textStyle: {
          color: "#FFFFFF",
          fontSize: 12,
          fontFamily: "PingFangSC-Regular"
        },
        orient: "vertical",
        right: 1,
        bottom: 52,
      },

      series: [
        {
          name: 'Nightingale Chart',
          type: 'pie',
          radius: [20, 100],

          center: ['50%', '50%'],
          roseType: 'area',
          itemStyle: {
            borderRadius: 8
          },
          data: [
            {name: '一月', value: '49.8',label: {
              color: "#FFFFFF"
            }},
            {name: '二月', value: '40.5',label: {
              color: "#FFFFFF"
            }},
            {name: '三月', value: '40.1',label: {
              color: "#FFFFFF"
            }},
            {name: '四月', value: '33.7',label: {
              color: "#FFFFFF"
            }},
            {name: '五月', value: '40.6',label: {
              color: "#FFFFFF"
            }},
            {name: '六月', value: '44.3',label: {
              color: "#FFFFFF"
            }},
            {name: '七月', value: '42.7',label: {
              color: "#FFFFFF"
            }},
            {name: '八月', value: '32.6',label: {
              color: "#FFFFFF"
            }},
            {name: '九月', value: '37.0',label: {
              color: "#FFFFFF"
            }},
            {name: '十月', value: '49.0',label: {
              color: "#FFFFFF"
            }},
            {name: '十一月', value: '46.9',label: {
              color: "#FFFFFF"
            }},
            {name: '十二月', value: '39.8',label: {
              color: "#FFFFFF"
            }}
          ]
        }
      ]
    };
实例四
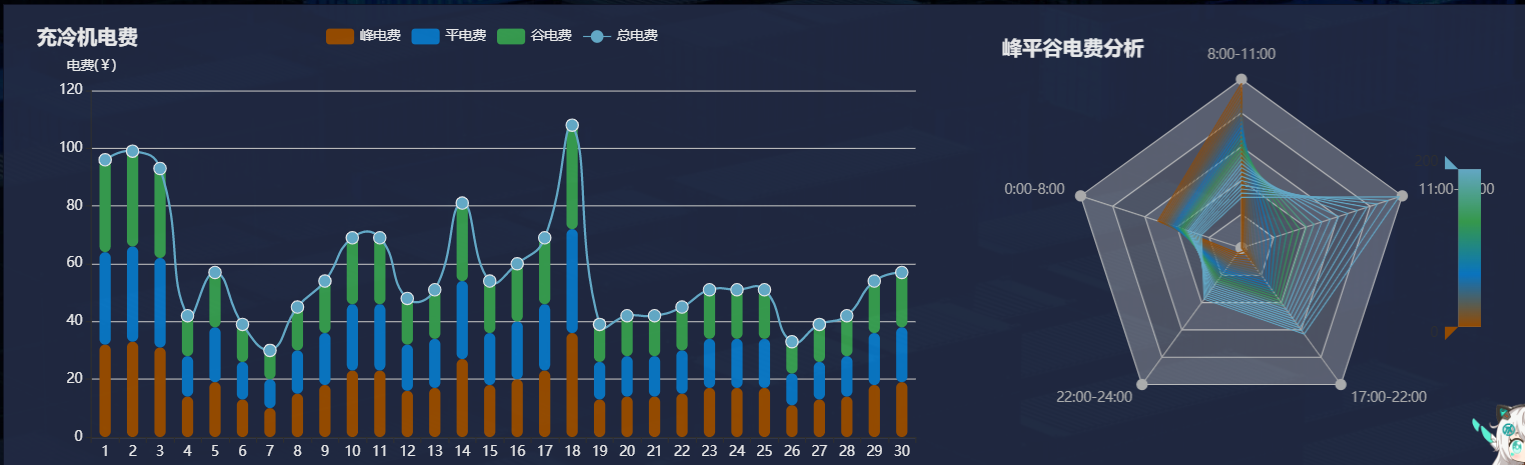
 this.BarOption1 = {
      color:["#A35200", "#0A7FD2", "#3BA854", "#6DB9D9",],
      title: {
        text: '充冷机电费',
        textStyle:{
          color: '#FFFFFF'
        },
      },
      tooltip: {
        trigger: 'axis',
        axisPointer: {
          type: 'shadow'
        }
      },
      legend: {
        textStyle: {
          color: "#FFFFFF"
        },
      },
      grid: {
        left: '3%',
        right: '4%',
        bottom: '3%',
        containLabel: true
     ,
          tooltip: {
            textStyle: {
              color: "rgba(143, 38, 38, 1)"
            }
          }

      },
      xAxis: [
        {
          type: 'category',
          data: [
            '1', '2', '3', '4', '5', '6', '7','8','9','10',
            '11', '12', '13', '14', '15', '16', '17','18','19','20',
            '21', '22', '23', '24', '25', '26', '27','28','29','30',
        ],
          axisLabel: {
            color: '#FFFFFF'
          }
        },


      ],
      yAxis: [
        {
          type: 'value',
          axisLabel: {
            color: '#FFFFFF',
            interval: 30
          },
          splitArea: {
            interval: 6
          },
          nameTextStyle: {
            color: "#FFFFFF"
          },
          name: "电费(¥)"
        }
      ],
      series: [
        {
          name: '峰电费',
          type: 'bar',
          emphasis: {
            focus: 'series'
          },
          stack:"总量",
          data:data_f,
          barWidth: 10,
          itemStyle:{

            barBorderRadius: 15,

           },

        },
        {
          name: '平电费',
          type: 'bar',
          stack:"总量",
          emphasis: {
            focus: 'series'
          },
          barWidth: 10,
          itemStyle:{

            barBorderRadius: 15,

           },
          data: data_p,

        },
        {
          name: '谷电费',
          type: 'bar',
          stack:"总量",
          emphasis: {
            focus: 'series'
          },
          itemStyle:{

            barBorderRadius: 15,

           },
           barCategoryGap: "58%",
          barWidth: 10,
          data: data_g
        },
        ,
        {
            name: '总电费',
            type: 'line',
            smooth:true,
           symbol: 'circle',     //设定为实心点
            symbolSize: 11,
            data: data_z,
            itemStyle: {

              borderColor: "#FFFFFF",
            },

        }


      ]
    };


    this.BarOption2 = {


      title: {
        text: '峰平谷电费分析',
        top: 10,
        left: 10,
        textStyle:{
          color: '#FFFFFF'
        },
      },
      tooltip: {
        trigger: 'item'
      },
      // legend: {
      //   type: 'scroll',
      //   bottom: 10,
      //   data: (function () {
      //     var list = [];
      //     for (var i = 1; i <= 28; i++) {
      //       list.push(i + 2000 + '');
      //     }
      //     return list;
      //   })()
      // },
      visualMap: {
        top: 'middle',
        right: 10,

        color:[ "#6DB9D9",  "#3BA854",  "#0A7FD2", "#A35200",],
        calculable: true
      },
      radar: {
        indicator: [
          { text: '8:00-11:00', max: 400 },
          { text: '0:00-8:00', max: 400 },
          { text: '22:00-24:00', max: 400 },
          { text: '17:00-22:00', max: 400 },
          { text: '11:00-17:00', max: 400 }
        ],
        axisLine: {
          symbol: "circle"
        }
      },
      series: (function () {
        var series = [];
        for (var i = 1; i <= 28; i++) {
          series.push({
            type: 'radar',
            symbol: 'none',
            lineStyle: {
              width: 1
            },
            emphasis: {
              areaStyle: {
                color: 'rgba(0,250,0,0.3)'
              }
            },
            data: [
              {
                value: [
                  (40 - i) * 10,
                  (38 - i) * 4 + 60,
                  i * 5 + 10,
                  i * 9,
                  (i * i) / 2
                ],
                name: i + 2000 + ''
              }
            ]
          });
        }
        return series;
      })()
    };
实例五
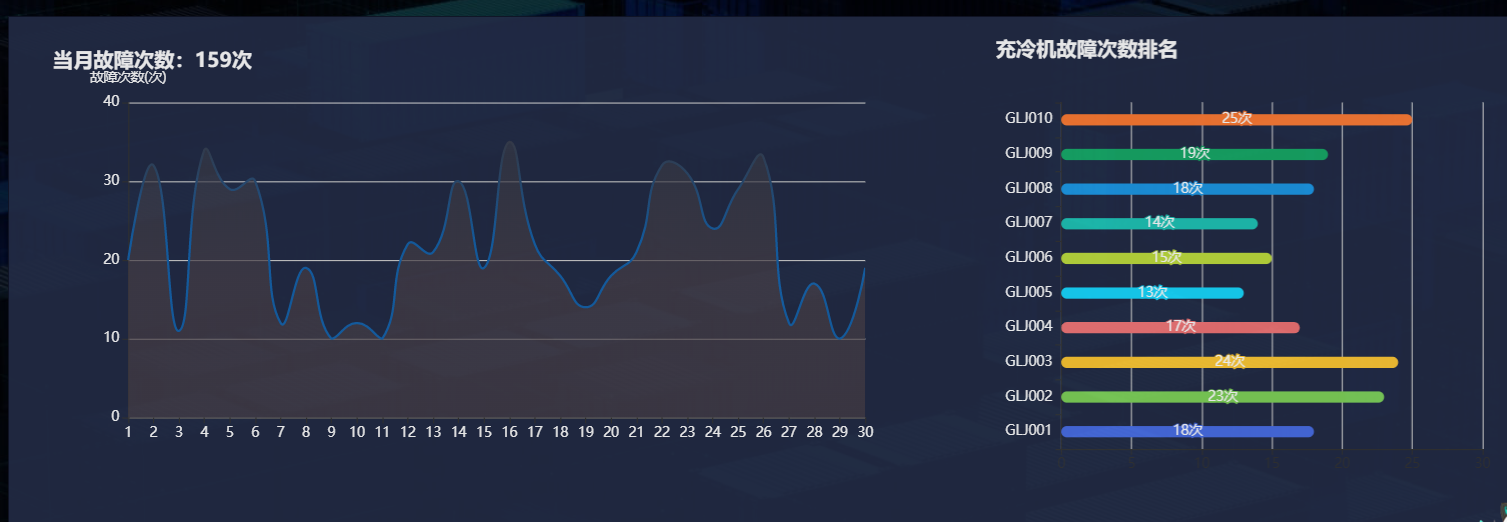
 this.BarOption1 = {

      title: {
        text: '当月故障次数:159次',
        top: 10,
        left: 10,
        textStyle:{
          color: '#FFFFFF'
        },
      },
      xAxis: {
        type: 'category',
        boundaryGap: false,
        data: [  '1', '2', '3', '4', '5', '6', '7','8','9','10',
        '11', '12', '13', '14', '15', '16', '17','18','19','20',
        '21', '22', '23', '24', '25', '26', '27','28','29','30',],
        axisLabel: {
          color: "#FFFFFF",

        },

      },
      yAxis: {
        type: 'value',
        axisLabel: {
          formatter: '{value}',
          color: "#FFFFFF"
        },
        nameTextStyle: {
          color: "#FFFFFF"
        },
        name: '故障次数(次)',
        axisLine: {
          show: true
        },
        axisTick: {
          show: true
        },
        lineStyle: {
          color: "rgba(173, 62, 62, 1)"
        }

      },
      series: [
        {
          data: [
            20, 32, 11, 34, 29, 30, 12,19, 10, 12,
            10, 22, 21, 30, 19, 35, 22,18, 14, 18,
            21, 32, 31, 24, 29, 33, 12,17, 10, 19,
          ],
          type: 'line',

          smooth:true,
          scale: false,
          symbol: "none",
          areaStyle: {

            // 填充色渐变
            color: new echarts.graphic.LinearGradient(0, 0, 0, 1, [
              { offset: 0, color: "#393C49" },
              { offset: 0.5, color: "#4C4249" },
              { offset: 1, color: "#4C4249" }
            ])


        },
        lineStyle: {
          // color: "#1562AA",
          // 填充色渐变
          color: new echarts.graphic.LinearGradient(0, 0, 0, 1, [
            { offset: 0, color: "#393C49" },
            { offset: 0.5, color: "#1562AA" },
            { offset: 1, color: "#1562AA" }
          ])
        },
        }
      ]
    };

    var myColor =   ["#496EE6", "#7FD359", "#FFC832", "#F27475", "#17D9FF", "#C0DF3E", "#1FC5B6", "#1D98E5", "#17A966", "#FF7B32"];


    this.BarOption2 = {

      title: {
        text: '充冷机故障次数排名',
        textStyle:{
          color: '#FFFFFF'
        },
      },
      tooltip: {
        trigger: 'axis',
        axisPointer: {
          type: 'shadow'
        }
      },
      // legend: {},
      grid: {
        left: '3%',
        right: '4%',
        bottom: '3%',
        containLabel: true
      },
      xAxis: {
        type: 'value',
        boundaryGap: [0, 0.01]
      },
      yAxis: {
        type: 'category',
        data: ['GLJ001', 'GLJ002', 'GLJ003', 'GLJ004', 'GLJ005', 'GLJ006', 'GLJ007', 'GLJ008', 'GLJ009', 'GLJ010'],
        axisLabel: {

          color: "#FFFFFF"
        },
      },
      series: [
        {
          name: '2011',
          type: 'bar',
          data: [
            18, 23, 24, 17, 13, 15,14, 18, 19, 25,
          ],
          // 修改第一组柱子的圆角
        itemStyle: {
          barBorderRadius: 20,
          // 此时的color 可以修改柱子的颜色
          color: function(params) {
            // params 传进来的是柱子对象
            // console.log(params);
            // dataIndex 是当前柱子的索引号
            return myColor[params.dataIndex];
          }
        },
        // 柱子之间的距离
        barCategoryGap: 50,
        //柱子的宽度
        barWidth: 10,
        // 显示柱子内的文字
        label: {
          show: true,
          position: "inside",
          // {c} 会自动的解析为 数据  data里面的数据
          formatter: "{c}次"
        }
        }
      ]
    };
实例六
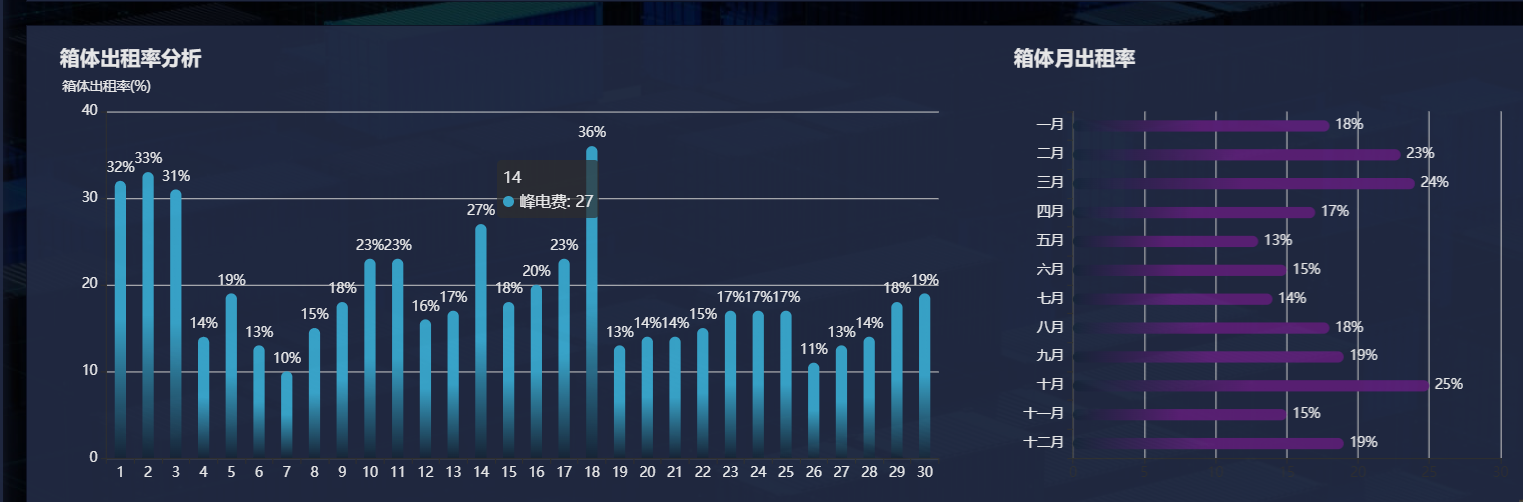
    this.BarOption1 = {
      // color:["#A35200", "#0A7FD2", "#3BA854", "#6DB9D9",],
      title: {
        text: '箱体出租率分析',
        textStyle:{
          color: '#FFFFFF'
        },
      },
      tooltip: {
        trigger: 'axis',
        axisPointer: {
          type: 'shadow'
        }
      },
      legend: {
        textStyle: {
          color: "#FFFFFF"
        },
        show:false,
      },
      grid: {
        left: '3%',
        right: '4%',
        bottom: '3%',
        containLabel: true
     ,
          tooltip: {
            textStyle: {
              color: "rgba(143, 38, 38, 1)"
            }
          }

      },
      xAxis: [
        {
          type: 'category',
          data: [
            '1', '2', '3', '4', '5', '6', '7','8','9','10',
            '11', '12', '13', '14', '15', '16', '17','18','19','20',
            '21', '22', '23', '24', '25', '26', '27','28','29','30',
        ],
          axisLabel: {
            color: '#FFFFFF'
          }
        },


      ],
      yAxis: [
        {
          type: 'value',
          axisLabel: {
            color: '#FFFFFF',
            interval: 30
          },
          splitArea: {
            interval: 6
          },
          nameTextStyle: {
            color: "#FFFFFF"
          },
          name: "箱体出租率(%)"
        }
      ],
      series: [
        {
          name: '峰电费',
          type: 'bar',
          emphasis: {
            focus: 'series'
          },
          stack:"总量",
          data:data_f,
          barWidth: 10,
          itemStyle:{

            barBorderRadius: [15,15,0,0],
       // // 填充色渐变
            color: new echarts.graphic.LinearGradient(0, 0, 0, 1, [
              { offset: 0, color: "#3DB1D9" },
              { offset: 0.5, color: "#3DB1D9" },
              { offset: 1, color: "#19283C" }
            ])
           },

           label: {
            show: true,
            formatter: "{c}%",
            position: "outside",
            color: "#FFFFFF"
          },


        },


      ]
    };

    var myColor =   ["#496EE6", "#7FD359", "#FFC832", "#F27475", "#17D9FF", "#C0DF3E", "#1FC5B6", "#1D98E5", "#17A966", "#FF7B32"];

    this.BarOption2 = {

      title: {
        text: '箱体月出租率',
        textStyle:{
          color: '#FFFFFF'
        },
      },
      tooltip: {
        trigger: 'axis',
        axisPointer: {
          type: 'shadow'
        }
      },
      // legend: {},
      grid: {
        left: '3%',
        right: '4%',
        bottom: '3%',
        containLabel: true
      },
      xAxis: {
        type: 'value',
        boundaryGap: [0, 0.01],

          show: true,
          data: [
            '0', '20', '40', '60', '80', '100',
        ],
      },
      yAxis: {
        type: 'category',
        data: ['一月', '二月', '三月', '四月', '五月', '六月', '七月', '八月', '九月', '十月','十一月','十二月'],
        axisLabel: {

          color: "#FFFFFF"
        },
        inverse: true,
      },
      series: [
        {
          name: '2011',
          type: 'bar',
          data: [
            18, 23, 24, 17, 13, 15,14, 18, 19, 25,15, 19, 23,
          ],
          // 修改第一组柱子的圆角
        itemStyle: {
          barBorderRadius: 20,
          // 此时的color 可以修改柱子的颜色
           // // 填充色渐变
           color: new echarts.graphic.LinearGradient(1, 0, 0, 0, [
            { offset: 0, color: "#60227C" },
            { offset: 0.5, color: "#60227C" },
            { offset: 1, color: "#19283C" }
          ])
        },
        // 柱子之间的距离
        barCategoryGap: 50,
        //柱子的宽度
        barWidth: 10,
        // 显示柱子内的文字
        label: {
          show: true,
          position: "right",
          // {c} 会自动的解析为 数据  data里面的数据
          formatter: "{c}%",
          color: "#FFFFFF"
        },

        }
      ]
    };


【推荐】国内首个AI IDE,深度理解中文开发场景,立即下载体验Trae
【推荐】编程新体验,更懂你的AI,立即体验豆包MarsCode编程助手
【推荐】抖音旗下AI助手豆包,你的智能百科全书,全免费不限次数
【推荐】轻量又高性能的 SSH 工具 IShell:AI 加持,快人一步
· 10年+ .NET Coder 心语 ── 封装的思维:从隐藏、稳定开始理解其本质意义
· 地球OL攻略 —— 某应届生求职总结
· 提示词工程——AI应用必不可少的技术
· Open-Sora 2.0 重磅开源!
· 周边上新:园子的第一款马克杯温暖上架
2019-04-18 Redis 学习笔记(十二)Redis 复制功能详解 ----- (error) READONLY You can't write against a read only slave