MeteoInfoLab脚本示例:MODIS AOD
MODIS的气溶胶光学厚度(AOD)产品应用很广,数据可以在Giovanni上下载:http://disc.sci.gsfc.nasa.gov/giovanni/overview/index.html。有HDF, netCDF和文本格式,这里示例打开netCDF格式数据,提取AOD数据并绘图。
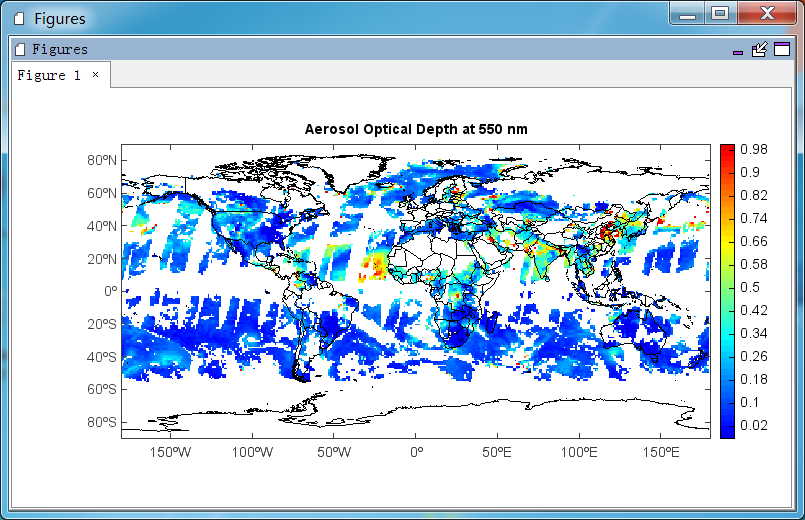
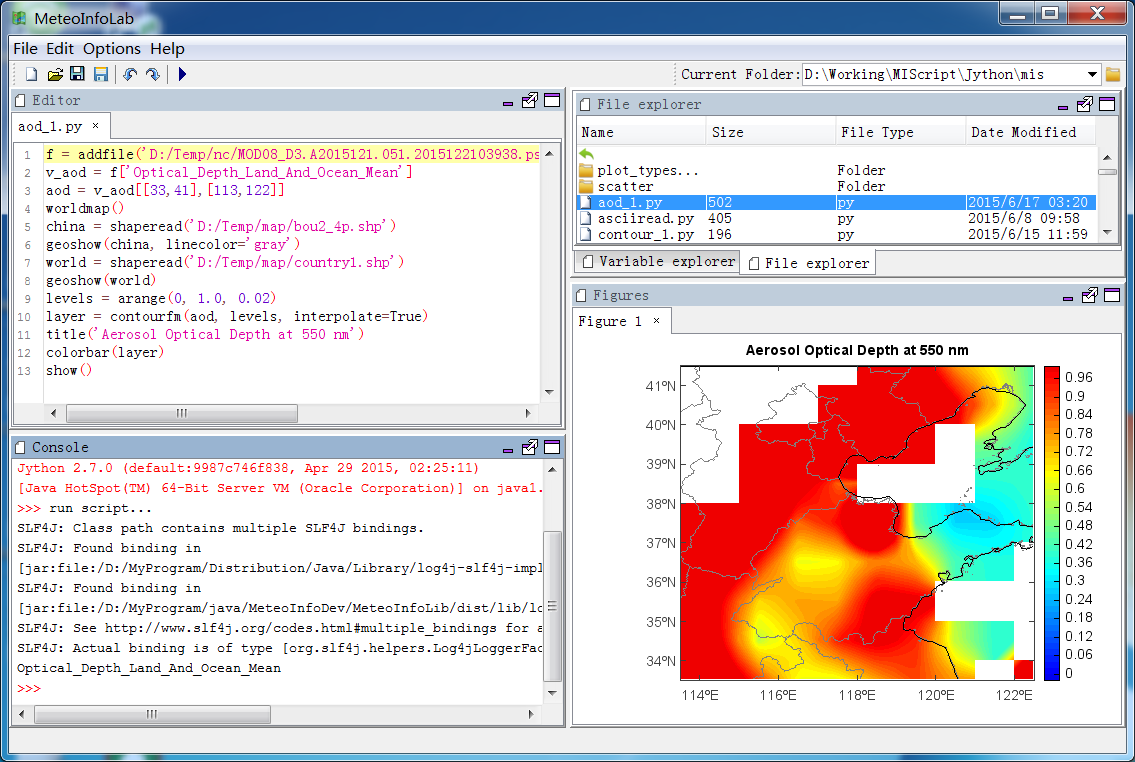
脚本程序如下:
f = addfile('D:/Temp/nc/MOD08_D3.A2015121.051.2015122103938.pscs_000500931513.Optical_Depth_Land_And_Ocean_Mean.G3.nc')
v_aod = f['Optical_Depth_Land_And_Ocean_Mean']
aod = v_aod[[33,41],[113,122]]
axesm()
china = shaperead('D:/Temp/map/bou2_4p.shp')
geoshow(china, linecolor='gray')
world = shaperead('D:/Temp/map/country1.shp')
geoshow(world)
levels = arange(0, 1.0, 0.02)
layer = contourfm(aod, levels, interpolate=True)
title('Aerosol Optical Depth at 550 nm')
colorbar(layer)
show()
要和网站上的图形一致的话需要在等值线追踪前将格点数据插值成2倍的分辨率(layer = contourfm(aod, levels, interpolate=True))。
HDF格式数据文件中的经纬度维有问题,需要在脚本中指定,示例如下:
f = addfile('D:/Temp/hdf/MOD08_D3.A2015121.051.2015122103938.pscs_000500931513.Optical_Depth_Land_And_Ocean_Mean.G3.hdf')
v_aod = f['Optical_Depth_Land_And_Ocean_Mean']
#Set x/y
x = linspace(-180.0,180.0, 360)
y = linspace(-90.0,90.0, 180)
#Set x/y dimensions
v_aod.setdim('Y', y)
v_aod.setdim('X', x)
#Get data
aod = v_aod[[33,41],[113,122]]
#Plot
axesm()
china = shaperead('D:/Temp/map/bou2_4p.shp')
geoshow(china, linecolor='gray')
world = shaperead('D:/Temp/map/country1.shp')
geoshow(world)
levels = arange(0, 1.0, 0.02)
layer = contourfm(aod, levels, interpolate=True)
title('Aerosol Optical Depth at 550 nm')
colorbar(layer)
show()


 浙公网安备 33010602011771号