


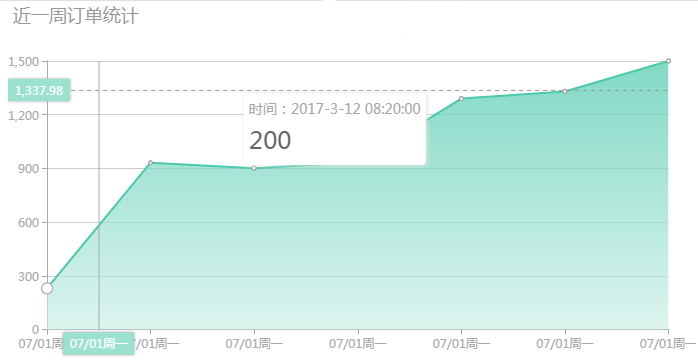
echarts 折线层叠图
折线层叠图
- 引用echarts.js和jquery
<script type="text/javascript" src="../../js/jquery-1.10.1.min.js"></script>
<script type="text/javascript" src="js/echarts.js" ></script>
- 在需要应用图表的地方加入一下内容
<div id="container1" style="width:100%;height:363px"></div>
- js部分
var myChart = echarts.init(document.getElementById("container1"));
	var option2 = {
		title: {
			text: '近一周订单统计',
			textStyle: {
				fontWeight: 'normal', 标提是否加粗
				color: '#999999'//标提颜色
			},
		},
		tooltip: { //悬停显示的内容
			trigger: 'axis',
			textStyle: {
				align: 'left'
			},
			backgroundColor: 'rgb(255,255,255)',//悬停背景色
			extraCssText: 'box-shadow:1px 0 5px rgb(226,226,226)',//悬停阴影
			formatter: function(params) {//悬停展示内容
				var res = "<div class='coordinate'><p>时间:2017-3-12 08:20:00</p><p>200<p></div>"
				return res
			},
			axisPointer: {
				type: 'cross',//指示线
				label: {
					backgroundColor: '#9ae1d0'//背景颜色
				}
			}

		},
		grid: {//图表相对左右上下的距离  表显示位置
			left: '0',
			right: '4%',
			bottom: '4%',
			containLabel: true
		},
		xAxis: [{
			type: 'category',
			boundaryGap: false,
			axisLine: {
				lineStyle: {
					color: '#a9a9a9' //x坐标线颜色
				}
			},
			data: ['07/01周一', '07/01周一', '07/01周一', '07/01周一', '07/01周一', '07/01周一', '07/01周一']
		}],
		yAxis: [{
			type: 'value',
			axisLine: {
				lineStyle: {
					color: '#a9a9a9' //y坐标线颜色
				}
			}
		}],
		series: [{
			type: 'line',
			stack: '总量',
			color: '#4bc9ab',
			lineStyle: { //修改折线颜色
				normal: {
					color: '#4bc9ab'
				}
			},
			areaStyle: {
				normal: {
					color: new echarts.graphic.LinearGradient(0, 0, 0, 1, [{ //设置背景渐变颜色
						offset: 0,
						color: '#4bc9ab'
					}, {
						offset: 1,
						color: '#cef0e8'
					}]),
					shadowColor: 'rgba(0, 0, 0, 0.4)'
				}
			},
                       itemStyle:{
                           normal:{
                    color:"#01FFFF"//拐点颜色
                  }
                       },

			data: [230, 932, 901, 934, 1290, 1330, 1500]
		}]
	};
	// 使用刚指定的配置项和数据显示图表。
	myChart.setOption(option2);
- js部分
- 效果展示
用 无 所 谓 的 态 度 过 好 随 遇 而 安 的 生 活↗☆
