

|NO.Z.00323|——————————|CloudNative|——|KuberNetes&运维.V41|——|白盒监控.v03|etcd.v03|Prometheus获取etcd集群数据|
一、查看Prometheus是否获取etcd集群监控数据
### --- 查看Prometheus是否获取etcd集群监控数据

~~~     通过Prometheus查看etcd节点是否获取到数据:http://prom.test.com/targets
~~~     ——>status——>targets——>查看——>获取数据成功——>END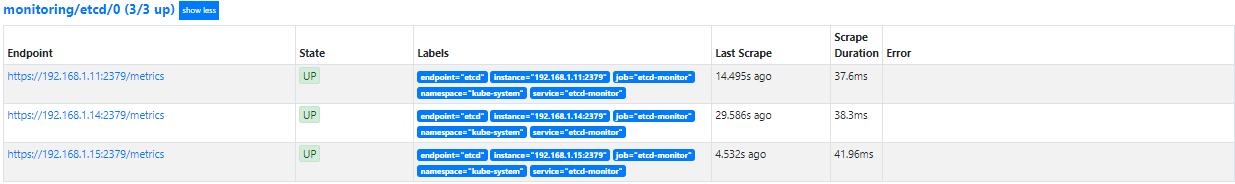
二、grafana模板导入
### --- grafana模板导入
~~~     数据采集完成后,接下来在grafana中导入dashboard
~~~     # etcd-grafana-dashboard模板地址:
~~~     # grafana官网:
~~~     https://grafana.com/grafana/dashboards/3070
~~~ # 中文版ETCD集群插件:
~~~ https://grafana.com/grafana/dashboards/9733
~~~ # 下载JSON文件
~~~ 导入grafana:http://grafana.test.com/——>加号:Import——>Upload.json file
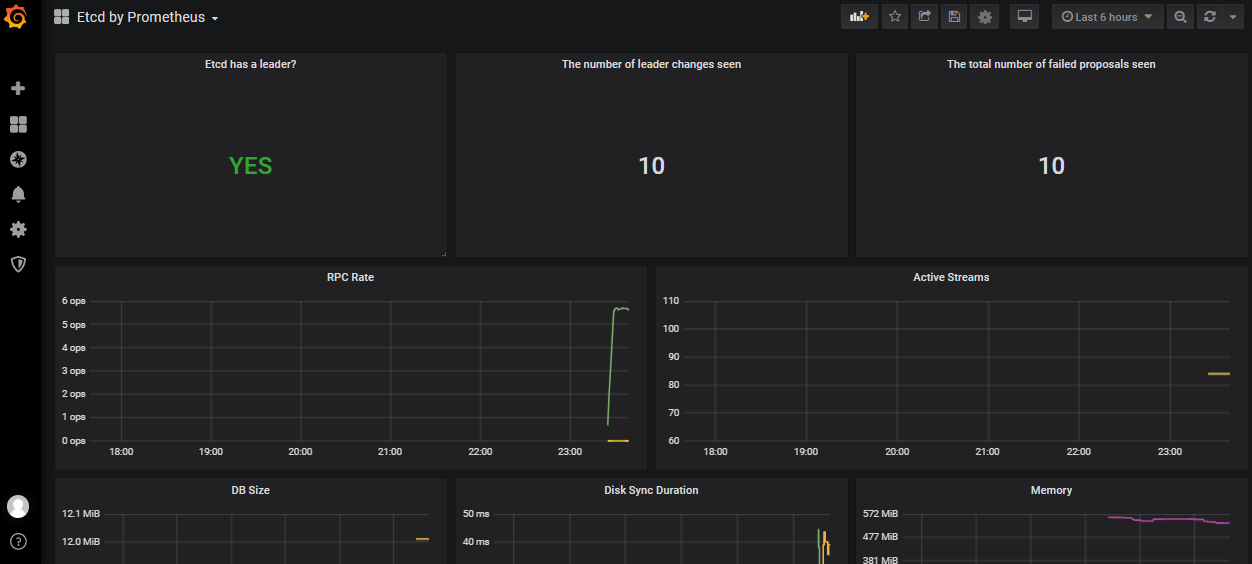
~~~ ——>Options:参数可以自己定义——>data source:Prometheus——>Import——>END三、ETCD英文模板
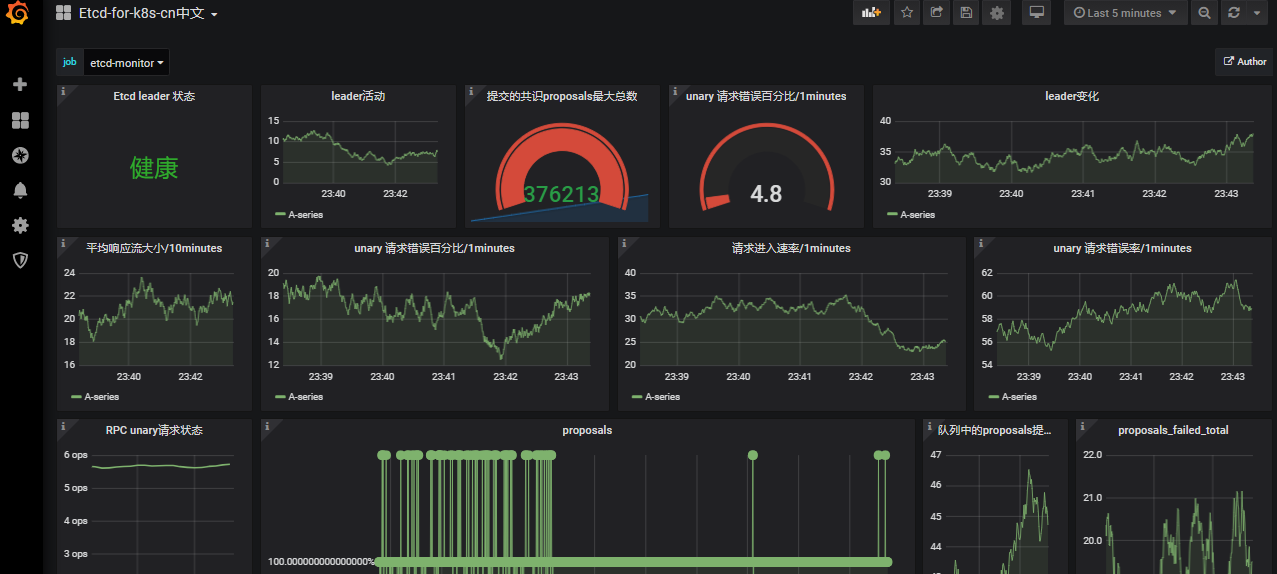
四、ETCD中文模板
Walter Savage Landor:strove with none,for none was worth my strife.Nature I loved and, next to Nature, Art:I warm'd both hands before the fire of life.It sinks, and I am ready to depart
——W.S.Landor


【推荐】国内首个AI IDE,深度理解中文开发场景,立即下载体验Trae
【推荐】编程新体验,更懂你的AI,立即体验豆包MarsCode编程助手
【推荐】抖音旗下AI助手豆包,你的智能百科全书,全免费不限次数
【推荐】轻量又高性能的 SSH 工具 IShell:AI 加持,快人一步
· 无需6万激活码!GitHub神秘组织3小时极速复刻Manus,手把手教你使用OpenManus搭建本
· Manus爆火,是硬核还是营销?
· 终于写完轮子一部分:tcp代理 了,记录一下
· 别再用vector<bool>了!Google高级工程师:这可能是STL最大的设计失误
· 单元测试从入门到精通