

|NO.Z.00025|——————————|^^ 部署 ^^|——|Kubernetes&集群监控.V01|——|Prometheus&Grafana|
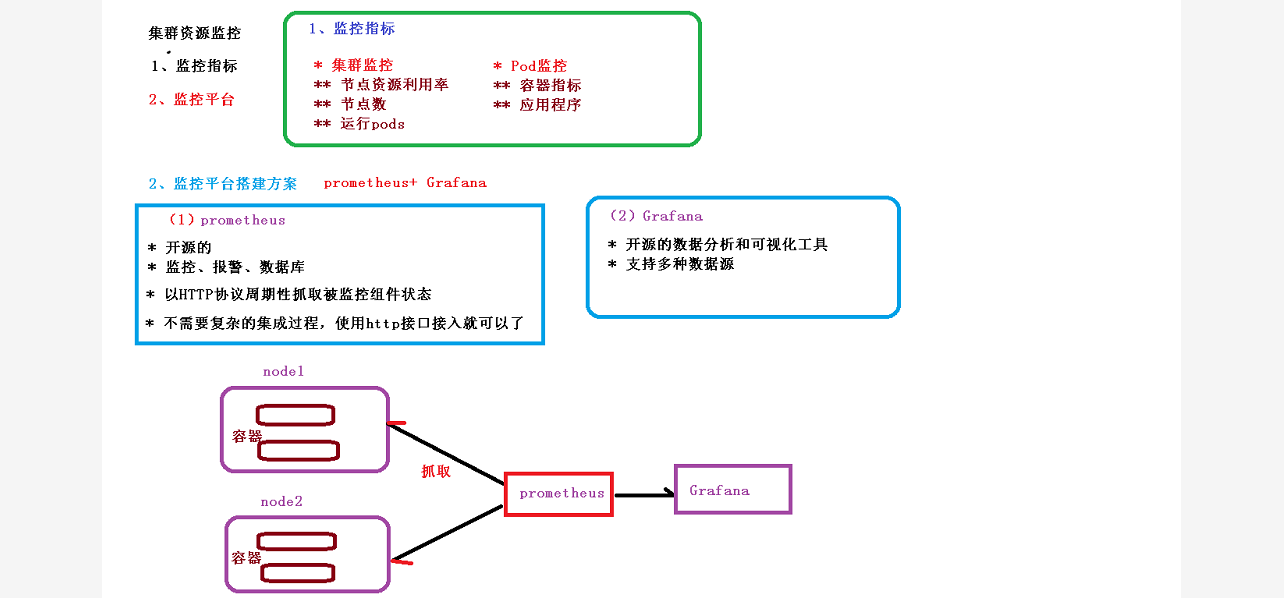
一、集群资源监控-监控品台搭建
二、实验环境部署
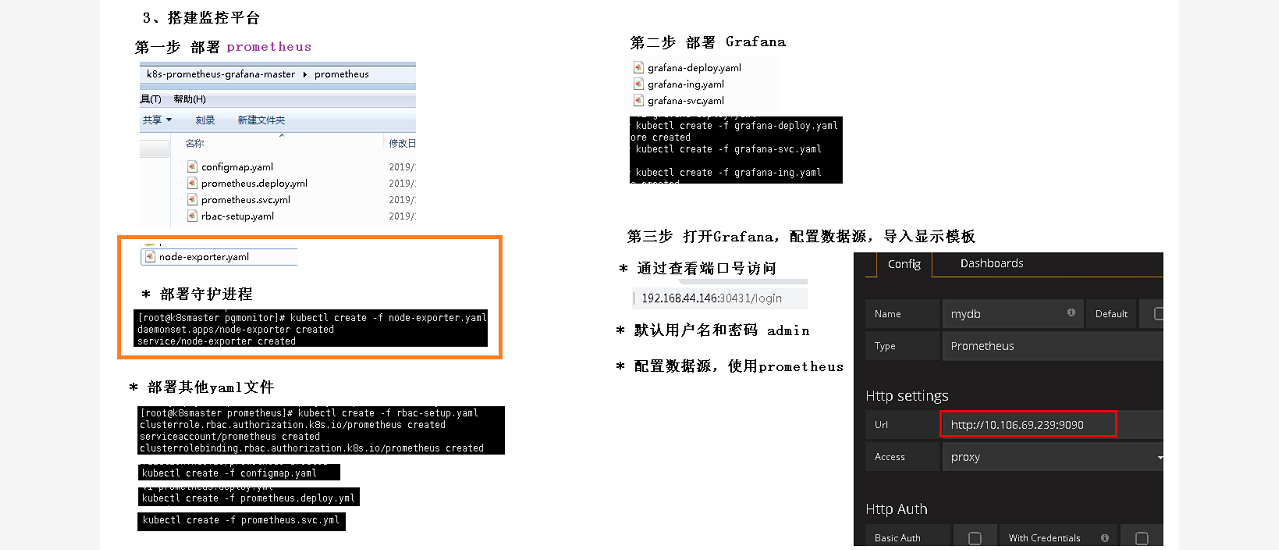
### --- 准备:下载下列文件并上传至服务器
~~~		configmap.yaml:存储相关的配置文件的存储
~~~		prometheus.deploy.yml:资源限制,端口号等信息点
~~~		prometheus.svc.yml:对外暴露端口,进行外部访问
~~~		rbac-setup.yaml:分配访问权限
~~~		node-exporter.yaml:部署一个守护进程,

[root@k8s-master ~]# ls
三、部署守护进程
### --- 部署守护进程

[root@k8s-master ~]# vim node-exporter.yaml

---
apiVersion: apps/v1                                     # 改一下版本
kind: DaemonSet
metadata:
  name: node-exporter
  namespace: kube-system
  labels:
    k8s-app: node-exporter
spec:
  selector:                                             # 添加这个模块
    matchLabels:
      k8s-app: node-exporter
  template:
    metadata:
      labels:
        k8s-app: node-exporter
    spec:
      containers:
      - image: prom/node-exporter
        name: node-exporter
        ports:
        - containerPort: 9100
          protocol: TCP
          name: http
---
apiVersion: v1
kind: Service
metadata:
  labels:
    k8s-app: node-exporter
  name: node-exporter
  namespace: kube-system
spec:
  ports:
  - name: http
    port: 9100
    nodePort: 31672
    protocol: TCP
  type: NodePort
  selector:
    k8s-app: node-exporter
~~~ 创建执行
[root@k8s-master ~]# kubectl create -f node-exporter.yaml
daemonset.apps/node-exporter created
service/node-exporter created~~~ 删除操作,不执行
[root@k8s-master ~]# kubectl delete -f node-exporter.yaml
daemonset.apps "node-exporter" deleted
service "node-exporter" deleted ### --- 部署其它的yaml文件
~~~ 部署rbac
[root@k8s-master ~]# kubectl create -f rbac-setup.yaml
clusterrole.rbac.authorization.k8s.io/prometheus created
serviceaccount/prometheus created
clusterrolebinding.rbac.authorization.k8s.io/prometheus created~~~ 部署configmap
[root@k8s-master ~]# kubectl create -f configmap.yaml
configmap/prometheus-config created四、部署prometheus
### --- 部署deployment

[root@k8s-master ~]# vim prometheus.deploy.yml

---
apiVersion: apps/v1                             # 更改版本
kind: Deployment
metadata:
  labels:
    name: prometheus-deployment
  name: prometheus
  namespace: kube-system
spec:
  replicas: 1
  selector:
    matchLabels:
      app: prometheus
  template:
    metadata:
      labels:
        app: prometheus
    spec:
      containers:
      - image: prom/prometheus:v2.0.0
        name: prometheus
        command:
        - "/bin/prometheus"
        args:
        - "--config.file=/etc/prometheus/prometheus.yml"
        - "--storage.tsdb.path=/prometheus"
        - "--storage.tsdb.retention=24h"
        ports:
        - containerPort: 9090
          protocol: TCP
        volumeMounts:
        - mountPath: "/prometheus"
          name: data
        - mountPath: "/etc/prometheus"
          name: config-volume
        resources:
          requests:
            cpu: 100m
            memory: 100Mi
          limits:
            cpu: 500m
            memory: 2500Mi
      serviceAccountName: prometheus
      volumes:
      - name: data
        emptyDir: {}
      - name: config-volume
        configMap:
          name: prometheus-config
~~~ 部署pod
[root@k8s-master ~]# kubectl create -f prometheus.deploy.yml
deployment.apps/prometheus created
~~~ 部署svc
[root@k8s-master ~]# kubectl create -f prometheus.svc.yml
service/prometheus created### --- 查看部署结果
[root@k8s-master ~]# kubectl get pods -n kube-system
prometheus-7486bf7f4b-88rvn 1/1 Running 0 92s五、部署grafana
### --- 部署grafana:将下列文件上传至服务器
~~~		grafana-deploy.yaml:部署deploy应用
~~~		grafana-ing.yaml:对外暴露的端口
~~~		grafana-svc.yaml:对外暴露的端口

[root@k8s-master ~]# ls
### --- 部署grafana-deploy
[root@k8s-master ~]# vim grafana-deploy.yaml
apiVersion: apps/v1
kind: Deployment
metadata:
name: grafana-core
namespace: kube-system
labels:
app: grafana
component: core
spec:
replicas: 1
selector:
matchLabels:
app: grafana
component: core
template:
metadata:
labels:
app: grafana
component: core
spec:
containers:
- image: grafana/grafana:4.2.0
name: grafana-core
imagePullPolicy: IfNotPresent
# env:
resources:
# keep request = limit to keep this container in guaranteed class
limits:
cpu: 100m
memory: 100Mi
requests:
cpu: 100m
memory: 100Mi
env:
# The following env variables set up basic auth twith the default admin user and admin password.
- name: GF_AUTH_BASIC_ENABLED
value: "true"
- name: GF_AUTH_ANONYMOUS_ENABLED
value: "false"
# - name: GF_AUTH_ANONYMOUS_ORG_ROLE
# value: Admin
# does not really work, because of template variables in exported dashboards:
# - name: GF_DASHBOARDS_JSON_ENABLED
# value: "true"
readinessProbe:
httpGet:
path: /login
port: 3000
# initialDelaySeconds: 30
# timeoutSeconds: 1
volumeMounts:
- name: grafana-persistent-storage
mountPath: /var
volumes:
- name: grafana-persistent-storage
emptyDir: {}~~~ 部署grafana.pod
[root@k8s-master ~]# kubectl create -f grafana-deploy.yaml
deployment.apps/grafana-core created### --- 部署grafana-svc.yaml
[root@k8s-master ~]# kubectl create -f grafana-svc.yaml
service/grafana created
~~~ 部署grafana-ing.yaml
[root@k8s-master ~]# kubectl create -f grafana-ing.yaml
ingress.extensions/grafana created ### --- 查看
[root@k8s-master ~]# kubectl get pods -n kube-system
grafana-core-768b6bf79c-d4t6w 1/1 Running 0 73s
prometheus-7486bf7f4b-88rvn 1/1 Running 0 9m5s### --- 打开Grafana,配置数据源,导入显示模板
[root@k8s-master ~]# kubectl get svc -n kube-system -o wide
grafana NodePort 10.106.119.250 <none> 3000:30831/TCP 21s app=grafana,component=core
prometheus NodePort 10.111.81.144 <none> 9090:30003/TCP 48s app=prometheus六、grafana初始化配置
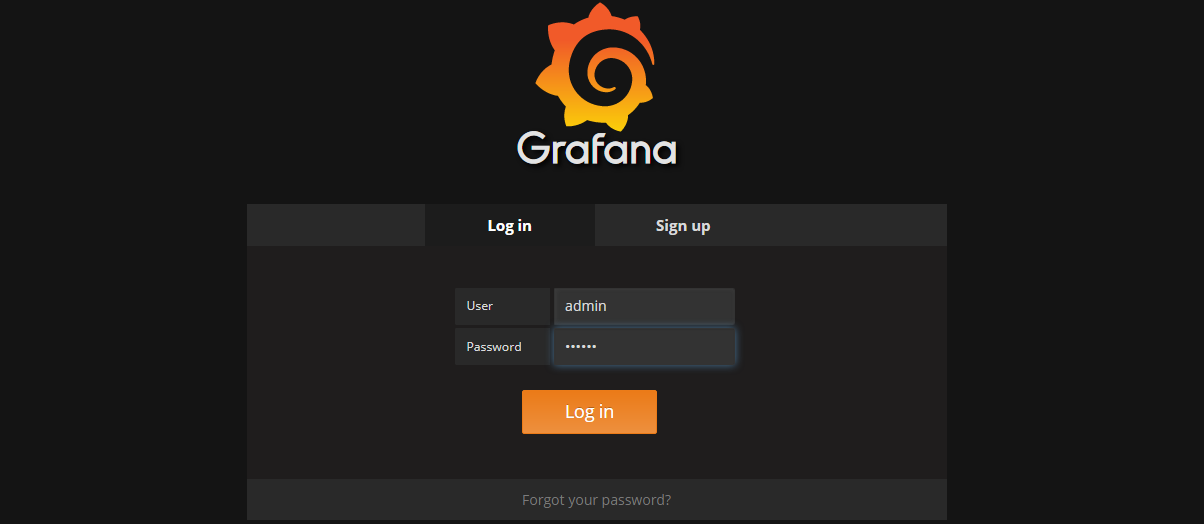
### --- grafana初始化配置

~~~		通过Chrome访问:http://10.10.10.12:30831/login
~~~		# OR :http://10.10.10.13:32106/login
~~~		用户名:admin;密码:admin(图一)
### --- 添加初始配置(图二)
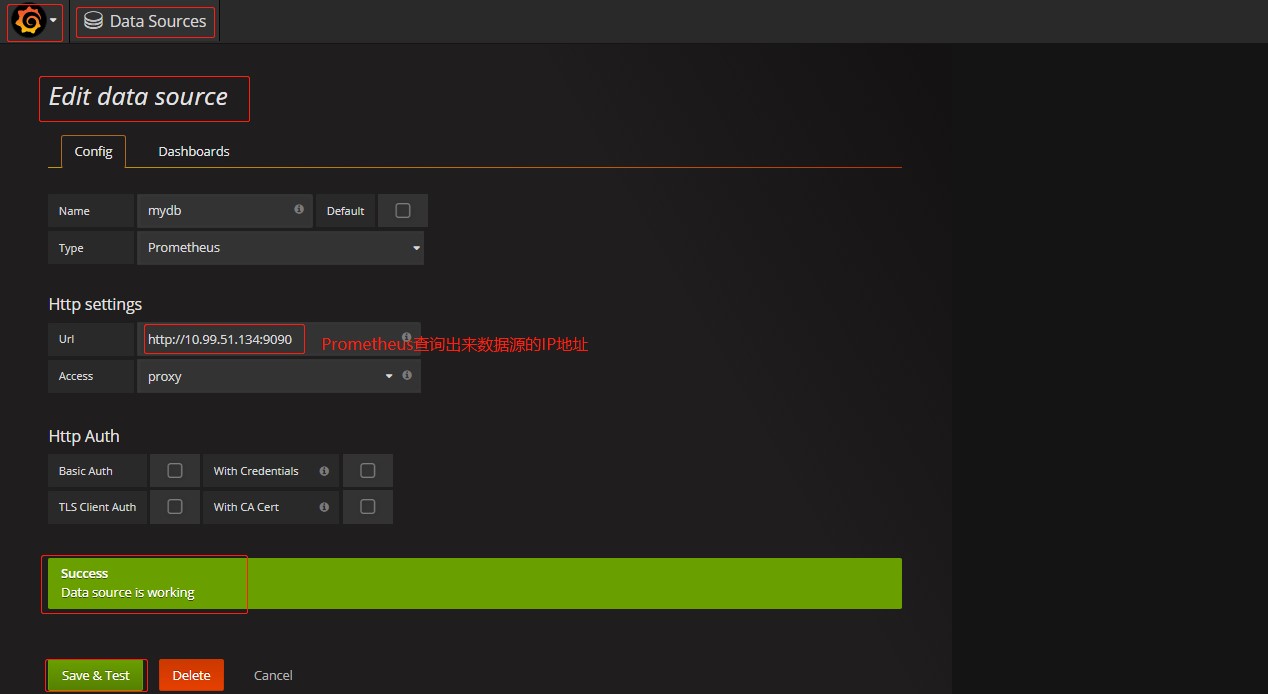
~~~ 初始图标——>Data Sources——>Add data source:Name: mydb;
~~~ Type:prometheus;Url:http://10.111.81.144:9090:查看到prometheus的ip地址——>END### --- 显示数据的模板
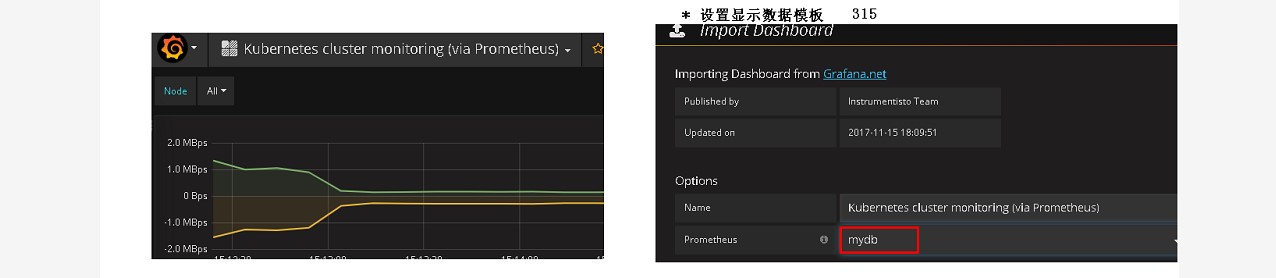
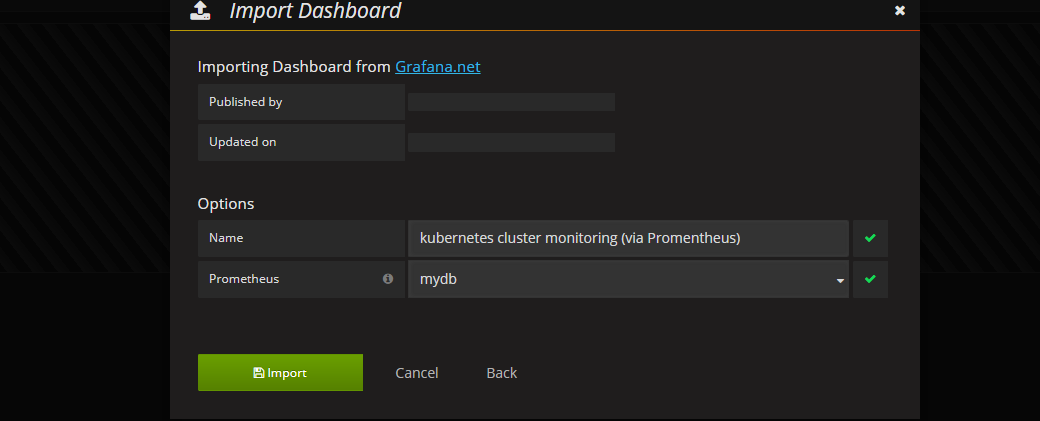
~~~ 初始图标——>Dashboards——>Import——>Grafana.netDashboard:315(固定值)
~~~ ——>Load——>Name:kubernetes cluster monitoring (via Promentheus)可以更改
~~~ ——>Import——>Prometheus:mydb(刚才创建的数据源)——>Import——>END
~~~ 若是ID导入失败可在官网下载*.json文件导入
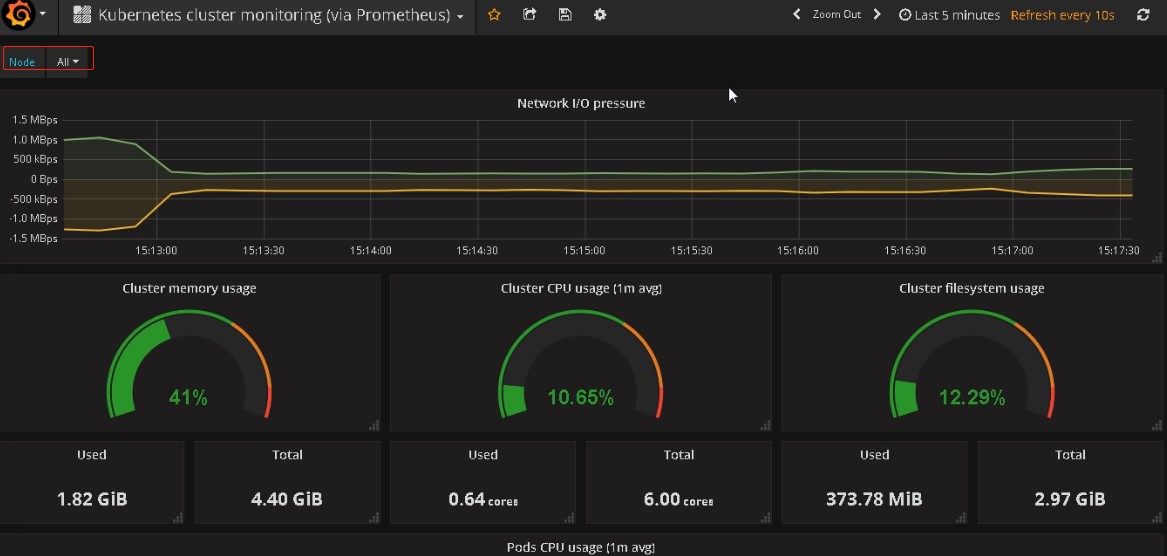
~~~ 官网地址:https://grafana.com/grafana/dashboards/1860?pg=dashboards&plcmt=featured-sub1grafana初始界面

Walter Savage Landor:strove with none,for none was worth my strife.Nature I loved and, next to Nature, Art:I warm'd both hands before the fire of life.It sinks, and I am ready to depart
——W.S.Landor


【推荐】国内首个AI IDE,深度理解中文开发场景,立即下载体验Trae
【推荐】编程新体验,更懂你的AI,立即体验豆包MarsCode编程助手
【推荐】抖音旗下AI助手豆包,你的智能百科全书,全免费不限次数
【推荐】轻量又高性能的 SSH 工具 IShell:AI 加持,快人一步
· 无需6万激活码!GitHub神秘组织3小时极速复刻Manus,手把手教你使用OpenManus搭建本
· Manus爆火,是硬核还是营销?
· 终于写完轮子一部分:tcp代理 了,记录一下
· 别再用vector<bool>了!Google高级工程师:这可能是STL最大的设计失误
· 单元测试从入门到精通