

|NO.Z.00033|——————————|^^ 构建 ^^|——|Cacti构建.V3|——|2台server|
一、cacti.客户端构建.实验专题
1、客户端配置
### --- 在HA-server2:10.10.10.12下配置
### --- 安装SNMP主板信息监控所需软件包

[root@server12 ~]# yum install -y net-snmp net-snmp-utils lm_sensors                 //安装SNMP主板信息监控所需软件包
Install       3 Package(s)                                                          //构建的是SNMP的服务器端
Total download size: 608 k
Installed size: 1.5 M
  lm_sensors.x86_64 0:3.1.1-17.el6                      net-snmp.x86_64 1:5.5-57.el6                      net-snmp-utils.x86_64 1:5.5-57.el6

[root@server12 ~]# vim /etc/snmp/snmpd.conf
com2sec notConfigUser  default       public123                              //41   //服务器地址,默认为defatlt共同体名称,默认为public,为了掩饰效果,改为public123
view all    included  .1      80                                            //62   //放行所有的视图:开放所有的SNMP查询权限,all默认为SystemView
access  notConfigGroup ""      any       noauth    exact  all  none none    //85   //允许服务器过来读。支持各种查询与访问,取消注释符号
### --- 开启SNMP服务,并设置为开机自启
[root@server12 ~]# service snmpd start
[root@server12 ~]# chkconfig snmpd on2、收集数据
### --- 在HA-server1:10.10.10.11下验证
### --- 验证10.10.10.12的tcp连接状态

[root@server11 ~]# snmpwalk -v 2c -c public123 10.10.10.12 tcp              // 可以获取数据
二、cacti.Chrome监控主机配置
1、删除默认的Localhost配置
### --- cacti.Chrome监控主机配置
### --- 通过Chrome访问:http://10.10.10.11/install/                          // 进行配置

~~~ console——>Devices——>Localhost:Delete:Go——>Continue——>END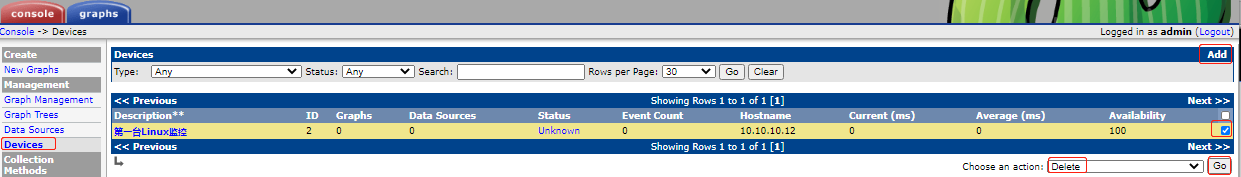 2、创建一个新的监控目标:第一台Linux监控
### --- 创建一个新的监控目标:第一台Linux监控
~~~ console——>Devices——>Add——>Description:第一台Linux监控
~~~ ——>Hostname:10.10.10.12(必须是IP地址或者能被解析的域名)
~~~ ——>Host Template:ucd/net SNMP Host
~~~ ——>Downed Device Detection:SNMP——>Ping Timeout Value:400(ping的超时键值,或者时间)
~~~ ——>Ping Retry Count:1(重复次数)——>SNMP Version:Version1(默认是V1版本)
~~~ ——>SNMP Community:public123(共同体名称:public+123定义的)
~~~ ——>SNMP Port:UDP161——>SNMP Timeout:500(超时时间)
~~~ ——>Maximum OIDS Per Get Request:10(最大的请求次数)——>Create——>END
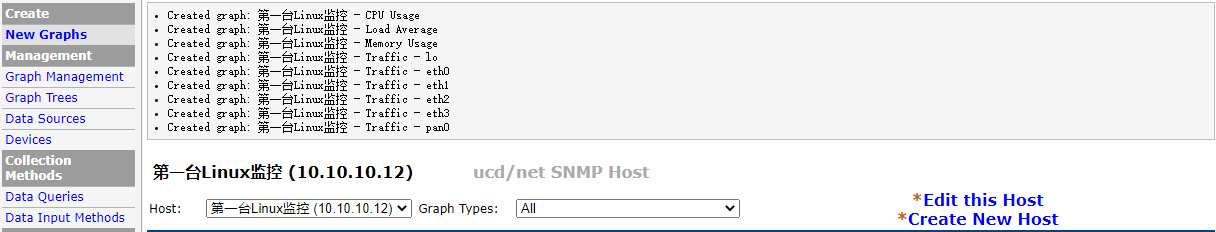
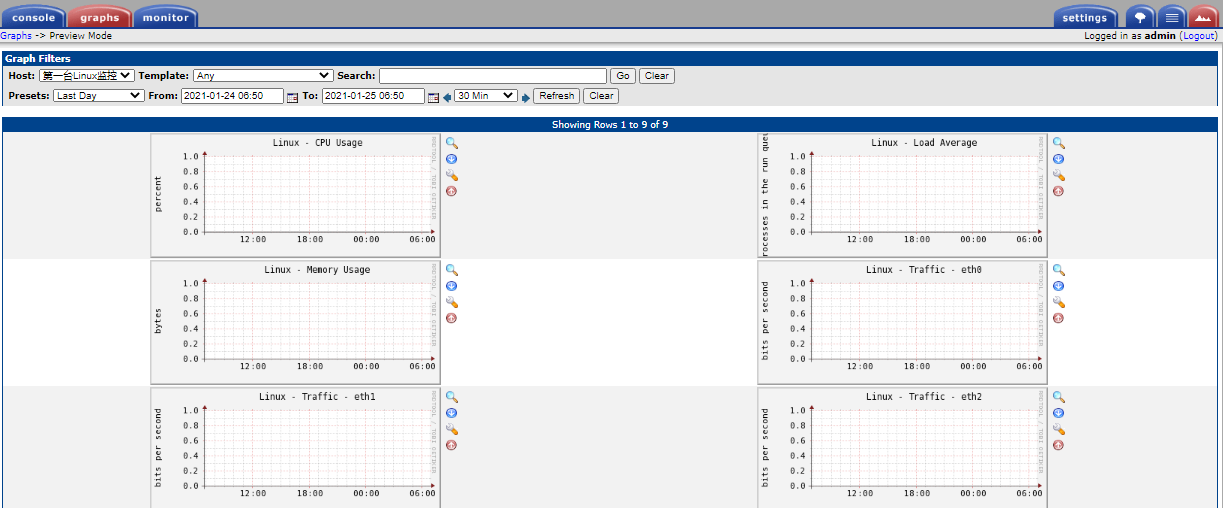
~~~ create:发现Graph依然什么都没有,因为我们需要创建图表,并且把图标挂到图片树里,它才会在Graphs下展示出来。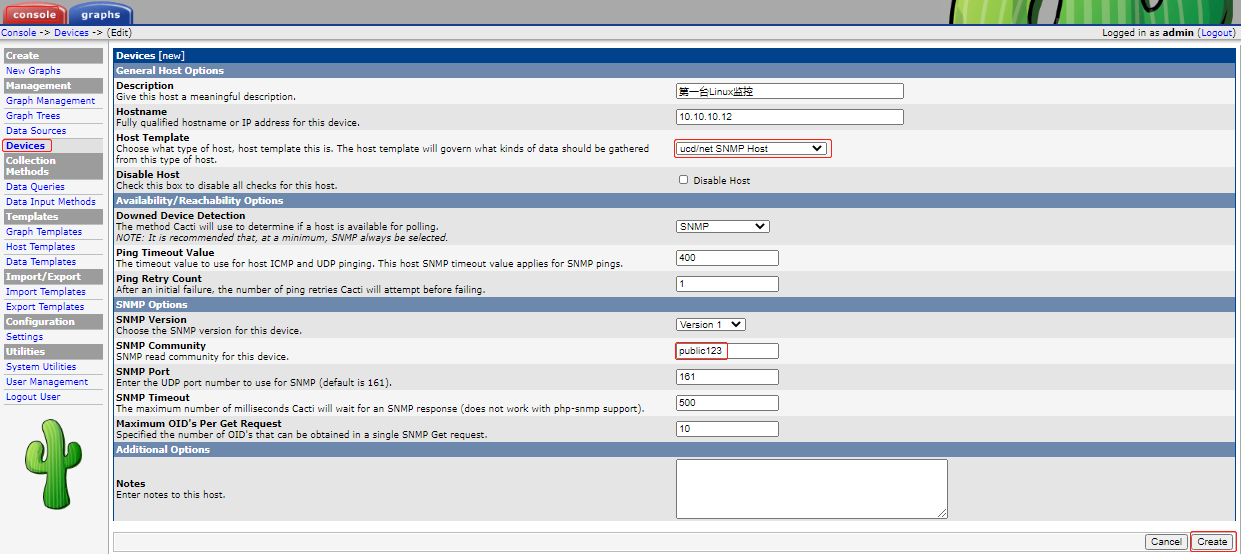
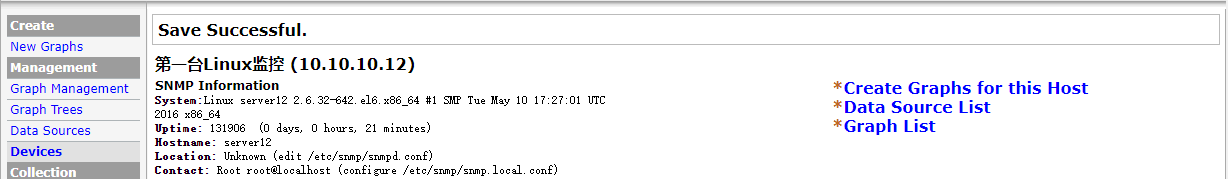
create完成之后会有提示信息
3、创建图像树
### --- 创建图像树

~~~     cons——>Devices——>点击:第一台Linux监控
~~~     ——>SNMP Information:Create  Graphs for this Host
~~~     ——>选中所有:打钩——>Create——END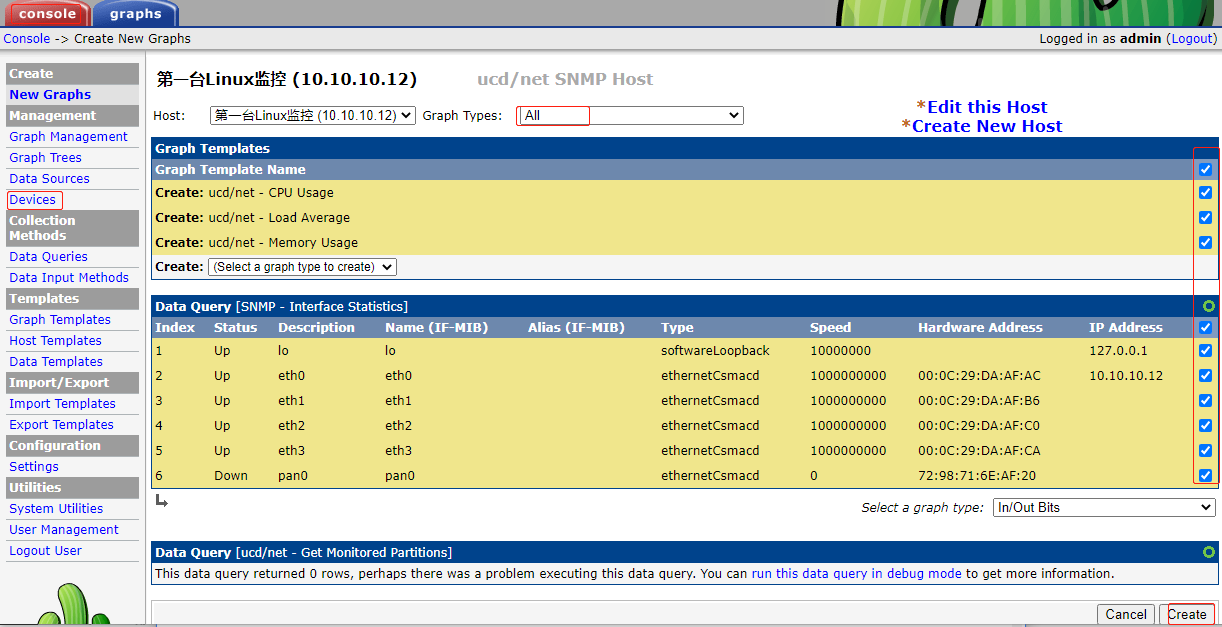
显示对应的图像已设置成功
4、关联图像树
### --- 关联图像树

~~~     console——>Graph Trees——>Default Tree(默认树)
~~~     ——>Add——>Host(通过主机去索引)——>Create——>Save——>Save Successful——>END
~~~     此时graphs下图表还是空的。虽然我们在graphs下监控了图像树,
~~~     也把图像添加到了图像树上,但是RRDtool还没有运行,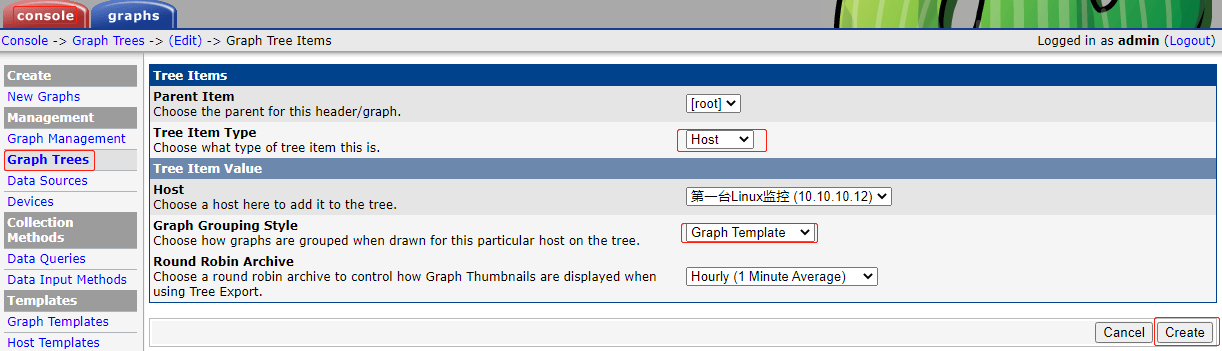
5、运行RRDtool
### --- 在服务器端执行RRDtool运行脚本:

[root@server11 ~]# php /var/www/html/cacti/poller.php                       // 配置RRDTOOL的轮询任务
### --- 执行完成之后,刷新Chrome图标显示出现
### --- 控制图:上面是临时的,若需要长期配置,需要配置一个循环计划任务
[root@server11 ~]# su - runct // 切换到runct用户下
[runct@server11 ~]$ crontab -e
*/5 * * * * /var/www/html/cacti/poller.php &>/dev/null // 循环时间是5分钟一次,因为cacti自刷新时间就是5分钟。设置的够快反而消耗性能,没有什么意义。两边保持同步是最好状态。
[runct@server11 ~]$ service crond restart // 重启一下crond服务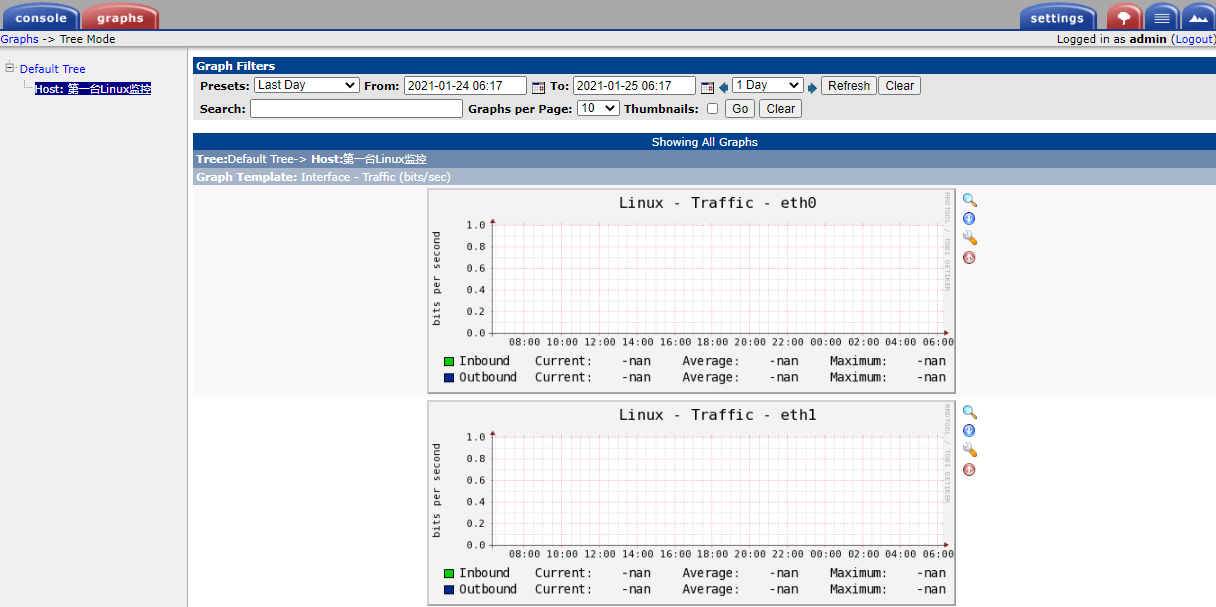
三、cacti插件添加
1、若是想为cacti构建一些其它功能的话,需要添加一些插件,插件是由插件管理器管理的。
### --- 部署插件管理器

[root@server11 ~]# cd cacti-plugin/
[root@server11 cacti-plugin]# tar -zxvf cacti-plugin-0.8.7g-PA-v2.8.tar.gz
[root@server11 cacti-plugin]# cd cacti-plugin-arch/
[root@server11 cacti-plugin-arch]# pwd
/root/cacti-plugin/cacti-plugin-arch
### --- 还原数据库
[root@server11 cacti-plugin-arch]# mysql -uroot -p cactidb < pa.sql
Enter password: 123### --- 打一下补丁
~~~ 打完补丁之后console下还是没有任何变化,因为我们需要开启插件管理器的选项。
~~~ ——>Utilities——>User Management——>admin
~~~ ——>Realm Permissions:Plugin Management:打钩
~~~ ——>Save——>Save Successful——>END
~~~ ——>发现:Configuration:Plugin Management(多出来的)
~~~ ——>NO Plugins Found:空的——>插件构建完成——>END
[root@server11 cacti-plugin-arch]# cd /var/www/html/cacti
[root@server11 cacti]# patch -p1 -N < /root/cacti-plugin/cacti-plugin-arch/cacti-plugin-0.8.7g-PA-v2.8.diff2、构建容易出效果的插件:monitor
### --- 构建monitor插件

[root@server11 ~]# cd cacti-plugin/
[root@server11 cacti-plugin]# tar -zxvf monitor-0.8.2.tar.gz
### --- 还原数据库
[root@server11 cacti-plugin]# mv monitor /var/www/html/cacti/plugins
[root@server11 cacti-plugin]# cd !$
cd /var/www/html/cacti/plugins
[root@server11 plugins]# cd monitor/
[root@server11 monitor]# mysql -uroot -p cactidb < monitor.sql // 遇到sql文件还原,常规操作
Enter password: ### --- 验证:console——>Plugin Management——>刷新:Monitor(多了一个插件管理器)
### --- ——>电它一下:在console/graphs/后面多了一个monitor插件
### --- ——>若有多台主机的话就会以主机的形式展现出来,更便于调取主机监控——>END
~~~ 绿色:表示正常;
~~~ 红色:表示连接中断。——>点击一下主机图像——>会有检测图表展现页面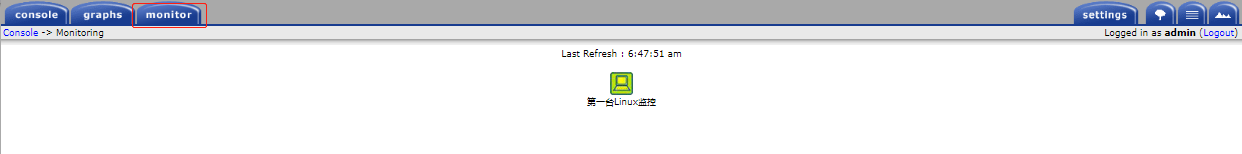
Walter Savage Landor:strove with none,for none was worth my strife.Nature I loved and, next to Nature, Art:I warm'd both hands before the fire of life.It sinks, and I am ready to depart
——W.S.Landor
分类:
cdv001-lbchac


【推荐】国内首个AI IDE,深度理解中文开发场景,立即下载体验Trae
【推荐】编程新体验,更懂你的AI,立即体验豆包MarsCode编程助手
【推荐】抖音旗下AI助手豆包,你的智能百科全书,全免费不限次数
【推荐】轻量又高性能的 SSH 工具 IShell:AI 加持,快人一步
· 无需6万激活码!GitHub神秘组织3小时极速复刻Manus,手把手教你使用OpenManus搭建本
· Manus爆火,是硬核还是营销?
· 终于写完轮子一部分:tcp代理 了,记录一下
· 别再用vector<bool>了!Google高级工程师:这可能是STL最大的设计失误
· 单元测试从入门到精通