

prometheus监控nginx
1.编译nginx加载vts模块
2.配置nginx加载vts模块
3.配置prometheus监控nginx
4.granfna展示数据
==================================================================
1.编译nginx加载vts模块
1.1.下载vts
cd /opt
git clone https://github.com/vozlt/nginx-module-vts.git
1.2.编译nginx
./configure  --prefix=/app/nginx-1.22.1  \
--user=www \
--group=www \
--with-compat \
--with-file-aio \
--with-threads  \
--with-http_addition_module \
--with-http_auth_request_module \
--with-http_dav_module  \
--with-http_flv_module  \
--with-http_gunzip_module \
--with-http_gzip_static_module \
--with-http_mp4_module  \
--with-http_random_index_module \
--with-http_realip_module  \
--with-http_secure_link_module \
--with-http_slice_module  \
--with-http_ssl_module  \
--with-http_stub_status_module \
--with-http_sub_module  \
--with-http_v2_module  \
--with-mail  \
--with-mail_ssl_module  \
--with-stream  \
--with-stream_realip_module \
--with-stream_ssl_module   \
--with-stream_ssl_preread_module \
--add-module=/opt/nginx-module-vts/
2.配置nginx加载vts模块
http {
.............
vhost_traffic_status_zone;
vhost_traffic_status_filter_by_host on;
server {
...........
location /status {
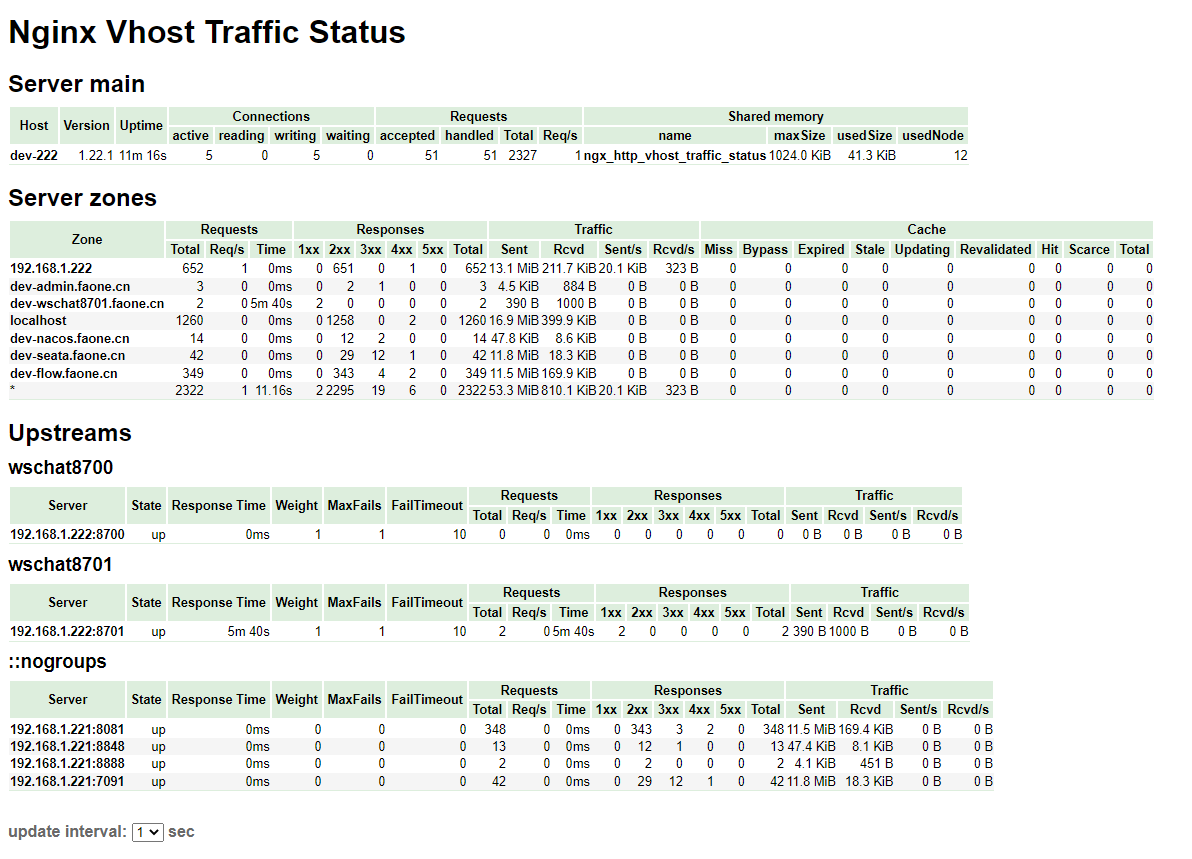
vhost_traffic_status_display;
vhost_traffic_status_display_format html;
}
}
配置解释
1、vhost_traffic_status_zone; 是必填项
2、vhost_traffic_status_filter_by_host on; 即打开vhost过滤,开启此功能,在nginx配置有多个server_name的情况下会根据不同的server_name进行流量的统计,否则默认会把流量全部计算到第一个server_name上
3、 在不想统计流量的server区域可以使用 vhost_traffic_status off; 禁止
访问状态页
3.配置prometheus
prometheus配置
job信息如下,保证 metrics_path写正确
  - job_name: 'nginx'
    metrics_path: /status/format/prometheus
    static_configs:
    - targets: ['192.168.xxx.xxx:80']
4.granafa-dashboard数据展示
导入9785面板


【推荐】国内首个AI IDE,深度理解中文开发场景,立即下载体验Trae
【推荐】编程新体验,更懂你的AI,立即体验豆包MarsCode编程助手
【推荐】抖音旗下AI助手豆包,你的智能百科全书,全免费不限次数
【推荐】轻量又高性能的 SSH 工具 IShell:AI 加持,快人一步
· 25岁的心里话
· 闲置电脑爆改个人服务器(超详细) #公网映射 #Vmware虚拟网络编辑器
· 基于 Docker 搭建 FRP 内网穿透开源项目(很简单哒)
· 零经验选手,Compose 一天开发一款小游戏!
· 通过 API 将Deepseek响应流式内容输出到前端
2021-03-06 ①linux rpm
2021-03-06 打包命令 tar
2021-03-06 ①打包命令 gzip bz2
2021-03-06 文件查找find