Pytorch 2.3.3 预备知识 matplotlib的基本用法和常识
Matplot基本用法+常识
引用:matplotlib实际上为面向对象的绘图库,它所绘制的每个元素都有一个对象与之对应的。
figure就是一个图啦,axes表示图上的一个画图区域啦,一个图上可以有多个画图区域的啦,意思就是说,一个图上可以有多个子图啊。用函数gcf()与gca()分别得到当前的figure与axes。(get current figure, get current axes).
注意: 要是使用jupyter的话,得用一个内联的东东(插件),使用方法是在引入matplotlib库之后键入
%matplotlib inline
放个代码压压惊先
import matplotlib.pyplot as plt
%matplotlib inline
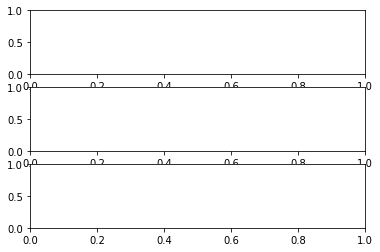
plt.figure(1) #建立figure(1),也就是我们上面说的一个大图,然后用axes划分子区域
ax1 = plt.subplot(3,1,1) #划分[3,1]的图,然后选择第一个,可以理解为三行一列
ax2 = plt.subplot(3,1,2)
ax3 = plt.subplot(3,1,3)
plt.sca(ax1) #切换到子图1
plt.sca(ax2) #切换到子图2
plt.figure(1) #切换到figure(1),它不是重建哦;
先来讲讲理论部分
对于上面的很多很多对象,其实都是Artist对象,Artist对象共分为简单类型和容器类型两种哦。简单的类型是标准的绘图元件,如:line2D, Rectangle, Text, AxesImage等。而容器类型则可以包含许多简单类型的Artist对象,如Figure,Axes,Axis等,用人话讲就是,容器类型的可以一个对象里面含有多个对象,也就是一个figure可以划分成多个子区域,我们常说的axes。
建立一个简单的Artist对象
import matplotlib.pyplot as plt
%matplotlib inline
# 建立一个简单的Artist对象的过程
#figure对象的add_axes()可以在其中创建一个axes对象,
# add_axes()的参数为一个形如[left, bottom, width, height]的列表,取值范围在0与1之间;
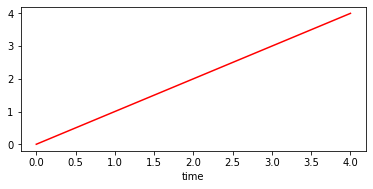
fig = plt.figure(1) #创建一个figure对象 下面的ax1就是figure的子区域
ax1 = fig.add_axes([0.1,0.5,0.8,0.5]) # 我们把它放在了figure图形的上半部分,对应参数分别为:left, bottom, width, height;
ax1.set_xlabel('time')
line = ax1.plot(range(5))[0] #用axes对象的plot()进行绘图,它返回一个Line2D的对象;matplotlib.lines.Line2D
line.set_color('r')
plt.show()
其中,add_axes()里面的列表参数决定了我们这一整个图像的大小,[left, bottom, width, height]都只能够在[0,1]中取值
介绍几个简单的函数 --- First: plot(*args, *kwargs)
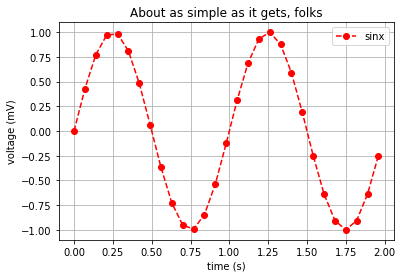
#简单的几个函数 plot(*args, *kwargs)函数,它可以画出很简单线图,基本用法:
import matplotlib.pyplot as plt
import numpy as np

plt.figure(1) #调用figure函数创建figure(1)对象,可以省略,这样那plot时,它就自动建一个啦;
x_axis = np.arange(0.0, 2.0, 0.07)
y = np.sin(2*np.pi*x_axis)
plt.plot(x_axis,y, 'r--o', label = 'sinx')
plt.legend()  #显示右上角的那个label,即上面的label = 'sinx'
plt.xlabel('time (s)')    #设置x轴的label,pyplot模块提供了很直接的方法,内部也是调用的上面当然讲述的面向对象的方式来设置;
plt.ylabel('voltage (mV)')   #设置y轴的label;
#plt.xlim(-1,3)      #可以自己设置x轴的坐标的范围哦;
#plt.ylim(-1.5,1.5)   #同上;

plt.title('About as simple as it gets, folks')
plt.grid(True)   #显示网格;
Second : subplt()
plt.subplots(nrows=1, ncols=1, sharex=False, sharey=False, squeeze=True, subplot_kw=None, **fig_kw)
#作用:创建一个已有subplots的figures;
参数:
      *nrows* : int  ,指创建的sublots的行数,默认为1.

      *ncols* : int  ,指创建的sublots的列数,默认为1.

     *sharex* : 为一个string或bool类型;
        当为Ture时,所有的subpots将要共享x轴,如果它们是上下的关系的话,上面的图的刻度label就没有,只有下面那个图的.
        If a string must be one of "row", "col", "all", or "none".
        "all" has the same effect as *True*, "none" has the same effect
        as *False*.
        If "row", each subplot row will share a X axis.
        If "col", each subplot column will share a X axis and the x tick
        labels on all but the last row will have visible set to *False*.

      *sharey* : 同上

      *squeeze* : bool  它是用来控制返回值的,根据返回的axis的结果决定要不要把没有的维度进行压缩一下.
           当为Ture时,如果返回的axis只有一个,则表示成标量,如果有一行或一列,则表示为一维数组,如果多行多列,则表示为2D数组;
           当为False时,不管多少个返回的axis,都以二维数组的方式返回;
      *subplot_kw* : dict
        Dict with keywords passed to the
        :meth:`~matplotlib.figure.Figure.add_subplot` call used to
        create each subplots.

      *fig_kw* : dict
        Dict with keywords passed to the :func:`figure` call.  Note that all
        keywords not recognized above will be automatically included here.

  返回值

  有两个fig和 axt(它是元组的方式哦)

      - *fig* is the :class:`matplotlib.figure.Figure` object

      - *ax* can be either a single axis object or an array of axis
        objects if more than one subplot was created.  The dimensions
        of the resulting array can be controlled with the squeeze
        keyword, see above.
参数这里能跳过还是尽量跳过吧 ... ... 我们用一个简单点的例子给解释下。
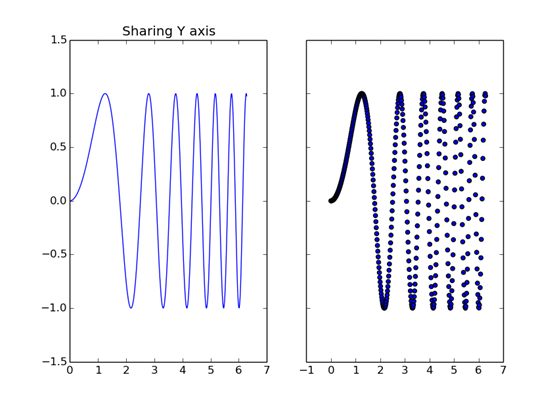
import matplotlib.pyplot as plt
%matplotlib inline

f, (ax1, ax2) = plt.subplots(1, 2, sharey=True)
ax1.plot(x, y)
ax1.set_title('Sharing Y axis')
ax2.scatter(x, y)
plt.show()
一般最常用的用法也就这么几个了,如果还想要继续深入了解的话,那就看多点文章,多敲点代码吧
posted on 2021-12-11 21:19 YangShusen' 阅读(551) 评论(0) 收藏 举报

 浙公网安备 33010602011771号