机器学习------召回率,精确率等二分类评价方法
sklearn metrics
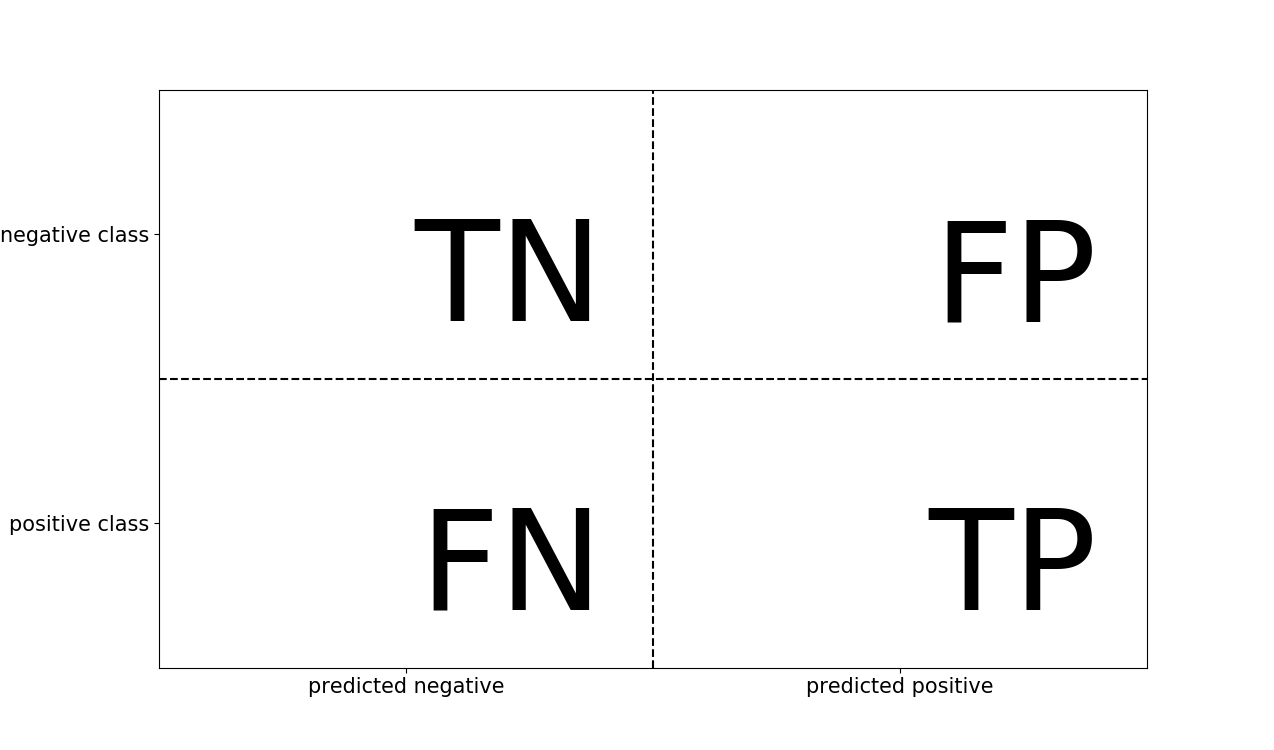
1 TP,FP,TN,FN
2 precision_recall_function
import numpy as np
import pandas as pd
import matplotlib.pyplot as plt
from sklearn.svm import SVC
from sklearn.metrics import precision_recall_curve
from sklearn.metrics import confusion_matrix
from sklearn.metrics import f1_score
from sklearn.metrics import classification_report
from mglearn.datasets import make_blobs
from sklearn.model_selection import train_test_split
X,y=make_blobs(n_samples=(400,50),centers=2,cluster_std=(7,2),random_state=0)
X_train,X_test,y_train,y_test=train_test_split(X,y)
svc=SVC(gamma=0.5).fit(X_train,y_train)
import mglearn
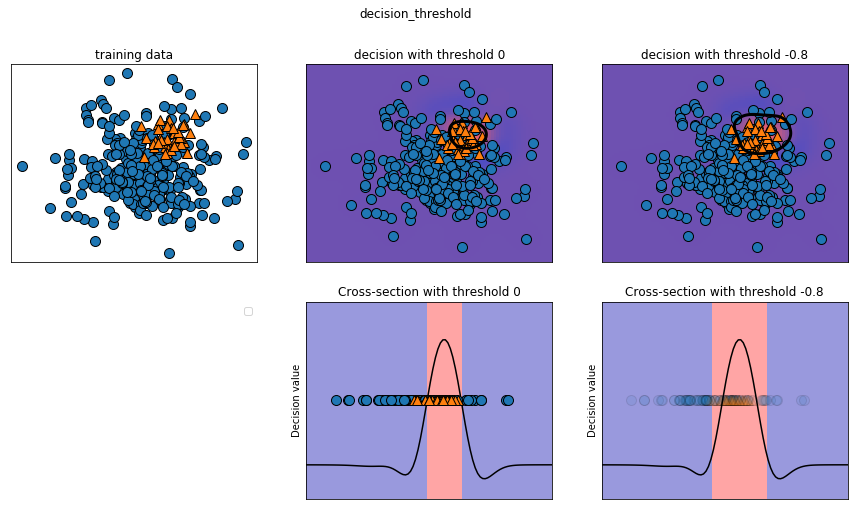
mglearn.plots.plot_decision_threshold()
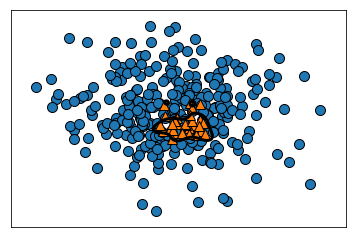
fig=plt.figure()
ax=fig.add_subplot(1,1,1)
mglearn.plot_helpers.discrete_scatter(X_train[:,0],X_train[:,1],y_train,ax=ax)
mglearn.tools.plot_2d_separator(svc,X_train,linewidth=3,ax=ax,threshold=-0.8)
svc.decision_function(X_test[:10])
array([-0.87247112, -0.99350892, -0.98708475, -1.15238961, -0.9951879 ,
       -1.0033453 , -0.96807227, -0.97703297, -1.00914978, -0.24745027])
svc.decision_function(X_test[:10])>-0.8
array([False, False, False, False, False, False, False, False, False,
        True])
print(classification_report(y_test,svc.decision_function(X_test)>-0.8))
             precision    recall  f1-score   support

          0       0.95      0.96      0.96       102
          1       0.60      0.55      0.57        11

avg / total       0.92      0.92      0.92       113
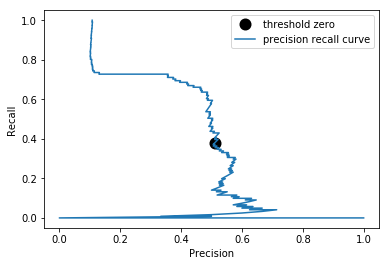
3 binary classification精确率、召回率曲线
X,y=make_blobs(n_samples=(4000,500),centers=2,cluster_std=(7,2),random_state=0)
X_train,X_test,y_train,y_test=train_test_split(X,y)
svc=SVC(gamma=0.5).fit(X_train,y_train)
precision,recall,threshold=precision_recall_curve(y_test,svc.decision_function(X_test))
close=np.argmin(np.abs(threshold))
plt.plot(precision[close],recall[close],'o',markersize=10.,label='threshold zero',c='k',mew=2)
plt.plot(precision,recall,label='precision recall curve')
plt.xlabel('Precision')
plt.ylabel('Recall')
plt.legend()
<matplotlib.legend.Legend at 0x24784de1da0>
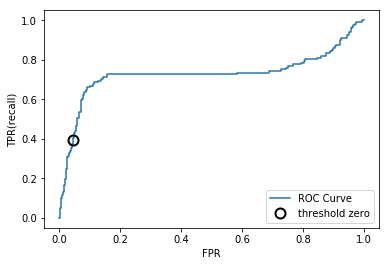
3 binary classification ROC曲线
from sklearn.metrics import roc_curve
fpr,tpr,threshold=roc_curve(y_test,svc.decision_function(X_test))
plt.plot(fpr,tpr,label='ROC Curve')
plt.xlabel('FPR')
plt.ylabel('TPR(recall)')
close_zero=np.argmin(np.abs(threshold))
plt.plot(fpr[close_zero],tpr[close_zero],'o',markersize=10.,label='threshold zero',c='k',mew=2,fillstyle='none')
plt.legend(loc=4)
<matplotlib.legend.Legend at 0x2478518d320>

 浙公网安备 33010602011771号