

matplotlib热图
1.基础知识点回顾
- 1.plot(x, y, marker='D')表示绘制折线图,marker设置样式菱形。
- 2.scatter(x, y, marker='s', color='r')绘制散点图,红色正方形。
- 3.bar(x, y, 0.5, color='c')绘制柱状图,间距为0.5,原色。
- 4.hist(data,40,normed=1,histtype='bar',facecolor='yellowgreen',alpha=0.75)直方图。
- 5.设置x轴和y轴的坐标值:
- xlim(-2.5, 2.5) #设置x轴范围
- ylim(-1, 1) #设置y轴范围
- 6.显示中文和负号代码如下:
- plt.rcParams['font.sas-serig']=['SimHei'] #用来正常显示中文标签
- plt.rcParams['axes.unicode_minus']=False #用来正常显示负号
2.Heatmap热图基础知识
详情请参阅:http://matplotlib.org/users/image_tutorial.html
In [1]: import matplot.pyplot as plt
In [2]: help(plt.imshow)
Help on function imshow in module matplotlib.pyplot:

imshow(X, cmap=None, norm=None, aspect=None, interpolation=None, alpha=None, vmin=None, vmax=None, origin=None, extent=None, shape=None, filternorm=1, filterrad=4.0, imlim=None, resample=None, url=None, hold=None, data=None, **kwargs)
    Display an image on the axes.

    Parameters
    ----------
    X : array_like, shape (n, m) or (n, m, 3) or (n, m, 4)
        Display the image in `X` to current axes.  `X` may be an
        array or a PIL image. If `X` is an array, it
        can have the following shapes and types:

        - MxN -- values to be mapped (float or int)
        - MxNx3 -- RGB (float or uint8)
        - MxNx4 -- RGBA (float or uint8)

        The value for each component of MxNx3 and MxNx4 float arrays
        should be in the range 0.0 to 1.0. MxN arrays are mapped
        to colors based on the `norm` (mapping scalar to scalar)
        and the `cmap` (mapping the normed scalar to a color).

    cmap : `~matplotlib.colors.Colormap`, optional, default: None
        If None, default to rc `image.cmap` value. `cmap` is ignored
        if `X` is 3-D, directly specifying RGB(A) values.
参数X可以是图片也可以数组,若是数组,必须以下三种形式
- MxN:values to be mapped (float or int)
- MxNx3 -- RGB (float or uint8)
- MxNx4 -- RGBA (float or uint8))
- 3维数组或4维数组范围必须是(0,1)
- 参考:http://blog.csdn.net/Eastmount/article/details/73392106?fps=1&locationNum=5
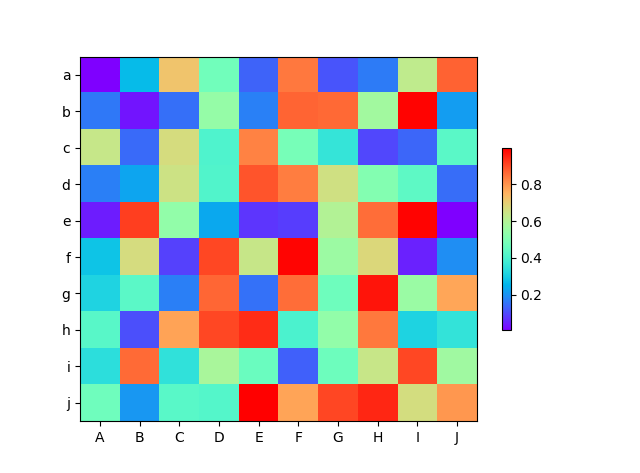
3.Heatmap热图绘制
import numpy as np
from matplotlib import pyplot as plt
from matplotlib import cm
from matplotlib import axes

def draw_heatmap(data,xlabels,ylabels):
    #cmap=cm.Blues
    cmap=cm.get_cmap('rainbow',1000)
    figure=plt.figure(facecolor='w')
    ax=figure.add_subplot(1,1,1,position=[0.1,0.15,0.8,0.8])
    ax.set_yticks(range(len(ylabels)))
    ax.set_yticklabels(ylabels)
    ax.set_xticks(range(len(xlabels)))
    ax.set_xticklabels(xlabels)
    map=ax.imshow(data,interpolation='nearest',cmap=cmap,aspect='auto',vmin=a.min(),vmax=a.max())
    cb=plt.colorbar(mappable=map,cax=None,ax=None,shrink=0.5)
    plt.show()

a=np.random.rand(10,10)
print(a)
xlabels=['A','B','C','D','E','F','G','H','I','J']
ylabels=['a','b','c','d','e','f','g','h','i','j']
draw_heatmap(a,xlabels,ylabels)
这里想把某块显示成一种颜色,则需要调用interpolation='nearest'参数即可


【推荐】国内首个AI IDE,深度理解中文开发场景,立即下载体验Trae
【推荐】编程新体验,更懂你的AI,立即体验豆包MarsCode编程助手
【推荐】抖音旗下AI助手豆包,你的智能百科全书,全免费不限次数
【推荐】轻量又高性能的 SSH 工具 IShell:AI 加持,快人一步
· Linux系列:如何用 C#调用 C方法造成内存泄露
· AI与.NET技术实操系列(二):开始使用ML.NET
· 记一次.NET内存居高不下排查解决与启示
· 探究高空视频全景AR技术的实现原理
· 理解Rust引用及其生命周期标识(上)
· DeepSeek 开源周回顾「GitHub 热点速览」
· 物流快递公司核心技术能力-地址解析分单基础技术分享
· .NET 10首个预览版发布:重大改进与新特性概览!
· AI与.NET技术实操系列(二):开始使用ML.NET
· 单线程的Redis速度为什么快?