
caffe 统计分析显示权重分布脚本
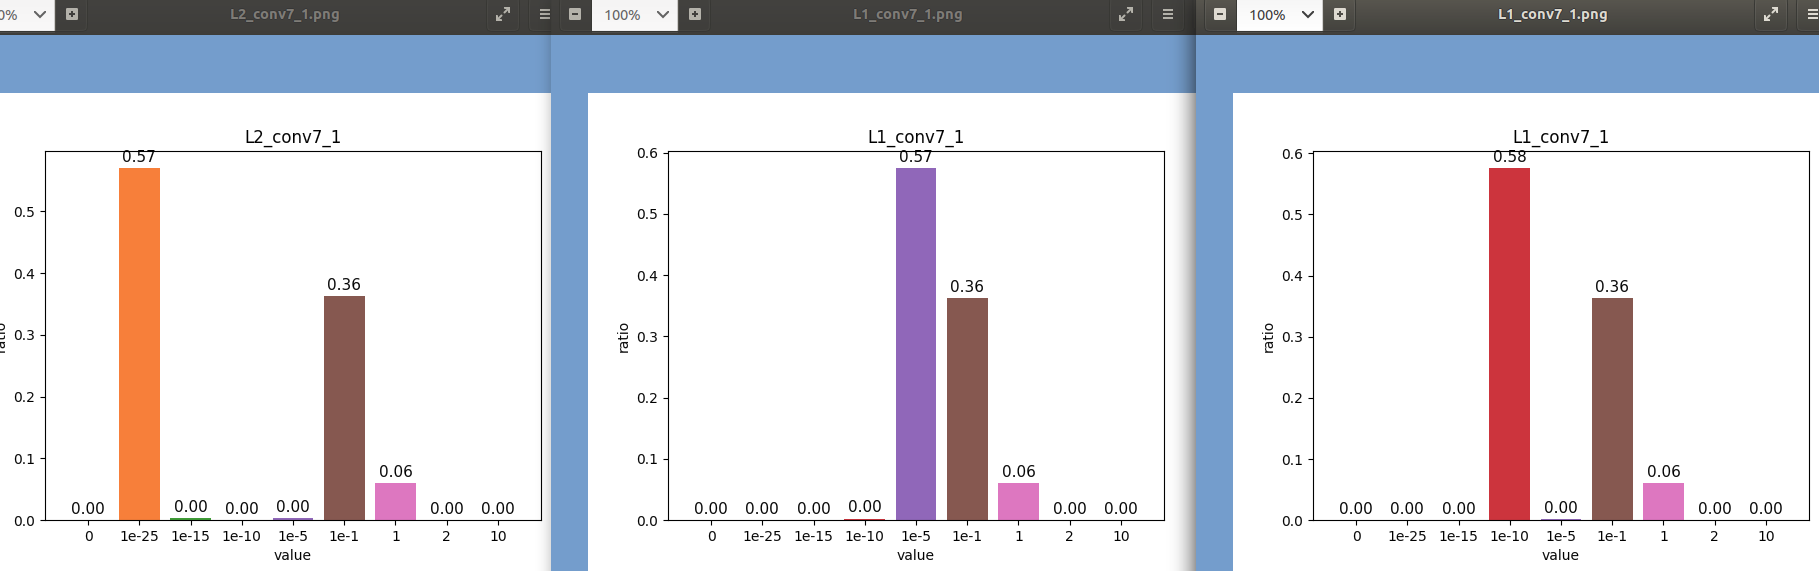
先上效果图如下:
import numpy as np
import matplotlib.pyplot as plt
import random


def Statistics_weight(save_dir, type, name, weight):
    if not os.path.exists(save_dir):
        os.mkdir(save_dir)
    weight_abs = abs(weight)
    max_val = np.max(weight_abs)
    min_val = np.min(weight_abs)

  ################################################
    x_data = [0, 1e-25, 1e-15, 1e-10, 1e-5, 1e-1, 1, 2, 10]
    x_data_show = ["0", "1e-25", "1e-15", "1e-10", "1e-5", "1e-1", "1", "2", "10"]

    y_data = []

    for i in range(len(x_data)):
        if 0 == i:
            tmp0 = weight_abs >= 0
        else:
            tmp0 = weight_abs >= x_data[i-1]

        if 0 == x_data[i]:
            tmp1 = weight_abs <= x_data[i]
        else:
            tmp1 = weight_abs < x_data[i]

        pos_right = (np.multiply(tmp0, tmp1)).sum()
        ratio = pos_right * 1.0 / weight_abs.size
        y_data.append(ratio)
    ################################################

    # print(x_data)
    # print(y_data)
    plt.figure(name)


    # 画图,plt.bar()可以画柱状图
    for i in range(len(x_data)):
        plt.bar(x_data_show[i], y_data[i])

    for a, b in zip(x_data_show, y_data):
        plt.text(a, b + 0.005, ("%.2f" % b), ha='center', va='bottom', fontsize=11)


    # 设置图片名称
    plt.title(type + "_" + name)
    # 设置x轴标签名
    plt.xlabel("value")
    # 设置y轴标签名
    plt.ylabel("ratio")

    plt.savefig(os.path.join(save_dir, type + "_" + name+".png"))
    # 显示
    # plt.show()


####conv
    print("==========>>conv" * 5)
    total_weight = 0
    total_weight_avail = 0
    for layer_para_name, para in net.params.items():
        if "bn" in layer_para_name or "scale" in layer_para_name or "Scale" in layer_para_name or "bias" in layer_para_name:
            continue


        Statistics_weight("/media/xxx_sparse/caffe-jacinto/0000/deply/show/0930/0930_L1+sprse", "L1+sparse", layer_para_name, abs(para[0].data))


        weights_np = abs(para[0].data)  # para[0]weight   para[1]bias   2  128  3  3
        weights_np_0 = weights_np[0]

        tmp_2 = weights_np <= 0.2
        ratio_123 = tmp_2.sum() * 1.0 / weights_np.size

        total_weight += weights_np.size
        tmp = weights_np > T
        total_weight_avail += tmp.sum()

        ratio_zero = (1 - (tmp.sum() * 1.0 / weights_np.size))
        print("layer_para_name=", layer_para_name, "    ratio_zero=", ratio_zero)

    print("ratio_conv_avail_weight=", total_weight_avail * 1.0 / total_weight, "     ratio_conv_not_avail_weight=",
          1 - total_weight_avail * 1.0 / total_weight)

    ##################################
c++ 加在blob.hpp里面的代码:
    double statistics_weight(const string name, int start, int n, const float &max_threshold_value, const float &threshold_fraction_selected)
    {

       const double* data_vec = cpu_data<double>() + start;
        double max_tmp = -DBL_MIN;
//        double min_tmp = -DBL_MAX;

//        cv::rectangle();
      for(int i=0; i< n; i++)
      {
          max_tmp = abs(data_vec[i]) > max_tmp ? abs(data_vec[i]) : max_tmp;

      }

      int split = 10;
      float each_ = max_tmp / split;
      std::vector<int> Histogram_(split, 0);
        for(int i=0; i< n; i++)
        {
            int idx = abs(data_vec[i]) / each_;
            if(split == idx)
            {
                idx -= 1;
            }
            Histogram_[idx] += 1;
        }

        int height_img = 500;
        cv::Mat hist(height_img, height_img*1.8, CV_8UC3, cv::Scalar(0,0,0));

        int T_hist_width = 60;
        int T_hist_gap = T_hist_width + 20;

        for(int i=0;i<split;i++)
        {
            float ratio = Histogram_[i] * 1.0 / n;
            int height = ratio * height_img;
            cv::Point pt_tl = cv::Point(i*T_hist_gap, height_img - height);
            cv::Point pt_br = cv::Point(i*T_hist_gap+T_hist_width,height_img - 0);
            cv::rectangle(hist, pt_tl, pt_br, cv::Scalar(255,0,0), -1);

            cv::putText(hist, std::to_string(ratio*100.0) + "%", cv::Point(pt_tl.x, pt_tl.y - 30), cv::FONT_HERSHEY_PLAIN, 1, cv::Scalar(0,255,255),1);

            string str_each_1 = std::to_string((each_ * (i+1)));
            int pos_decimal_point = str_each_1.find(".");
            string str_each_new = str_each_1.substr(0,pos_decimal_point+3);
            cv::putText(hist, str_each_new, cv::Point((pt_tl.x+pt_br.x)/2-5, height_img), cv::FONT_HERSHEY_PLAIN, 1, cv::Scalar(0,0,255),1);

            cv::putText(hist, "max_threshold_value="+ std::to_string(max_threshold_value), cv::Point(hist.cols*0.25, 50), cv::FONT_HERSHEY_PLAIN, 1, cv::Scalar(0,255,0),1);
            cv::putText(hist, "threshold_fraction_selected="+ std::to_string(threshold_fraction_selected*100) + "%", cv::Point(hist.cols*0.25, 120), cv::FONT_HERSHEY_PLAIN, 1, cv::Scalar(0,255,0),1);
        }

        cv::imshow("hist_"+name,hist);
        cv::waitKey(0);


        return max_tmp;
    }
c++的在net.cpp的稀疏代码中调用:
for(int c=0; c<no; c++) {
//          LOG(INFO) <<"=========>c="<<c;

          int weight_count_channel = ni * kernel_shape_data[0] * kernel_shape_data[1] / num_group;
          int start_index = weight_count_channel * c;


          float max_abs = std::abs(conv_weights.max(start_index, weight_count_channel));
          float min_abs = std::abs(conv_weights.min(start_index, weight_count_channel));
          float max_abs_value = std::max<float>(max_abs, min_abs);
          float step_size = max_abs_value * threshold_step_factor;
          float max_threshold_value = std::min<float>(std::min<float>(threshold_value_max, max_abs_value*threshold_value_maxratio), max_abs_value);


           float aa = conv_weights.statistics_weight(layer_name, start_index, weight_count_channel, max_threshold_value, threshold_fraction_selected);

          bool verbose_th_val = false;
          if(verbose && verbose_th_val || 0) {////////
            if ((max_abs_value*threshold_value_maxratio) > threshold_value_max) {
                LOG(INFO) << "threshold_value_max " << threshold_value_max;
                LOG(INFO) << "threshold_value_maxratio " << threshold_value_maxratio;
                LOG(INFO) << "max_abs_value*threshold_value_maxratio " << (max_abs_value*threshold_value_maxratio);
                LOG(INFO) << "final threshold_value used" << max_threshold_value;
            }
          }
好记性不如烂键盘---点滴、积累、进步!

