目标检测画图显示图
这是我见过最好的代码了,摘录自u版本的yolov3里面的。
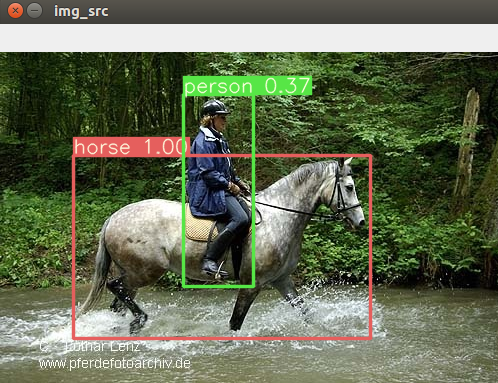
首先看画出的效果图:

每个类用不同颜色框,上面写出类别和分数这些信息,并且是填充。字体大小能够根据图片大小自动调整。
def plot_one_box(x, img, color=None, label=None, line_thickness=None):
    # Plots one bounding box on image img
    tl = line_thickness or round(0.002 * (img.shape[0] + img.shape[1]) / 2) + 1  # line/font thickness
    color = color or [random.randint(0, 255) for _ in range(3)]
    c1, c2 = (int(x[0]), int(x[1])), (int(x[2]), int(x[3]))
    cv2.rectangle(img, c1, c2, color, thickness=tl, lineType=cv2.LINE_AA)
    if label:
        tf = max(tl - 1, 1)  # font thickness
        t_size = cv2.getTextSize(label, 0, fontScale=tl / 3, thickness=tf)[0]
        c2 = c1[0] + t_size[0], c1[1] - t_size[1] - 3
        cv2.rectangle(img, c1, c2, color, -1, cv2.LINE_AA)  # filled
        cv2.putText(img, label, (c1[0], c1[1] - 2), 0, tl / 3, [225, 255, 255], thickness=tf, lineType=cv2.LINE_AA)


labelmap = (  # always index 0
    'aeroplane', 'bicycle', 'bird', 'boat',
    'bottle', 'bus', 'car', 'cat', 'chair',
    'cow', 'diningtable', 'dog', 'horse',
    'motorbike', 'person', 'pottedplant',
    'sheep', 'sofa', 'train', 'tvmonitor')

colors = [[random.randint(0, 255) for _ in range(3)] for _ in range(len(labelmap))]


....
...
for i in range(detections.size(1)):
    j = 0
    while detections[0, i, j, 0] >= 0.3:
        score = detections[0, i, j, 0]
        idx_class = i-1
        label_name = labelmap[idx_class]
        label_conf = '%s %.2f' % (label_name, score)
        pt = (detections[0, i, j, 1:]*scale).cpu().numpy()
        coords = (pt[0], pt[1], pt[2], pt[3])
        plot_one_box(coords, img_src, label=label_conf, color=colors[idx_class])

        pred_num += 1
        # with open(filename, mode='a') as f:
        #     f.write(str(pred_num)+' label: '+label_name+' score: ' +
        #             str(score) + ' '+' || '.join(str(c) for c in coords) + '\n')
        j += 1

cv2.imshow("img_src",img_src)
cv2.waitKey(0)
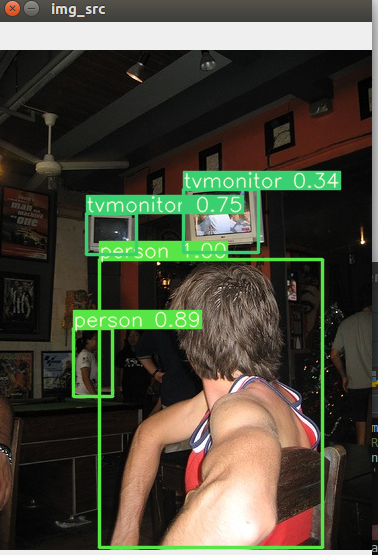
以上是把目标矩形框一个个画出来,最后再显示的。再来一张图

好记性不如烂键盘---点滴、积累、进步!


【推荐】编程新体验,更懂你的AI,立即体验豆包MarsCode编程助手
【推荐】凌霞软件回馈社区,博客园 & 1Panel & Halo 联合会员上线
【推荐】抖音旗下AI助手豆包,你的智能百科全书,全免费不限次数
【推荐】博客园社区专享云产品让利特惠,阿里云新客6.5折上折
【推荐】轻量又高性能的 SSH 工具 IShell:AI 加持,快人一步
· Java 中堆内存和栈内存上的数据分布和特点
· 开发中对象命名的一点思考
· .NET Core内存结构体系(Windows环境)底层原理浅谈
· C# 深度学习:对抗生成网络(GAN)训练头像生成模型
· .NET 适配 HarmonyOS 进展
· 手把手教你更优雅的享受 DeepSeek
· 腾讯元宝接入 DeepSeek R1 模型,支持深度思考 + 联网搜索,好用不卡机!
· AI工具推荐:领先的开源 AI 代码助手——Continue
· 探秘Transformer系列之(2)---总体架构
· V-Control:一个基于 .NET MAUI 的开箱即用的UI组件库