
微信小程序中使用echarts
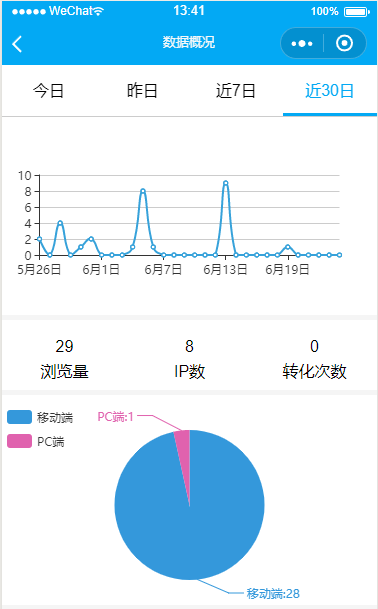
一、效果图
二、代码
import * as echarts from '../../component/ec-canvas/echarts';
const app = getApp();
var xData = ["1:00", "2:00", "3:00", "4:00", "5:00", "6:00", "7:00", "8:00", "9:00", "10:00", "11:00", "12:00", "13:00", "14:00", "15:00"], yData = [], chart, charts, pc=0, mobile=0;
function initChart(canvas, width, height) {
  chart = echarts.init(canvas, null, {
    width: width,
    height: height
  });
  canvas.setChart(chart);
  var option = {
    color: ["#37A2DA"],
    xAxis: {
      type: 'category',
      boundaryGap: false,
      data: xData,
    },
    yAxis: {
      x: 'center',
      type: 'value'
    },
    series: [{
      type: 'line',
      smooth: true,
      data: yData
    }]
  };
  chart.setOption(option);
  return chart;
}
function initCharts(canvas, width, height) {
  charts = echarts.init(canvas, null, {
    width: width,
    height: height
  });
  canvas.setChart(charts);

  var options = {
    color: ["#3498DB", "#E062AE"],
    tooltip: {
      trigger: 'item',
      formatter: "{a} {b}: {c} ({d}%)"
    },
    legend: {
      orient: 'vertical',
      x: 'left',
      paddingTop: '50px',
      data: ['移动端', 'PC端']
    },
    grid: {
      left: 20,
      right: 20,
      bottom: 15,
      top: 40,
      containLabel: true
    },

    series: [
      {
        name: '访问来源',
        type: 'pie',
        label: {
          normal: {
            show: true,
            position: 'outside',
            formatter: '{b}:{c}'
          },
          emphasis: {
            show: true,
            textStyle: {
              fontSize: '20',
              fontWeight: 'bold'
            }
          }
        },
        data: [
          { value: mobile, name: "移动端" },
          { value: pc, name:"PC端"}
        ]
      }
    ]
  };

  charts.setOption(options);
  return charts;
}
Page({
  data: {
    tabs: ["今日", "昨日", "近7日", "近30日"],
    activeIndex: 0,
    sliderOffset: 0,
    sliderLeft: 0,
    ec: {
      onInit: initChart
    },
    ecs: {
      onInit: initCharts
    }
  },
  onLoad: function (options) {
    var that = this;
    app.initNavbar(that);
  },
  onShow: function () {
    var that = this;
    setTimeout(function () {
      that.getDataInfo(0)
    }, 500)
  },
  tabClick: function (e) {
    this.setData({
      sliderOffset: e.currentTarget.offsetLeft,
      activeIndex: e.currentTarget.id
    });
    this.getDataInfo(e.currentTarget.id);
  },
  getDataInfo(index) {
    wx.showLoading({
      title: '正在加载...',
      mask: true
    });
    var that = this;
    wx.request({
      url: app.api.getData,
      data: {
        userid: wx.getStorageSync("userInfo").userid,
        action: index
      },
      success(res) {
        var yData = res.data.yData;
        var xData = res.data.xData;
        var option = chart.getOption();
        option.series[0].data = yData;
        option.xAxis = {
          type: 'category',
          boundaryGap: false,
          data: xData,
        };
        chart.setOption(option, true);
        var options = charts.getOption();
        options.series[0].data[0].value = res.data.mobile.num;
        options.series[0].data[1].value = res.data.pc.num;
        charts.setOption(options, true);
        that.setData({
          ip: res.data.ip,
          messall: res.data.messall,
          view: res.data.view
        })
      },
      error() {
        app.errorModal("网络出错");
      },
      complete() {
        wx.hideLoading();
      }
    })
  }
})
<ec-canvas id="mychart-dom-line" canvas-id="mychart-line" ec="{{ ec }}"></ec-canvas>
三、下载
下载ec-cavas地址:https://github.com/ecomfe/echarts-for-weixin
四、Demo


 浙公网安备 33010602011771号