
promethues安装部署
1、promethues官网:https://prometheus.io/download/,选择需要的版本下载
2、版本包解压
tar -zxf prometheus-2.34.0.linux-amd64.tar.gz
3、修改配置文件prometheus.yml
    static_configs:
      - targets: ["47.108.135.30:9090"]
4、启动服务
./prometheus &
5、安装export监控主机:官网下载node_exporter-1.3.1.linux-amd64.tar.gz
6、解压后直接启动
tar -zxf node_exporter-1.3.1.linux-amd64.tar.gz
cd node_exporter-1.3.1
./node_exporter &
7、在prometheus.yml添加配置,然后重启prometheus
  - job_name: 'node'
    static_configs:
      - targets: ["47.108.84.186:9100"]
8、浏览器输入:ip:9090,登录查看
9、安装grafana,grafana官网:https://grafana.com/
先下载版本:grafana-enterprise-8.4.3.linux-amd64.tar.gz
然后解压:tar -zxf grafana-enterprise-8.4.3.linux-amd64.tar.gz
10、启动服务
cd grafana-8.4.3/bin
nohup ./grafana-server web > /dev/null &
11、浏览器打开输入:ip:3000/login,默认账号密码:admin/admin
12、添加promethues数据源
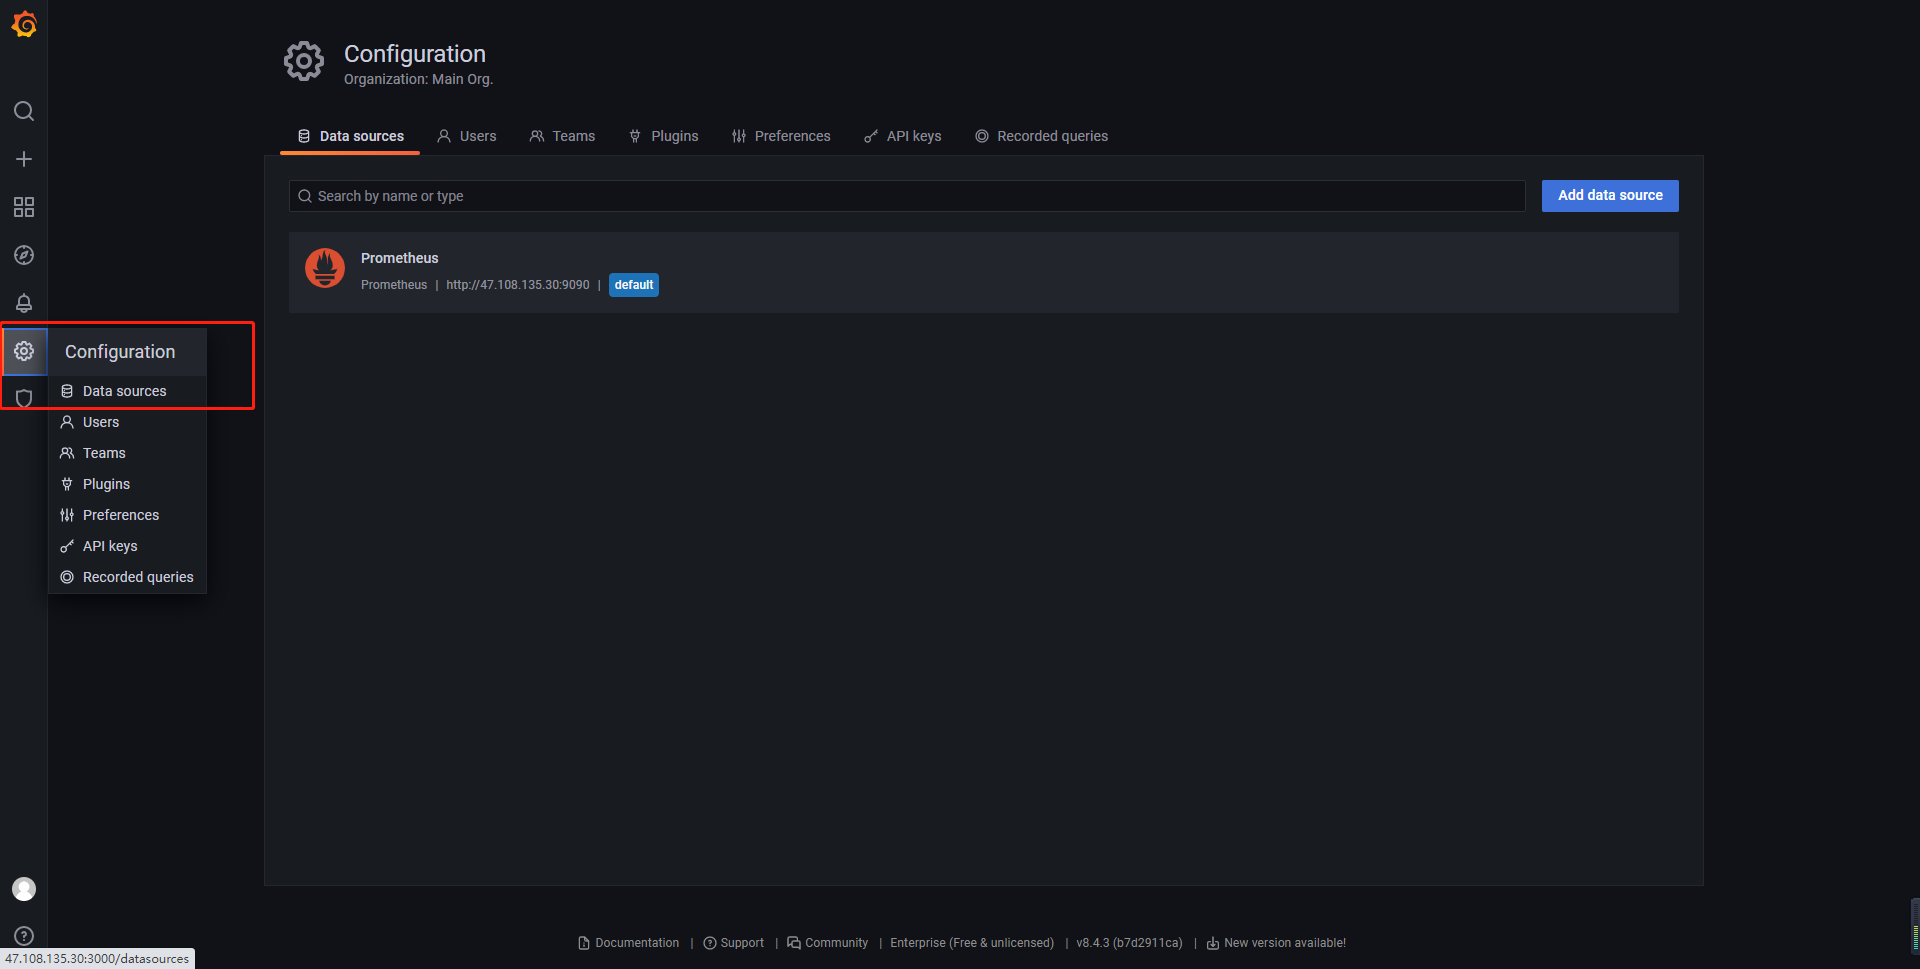
注:Grafana监控模板有很多可下载适用

 浙公网安备 33010602011771号