【工具】3D绘图工具 mlab
1 安装与配置
系统环境:Ubuntu18.04
参考:https://blog.csdn.net/SSchawn/article/details/107238138
# python3.8安装不了mayavi,得3.7(或者以下?没试过)
conda create -n mayavi python=3.7

# 因为vtk==9.0的时候会报错
pip install vtk==8.1.2

pip install mayavi
pip install pyqt5

#如果报错缺少vtk,就把vtk包加入pythonpath
export PYTHONPATH=$PYTHONPATH:~/anaconda3/lib/python3.7/site-packages/vtk
配置问题及解决方法
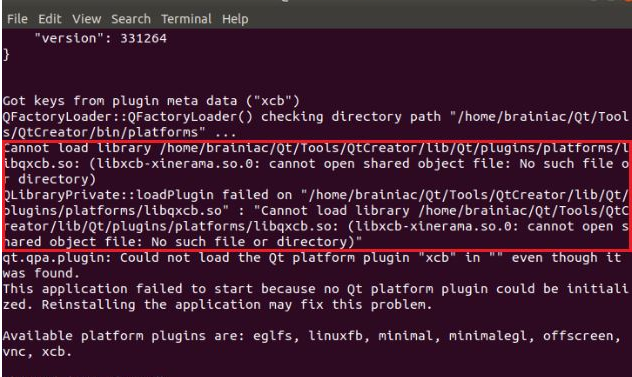
1. 安装Qt后,在运行测试用例时弹出错误
qt.qpa.plugin: Could not load the Qt platform plugin "xcb" in "" even though it was found.
This application failed to start because no Qt platform plugin could be initialized. Reinstalling the application may fix this problem.
Available platform plugins are: eglfs, linuxfb, minimal, minimalegl, offscreen, vnc, xcb.
解决:
参考:https://www.zhangshengrong.com/p/KWa35bWMXo/
(1) 定位问题:
gedit ~/.bashrc
最末尾添加如下语句:
export QT_DEBUG_PLUGINS=1
保存,关闭,使配置文件生效
source ~/.bashrc
终端重新运行测试用例(必须终端运行,在pycharm中运行不会显示详细信息)

定位是Qt动态链接库的问题,当加载libqxcb.so库的时候,还需要加载libxcb-xinerama库。
(2)安装libxcb-xinerama库(如果还存在其他依赖库没有安装,也一并安装)
sudo apt install libxcb-xinerama0
之后即可成功运行测试用例
2. mayavi 和 OpenCV一起使用,报错
QObject::moveToThread: Current thread (0x1e8cb20) is not the object's thread (0x193d820).
Cannot move to target thread (0x1e8cb20)
qt.qpa.plugin: Could not load the Qt platform plugin "xcb" in "/usr/local/lib/python3.8/dist-packages/cv2/qt/plugins" even though it was found.
This application failed to start because no Qt platform plugin could be initialized. Reinstalling the application may fix this problem.
Available platform plugins are: xcb, eglfs, linuxfb, minimal, minimalegl, offscreen, vnc, wayland-egl, wayland, wayland-xcomposite-egl, wayland-xcomposite-glx, webgl.
解决:
参考:https://blog.csdn.net/qq_36917144/article/details/111197041
卸载opencv,安装opencv-contrib-python-headless
pip uninstall opencv-python
pip install opencv-contrib-python-headless --trusted-host pypi.douban.com`
2 使用
参考:https://blog.csdn.net/bill20100829/article/details/113768990
可视化可以通过在numpy数组上运行的一组函数在mlab中创建。
所述MLAB绘图函数采取numpy的阵列作为输入,描述 x,y和z该数据的坐标。他们构建了完善的可视化:他们创建数据源,必要时进行过滤,并添加可视化模块。与pylab类似,可以通过关键字参数对它们的行为以及由此创建的可视化进行微调。此外,它们都返回创建的可视化模块,因此也可以通过更改该模块的属性来修改可视化。
0D和1D数据
points3d()
曲线字形(像点)所提供的数据的位置,通过描述x,y,z 相同形状的numpy的阵列。
plot3d()
重复所提供的数据,通过所描述之间排队x, y,z具有相同长度的一维numpy的阵列。
2D数据
imshow()
查看2D阵列作为图像。
surf()
将2D数组作为地毯图查看,其中z轴通过高程表示数组点的值。
contour_surf()
以线轮廓查看2D阵列,并根据阵列点的值进行提升。
mesh()
绘制由三个二维阵列中所述的表面,x, y,z赋予数据点作为网格的坐标。
与不同surf(),曲面是由定义的 x,y并且z没有特权方向进行协调。可以创建更复杂的曲面。
barchart()
用条形图(例如直方图)绘制s带有明确坐标数组x,y和 的数组或一组点z。
此功能非常通用,可以接受2D或3D阵列,也可以包含点云来定位条。
triangular_mesh()
绘制一个三角网格,通过完全指明的 x,y和z其顶点的坐标,并且第(n,3)的三角形的索引的数组。
3D数据
contour3d()
绘制定义为3D阵列的体积数据的等值面。
quiver3d()
绘制箭头以表示数据点处的向量。的x,y,z位置由numpy的阵列,以及所指定的u,v,w 所述矢量的分量。
flow()
绘制颗粒的轨迹沿着由三个三维阵列给予描述的矢量场u, v,w在网格上的组件。
volume_slice()
绘制通过体积数据切片的交互式图像平面。


【推荐】国内首个AI IDE,深度理解中文开发场景,立即下载体验Trae
【推荐】编程新体验,更懂你的AI,立即体验豆包MarsCode编程助手
【推荐】抖音旗下AI助手豆包,你的智能百科全书,全免费不限次数
【推荐】轻量又高性能的 SSH 工具 IShell:AI 加持,快人一步
· 震惊!C++程序真的从main开始吗?99%的程序员都答错了
· 【硬核科普】Trae如何「偷看」你的代码?零基础破解AI编程运行原理
· 单元测试从入门到精通
· 上周热点回顾(3.3-3.9)
· winform 绘制太阳,地球,月球 运作规律