


matlab中调整subplot各子图间间隔
python中可以用plt.subplots_adjust(wspace=0, hspace=0)函数来调整subplot中各子图间间隔
matlab中没有专门的函数用来调整subplot中各子图间间隔,但是在网上找到一个类似函数,
[ha, pos] = tight_subplot(Nh, Nw, [gap_h gap_w], [lower upper], [left right])
Nh:子图行数;
Nw:子图列数;
[gap_h gap_w]:子图的上下间距和左右间距;
[lower upper]:图上下边框宽度;
[left right]:图左右边框宽度;
ha:生成画布后,用来控制在第几个画布中作图
demo:
clear
clc
x = -10:0.1:10;
len = length(x);
y1 =zeros(6, len);
y2 =zeros(6, len);
for i=1:6
y1(i, :) = sin(x)*i+i;
y2(i, :) = cos(x)*i+i;
end
figure;
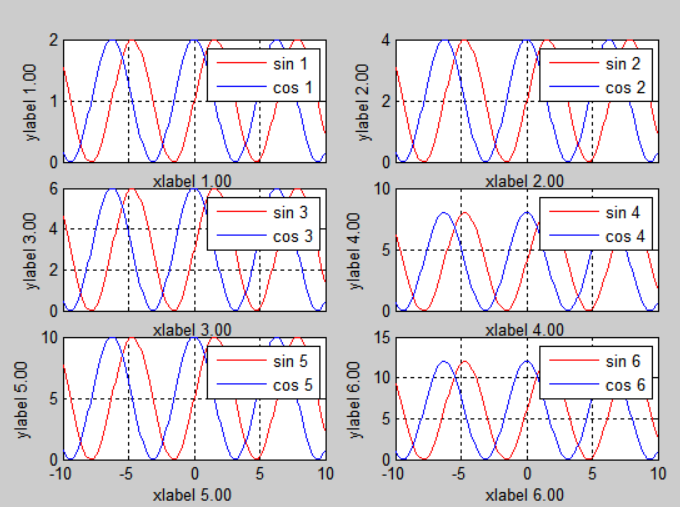
[ha, pos] = tight_subplot(3,2,[.05 .1],[.1 .1],[.1 .05]);
for i=1:6
myxlabel = sprintf('xlabel %.2f', i);
myylabel = sprintf('ylabel %.2f', i);
mylegend1 = sprintf('sin %d', i);
mylegend2 = sprintf('cos %d', i);
axes(ha(i)); plot(x, y1(i, :), 'r', x, y2(i, :), 'b');
xlabel(myxlabel); ylabel(myylabel); legend(mylegend1, mylegend2); grid on;
end
set(ha(1:4),'XTickLabel','');
% set([ha(2), ha(4), ha(6)],'YTickLabel','');
function [ha, pos] = tight_subplot(Nh, Nw, gap, marg_h, marg_w)
% tight_subplot creates "subplot" axes with adjustable gaps and margins
%
% [ha, pos] = tight_subplot(Nh, Nw, gap, marg_h, marg_w)
%
%   in:  Nh      number of axes in hight (vertical direction)
%        Nw      number of axes in width (horizontaldirection)
%        gap     gaps between the axes in normalized units (0...1)
%                   or [gap_h gap_w] for different gaps in height and width
%        marg_h  margins in height in normalized units (0...1)
%                   or [lower upper] for different lower and upper margins
%        marg_w  margins in width in normalized units (0...1)
%                   or [left right] for different left and right margins
%
%  out:  ha     array of handles of the axes objects
%                   starting from upper left corner, going row-wise as in
%                   subplot
%        pos    positions of the axes objects
%
%  Example: ha = tight_subplot(3,2,[.01 .03],[.1 .01],[.01 .01])
%           for ii = 1:6; axes(ha(ii)); plot(randn(10,ii)); end
%           set(ha(1:4),'XTickLabel',''); set(ha,'YTickLabel','')
% Pekka Kumpulainen 21.5.2012   @tut.fi
% Tampere University of Technology / Automation Science and Engineering
    if nargin<3; gap = .02; end
    if nargin<4 || isempty(marg_h); marg_h = .05; end
    if nargin<5; marg_w = .05; end
    if numel(gap)==1;
        gap = [gap gap];
    end
    if numel(marg_w)==1;
        marg_w = [marg_w marg_w];
    end
    if numel(marg_h)==1;
        marg_h = [marg_h marg_h];
    end
    axh = (1-sum(marg_h)-(Nh-1)*gap(1))/Nh;
    axw = (1-sum(marg_w)-(Nw-1)*gap(2))/Nw;
    py = 1-marg_h(2)-axh;
    % ha = zeros(Nh*Nw,1);
    ii = 0;
    for ih = 1:Nh
        px = marg_w(1);

        for ix = 1:Nw
            ii = ii+1;
            ha(ii) = axes('Units','normalized', ...
                'Position',[px py axw axh], ...
                'XTickLabel','', ...
                'YTickLabel','');
            px = px+axw+gap(2);
        end
        py = py-axh-gap(1);
    end
    if nargout > 1
        pos = get(ha,'Position');
    end
    ha = ha(:);
参考:
[1] tight_subplot

