命令行查看Gluster卷带宽和iops
观察IO数据前先在gluster客户端挂载卷,然后使用fio工具往gluster卷中写入数据,fio参考命令:
fio -filename=file4 -direct=1 -iodepth 1 -thread -rw=write -ioengine=libaio -bs=128k -size=32G -numjobs=10 -group_reporting -name=gfstest
GlusterFS Volume Profile简介
GlusterFS Volume Profile命令提供了一个接口,用于获取卷中每个Brick的I / O信息,有助于分析存储系统中的瓶颈。
Usage:
volume profile <VOLNAME> {start|info [peek|incremental [peek]|cumulative|clear]|stop} [nfs]
首先要开启卷的性能分析选项:
# gluster volume profile fuben start
查看卷性能命令:
# gluster volume profile fuben info
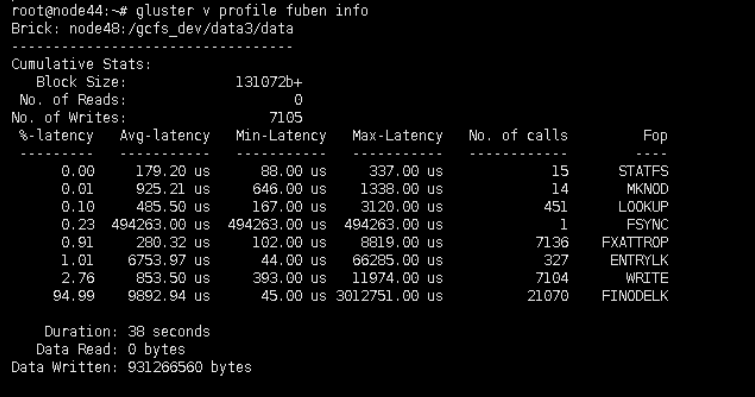
参数说明:
Cumulative Stats:Brick的累计统计数据信息
Block Size:每次读取或写入的块大小,这个值会根据当前客户端的IO大小自动调整
修改参数:performance.rda-request-size,可减少客户端与服务器的交互,增强性能,通过该命令查看:gluster v get fuben all|grep performance.rda-request-size,上图的Block Size是128k
No. of Reads:从该Brick中累计读取的Block Size次数
No. of Writes:累计写入该Brick中的Block Size次数,这个值是从下面的Fop栏位中的WRITE栏获取的
%-latency:Brick中每个Fop步骤的延时比例占比;
Duration:累计统计时间
Data Read:从该Brick中累计读取的数据量,这个值是由No. of Reads乘以Block Size得到的;
Data Written:累计写入该Brick中的数据量,这个值No. of Writes乘以Block Size得到的;
由上参数说明可得出:
卷的读写iops=每个Brick中的No. of Reads或No. of Writes除以Duration后相加的值;
卷的读写带宽=每个Brick中的Data Read或Data Written除以Duration后相加的值;
查看最新的几条性能数据信息:
# gluster v profile fuben info incremental
打印副本卷所有Brick的写延时数据
gluster v profile gfspool2 info incremental|egrep 'Brick|latency|WRITE'
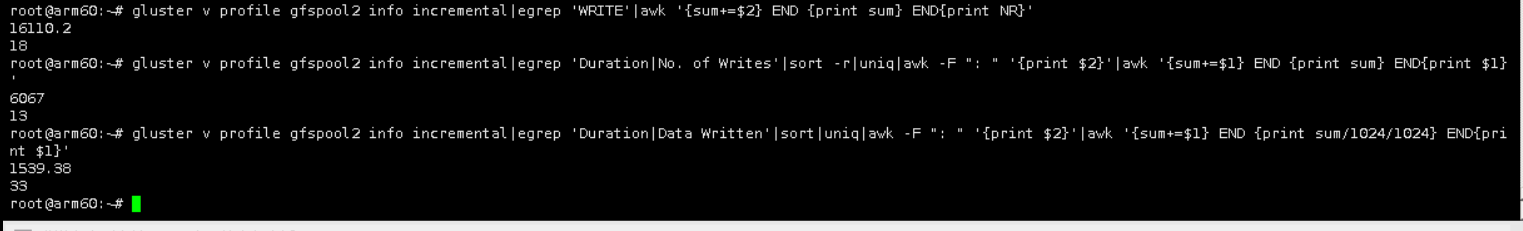
打印副本卷所有Brick的数量和平均写延时之和【写延时=平均写延时之和/Brick数量,单位是us】
gluster v profile gfspool2 info incremental|egrep 'WRITE'|awk '{sum+=$2} END {print sum} END{print NR}'
打印副本卷统计间隔
gluster v profile gfspool2 info incremental|egrep 'Duration'|awk '{print $2}'|uniq
打印副本卷所有Brick读带宽数据
gluster v profile gfspool2 info incremental|egrep 'Data Read'|awk '{print $3}'
打印副本卷所有Brick写带宽数据
gluster v profile gfspool2 info incremental|egrep 'Data Written'|awk '{print $3}'
打印副本卷所有Date Brick数据卷(不含仲裁卷)写带宽之和并转换为MB(读类似)
gluster v profile gfspool2 info incremental|egrep 'Brick|Duration|Data Read|Data Written'|grep -A 3 'data$'|grep 'Data Written'|awk '{sum+=$3} END {print sum/1024/1024}'
打印副本卷所有Date Brick(含仲裁卷)统计间隔和写带宽之和【计算写带宽结果:(写带宽之和-统计间隔)/统计间隔】
注1:如果卷是2副本的,实际带宽要乘以副本数,因为文件写进来会同时往2个Brick上面写
注2:要看读的话,把下面命令中的Data Written换成Data Read即可
注3:命令行中的head -5,这个5指的是卷的所有Brick数量+1
gluster v profile gfspool2 info incremental|egrep 'Duration|Data Written'|sort|uniq|awk -F ": " '{print $2}'|awk '{sum+=$1} END {print sum/1024/1024} END{print $1}'
gluster v profile fuben info incremental|egrep 'Duration|Data Written'|sort -r|awk -F ": " '{print $2}'|head -5|awk '{sum+=$1} END {print "ALL Data Written(bytes): " sum} END{print "Duration: " $1} END{print "Bandwidth(MB/S): " sum/1024/1024/$1-1}'
打印副本卷所有Date Brick统计间隔和写IOPS之和【计算写IOPS结果:(写IOPS之和-统计间隔)/统计间隔】
注1:要看读的话,把下面命令中的No. of Writes换成No. of Reads即可
gluster v profile gfspool2 info incremental|egrep 'Duration|No. of Writes'|sort -r|uniq|awk -F ": " '{print $2}'|awk '{sum+=$1} END {print sum} END{print $1}'
gluster v profile fuben info incremental|egrep 'Duration|No. of Writes'|sort -r|awk -F ": " '{print $2}'|head -5|awk '{sum+=$1} END {print "ALL No. of Writes: " sum} END{print "Duration: " $1} END{print "iops: " sum/$1-1}'
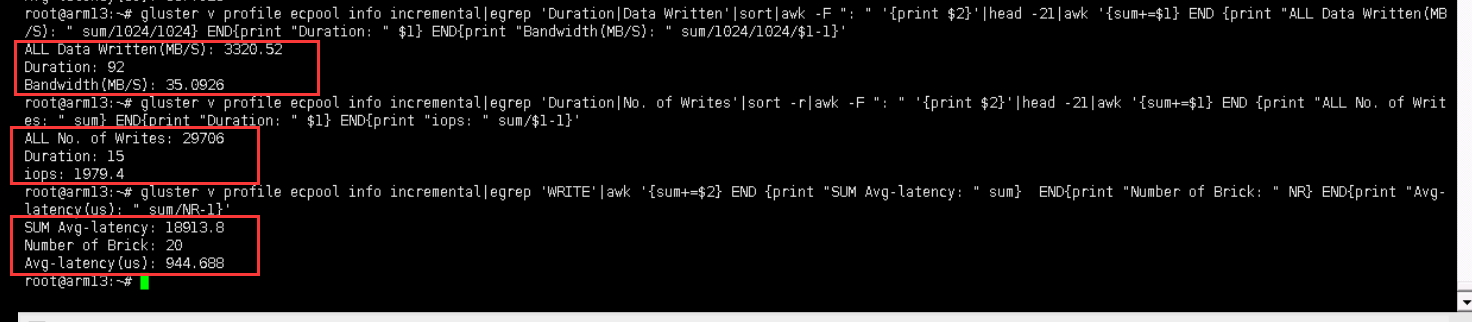
演示效果:
打印纠删卷所有Date Brick统计间隔和写IOPS之和【计算写IOPS结果:(写IOPS之和-统计间隔)/统计间隔】
gluster v profile ecpool info incremental|egrep 'Duration|No. of Writes'|sort -r|awk -F ": " '{print $2}'|head -21|awk '{sum+=$1} END {print "ALL No. of Writes: " sum} END{print "Duration: " $1} END{print "iops: " sum/$1-1}'
注1:命令行中的head -21,这个21是卷的所有Brick数量+1(加的这个1是统计间隔的数据所在行数),比如卷是分布式为2,纠删比为8:2的类型,那么head后面的值就是(8+2)×2+1
打印纠删卷所有Date Brick统计间隔和写带宽之和【计算写带宽结果:(写带宽之和-统计间隔)/统计间隔】
gluster v profile ecpool info incremental|egrep 'Duration|Data Written'|sort|awk -F ": " '{print $2}'|head -21|awk '{sum+=$1} END {print "ALL Data Written(bytes): " sum} END{print "Duration: " $1} END{print "Bandwidth(MB/S): " sum/1024/1024/$1-1}'
打印纠删卷所有Brick的写延时
gluster v profile ecpool info incremental|egrep 'WRITE|%-latency'|sort -r|uniq
打印纠删卷所有Brick的读和写的延时
gluster v profile fuben info incremental|egrep 'READ$|WRITE'|sort|awk '{print $9 ": "$2 " " $3}
打印纠删卷所有Brick的数量和平均写延时之和【写延时=平均写延时之和/Brick数量,单位是us】
gluster v profile ecpool info incremental|egrep 'WRITE'|awk '{sum+=$2} END {print "SUM Avg-latency: " sum} END{print "Number of Brick: " NR} END{print "Avg-latency(us): " sum/NR-1}'
演示效果:

 浙公网安备 33010602011771号