微信小程序ECharts—面积图案例
微信小程序ECharts—面积图案例
帮助
微信ECharts:echarts-for-weixin
ECharts: ECharts
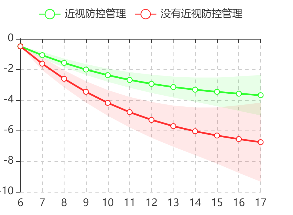
效果图
安装
下载git地址里的ec-canvas文件夹
引入
import * as echarts from '../../ec-canvas/echarts'
加载
onReady: function () {
    // 获取组件
    this.ecComponent = this.selectComponent('#mychart-dom-bar');
},
HTML
<view class="echarts row">
    <ec-canvas id="mychart-dom-bar" type="2d" canvas-id="mychart-bar"></ec-canvas>
</view>
CSS
.echarts {
  width: 100%;
  height: 300px;
}
JS
setOption
function setOption(chart, that) {
  let option = {
    legend: {
      data: ['近视防控管理', '没有近视防控管理']
    },
    tooltip: {
      trigger: 'axis',
      axisPointer: {
        type: 'cross',
        animation: false,
        label: {
          backgroundColor: '#ccc',
          borderColor: '#aaa',
          borderWidth: 1,
          shadowBlur: 0,
          shadowOffsetX: 0,
          shadowOffsetY: 0,

          color: '#222'
        }
      },
      formatter: function (params) {
        return params[2].name + '岁' + '\n' + '近视防控管理: ' + ((params[2].value)).toFixed(2) + 'D' + '\n' + '没有近视防控管理: ' + ((params[5].value)).toFixed(2) + 'D';
      }
    },
    xAxis: {
      type: 'category',
      data: that.data.ageRange,
      splitLine: {
        show: false
      },
      boundaryGap: false,
      splitLine: { //网格线
        lineStyle: {
          type: 'dashed' //设置网格线类型 dotted:虚线   solid:实线
        },
        show: true //隐藏或显示
      },
    },
    yAxis: {
      max: that.data.re[that.data.indexre - 1],
      splitLine: { //网格线
        lineStyle: {
          type: 'dashed' //设置网格线类型 dotted:虚线   solid:实线
        },
        show: true //隐藏或显示
      },
    },
    series: [{
        type: 'line',
        data: that.data.ctrl_ci_yes,
        lineStyle: {
          opacity: 0
        },
        stack: '近视防控管理',
        symbol: 'none'
      }, {
        type: 'line',
        data: that.data.ctrl_ci_no,
        lineStyle: {
          opacity: 0
        },
        areaStyle: {
          color: 'rgba(0, 255, 0, 0.3)'
        },
        stack: '近视防控管理',
        symbol: 'none'
      }, {
        name: '近视防控管理',
        type: 'line',
        data: that.data.ctrl_re,
        symbolSize: 6,
        itemStyle: {
          color: 'rgba(0, 255, 0, 0.8)'
        },
        showSymbol: true
      },
      {
        type: 'line',
        data: that.data.prog_ci_yes,
        lineStyle: {
          opacity: 0
        },
        stack: '没有近视防控管理',
        symbol: 'none'
      }, {
        type: 'line',
        data: that.data.prog_ci_no,
        lineStyle: {
          opacity: 0
        },
        areaStyle: {
          opacity: 0.3
        },
        itemStyle: {
          color: 'rgba(255, 0, 0, 0.3)',
        },
        stack: '没有近视防控管理',
        symbol: 'none'
      }, {
        name: '没有近视防控管理',
        type: 'line',
        data: that.data.prog_re,
        symbolSize: 6,
        itemStyle: {
          color: 'rgba(255, 0, 0, 0.8)'
        },
        showSymbol: true
      },
    ]
  }
  chart.setOption(option);
}
init
init: function () {
    this.ecComponent.init((canvas, width, height, dpr) => {
      // 获取组件的 canvas、width、height 后的回调函数
      // 在这里初始化图表
      const chart = echarts.init(canvas, null, {
        width: width,
        height: height,
        devicePixelRatio: dpr // new
      });
      setOption(chart, this);
      // 将图表实例绑定到 this 上,可以在其他成员函数(如 dispose)中访问
      this.chart = chart;
      // 注意这里一定要返回 chart 实例,否则会影响事件处理等
      return chart;
    });
  },
option示例
option = {
    tooltip: {
      show: true,
      trigger: 'axis',
      axisPointer: {
        type: 'cross',
        animation: false,
        label: {
          backgroundColor: '#ccc',
          borderColor: '#aaa',
          borderWidth: 1,
          shadowBlur: 0,
          shadowOffsetX: 0,
          shadowOffsetY: 0,


          color: '#222'
        }
      },
      formatter: function (params) {
        return params[2].name + '岁' + '' + '近视防控管理: ' + ((params[2].value)).toFixed(2) + ' D ' + '' + '没有近视防控管理: ' + ((params[5].value)).toFixed(2) + ' D ';
      }
    },
    xAxis: {
      type: 'category',
      data: [6, 7, 8, 9, 10, 11, 12, 13, 14, 15, 16, 17],
      splitLine: {
        show: false
      },
      boundaryGap: false,
      splitLine: { //网格线
        lineStyle: {
          type: 'dashed' //设置网格线类型 dotted:虚线   solid:实线
        },
        show: true //隐藏或显示
      }
    },
    yAxis: {
      max: '0',
      min: '-10',
      splitNumber: 10,
      splitLine: { //网格线
        lineStyle: {
          type: 'dashed' //设置网格线类型 dotted:虚线   solid:实线
        },
        show: true //隐藏或显示
      },
    },
    series: [{
        type: 'line',
        data: [-0.5, -0.861231526712669, -1.2956555229909303, -1.6611981329580532, -1.9562567510403632, -2.185743966036708, -2.3525516211336575, -2.475033720368854, -2.5381023474666753, -2.53626197950336, -2.4640354626299206, -2.3764732957797783],
        lineStyle: {
          opacity: 0
        },
        stack: '近视防控管理',
        symbol: 'none'
      }, {
        type: 'line',
        data: [0, -0.4320280742896091, -0.5722403711828714, -0.710128244459594, -0.8577095339937759, -1.0166682595573509, -1.1946583282155459, -1.369639539655327, -1.5870960298979426, -1.873500799097278, -2.2551161355879814, -2.636731472078683],
        lineStyle: {
          opacity: 0
        },
        areaStyle: {
          color: 'rgba(147, 242, 96, 0.5)'
        },
        stack: '近视防控管理',
        symbol: 'none'
      }, {
        name: '近视防控管理',
        type: 'line',
        data: [-0.5, -1.0772455638574736, -1.581775708582366, -2.01626225518785, -2.385111518037251, -2.6940780958153834, -2.9498807852414304, -3.1598534901965176, -3.3316503624156466, -3.473012379051999, -3.591593530423911, -3.6948390318191198],
        hoverAnimation: false,
        itemStyle: {
          color: 'blue'
        },
        showSymbol: false
      },
      {
        type: 'line',
        data: [-0.5, -1.208297111201312, -2.0601088686096674, -2.776859084231477, -3.355405394196791, -3.8053803255621723, -4.1324541590856025, -4.372615137978145, -4.4962791126797566, -4.492670548045804, -4.351049926725334, -4.179359403489761],
        lineStyle: {
          opacity: 0
        },
        stack: '没有近视防控管理',
        symbol: 'none'
      }, {
        type: 'line',
        data: [0, -0.8471138711560962, -1.1220399434958264, -1.3924083224697927, -1.6817833999877951, -1.9934671756026496, -2.342467310226562, -2.6855677248143675, -3.111952999799886, -3.6735309786221153, -4.4217963442901596, -5.170061709958202],
        lineStyle: {
          opacity: 0
        },
        areaStyle: {
          color: 'rgba(255, 0, 0, 0.5)'
        },
        stack: '没有近视防控管理',
        symbol: 'none'
      }, {
        type: 'line',
        data: [-0.5, -1.63185404677936, -2.6211288403575805, -3.4730632454663732, -4.1962970941906885, -4.802113913363497, -5.3036878141988835, -5.715399000385329, -6.0522556125797, -6.329436037356861, -6.561948098870414, -6.764390258468863],
        hoverAnimation: false,
        itemStyle: {
          color: 'RGB(196, 65, 70)'
        },
        showSymbol: false
      },
    ]
  }
坑
问题:echarts 面积图2个数据覆盖导致显示问题
当时因为写不出来还发了帖子求助想想自己也是蠢这么简单的问题都没想到https://developers.weixin.qq.com/community/develop/doc/000a26fb4b8e300090db3e75951800
解决:原因是基础库版本是2.0.4太低了把他改为2.16.0就行了

