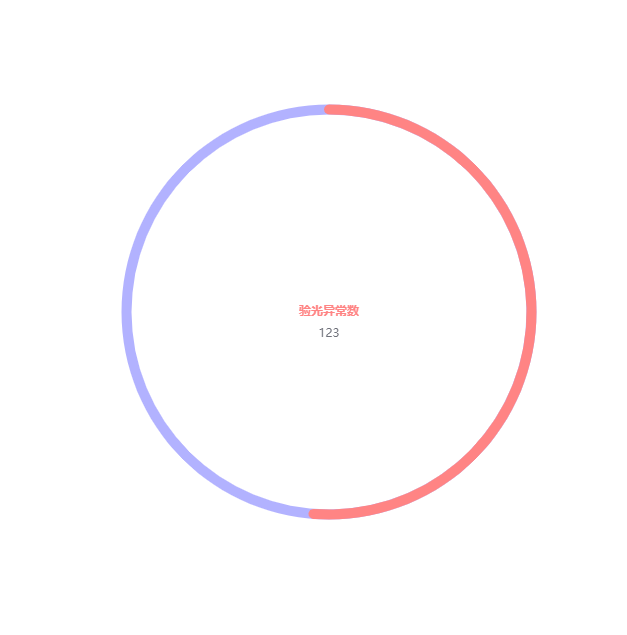
ECharts—饼图案例
ECharts—饼图案例
帮助
ECharts:ECharts

饼图样式
option = {
        title: {
          text: '验光异常数', //主标题
          subtext: 123, //副标题
          textStyle: {
            //文本样式
            color: '#ff8484',
            fontSize: 12,
          },
          left: 'center',
          top: 'center', //文字位置
        },
        angleAxis: {
          max: 123,
          clockwise: true, // 逆时针
          // 隐藏刻度线
          axisLine: {
            show: false,
          },
          axisTick: {
            show: false,
          },
          axisLabel: {
            show: false,
          },
          splitLine: {
            show: false,
          },
        },
        radiusAxis: {
          type: 'category',
          clockwise: true, // 逆时针
          // 隐藏刻度线
          axisLine: {
            show: false,
          },
          axisTick: {
            show: false,
          },
          axisLabel: {
            show: false,
          },
          splitLine: {
            show: false,
          },
        },
        polar: {
          center: ['50%', '50%'], //图形位置
          radius: '100%', //图形大小
        },
        series: [
          {
            type: 'bar',
            data: [
              {
                value: 63, // 当前数量
                itemStyle: {
                  normal: {
                    color: {
                      // 完成的圆环的颜色
                      colorStops: [
                        {
                          offset: 0,
                          color: '#ff8484', // 0% 处的颜色
                        },
                        {
                          offset: 1,
                          color: '#ff8484', // 100% 处的颜色
                        },
                      ],
                    },
                  },
                },
              },
            ],
            coordinateSystem: 'polar',
            roundCap: true,
            barWidth: 10,
            barGap: '-100%', // 两环重叠
            radius: ['49%', '52%'],
            z: 2,
          },
          {
            // 灰色环
            type: 'bar',
            data: [
              {
                value: 123, // 总体数量
                itemStyle: {
                  color: 'rgba(255, 255, 255, 0.3)',
                },
              },
            ],
            coordinateSystem: 'polar',
            animation: false,
            roundCap: true,
            barWidth: 10,
            barGap: '-100%', // 两环重叠
            radius: ['48%', '53%'],
            z: 1,
          },
        ],
      }
全部代码
historyO() {
      let myChart = echarts.init(document.getElementById('historyO'))
      let option = {}//饼图样式
      myChart.setOption(option)

      window.addEventListener('resize', function () {
        myChart.resize()
      })
    },


