
网易云热门音乐评论爬取+数据可视化
一、选题的背景
声乐艺术的情感,是歌唱者在自己内心唤起曾经的体验的情感,是一首歌曲的灵魂,抒发情感,给人带来幸福感满足感是音乐的魅力所在。只有加入情感的表现才能使演唱出来的音乐作品动听、感人。而想让作品富有张力,需要不断的接收评判,改良不足所在。根据热门歌曲榜单的评价,了解大众的观点对音乐作品的见解,才能做出更为惊人的音乐作品。
二、主题式网络爬虫设计方案
1.爬虫名称
网易云音乐评论爬虫
2.内容与数据特征分析
爬取的内容主要是目前为止的热门榜单,以及其他歌曲榜单,随机抽取榜单上的音乐,进入其评论区,获取评论的用户名、用户id、年龄、评论内容、时间等。
3.设计方案概述
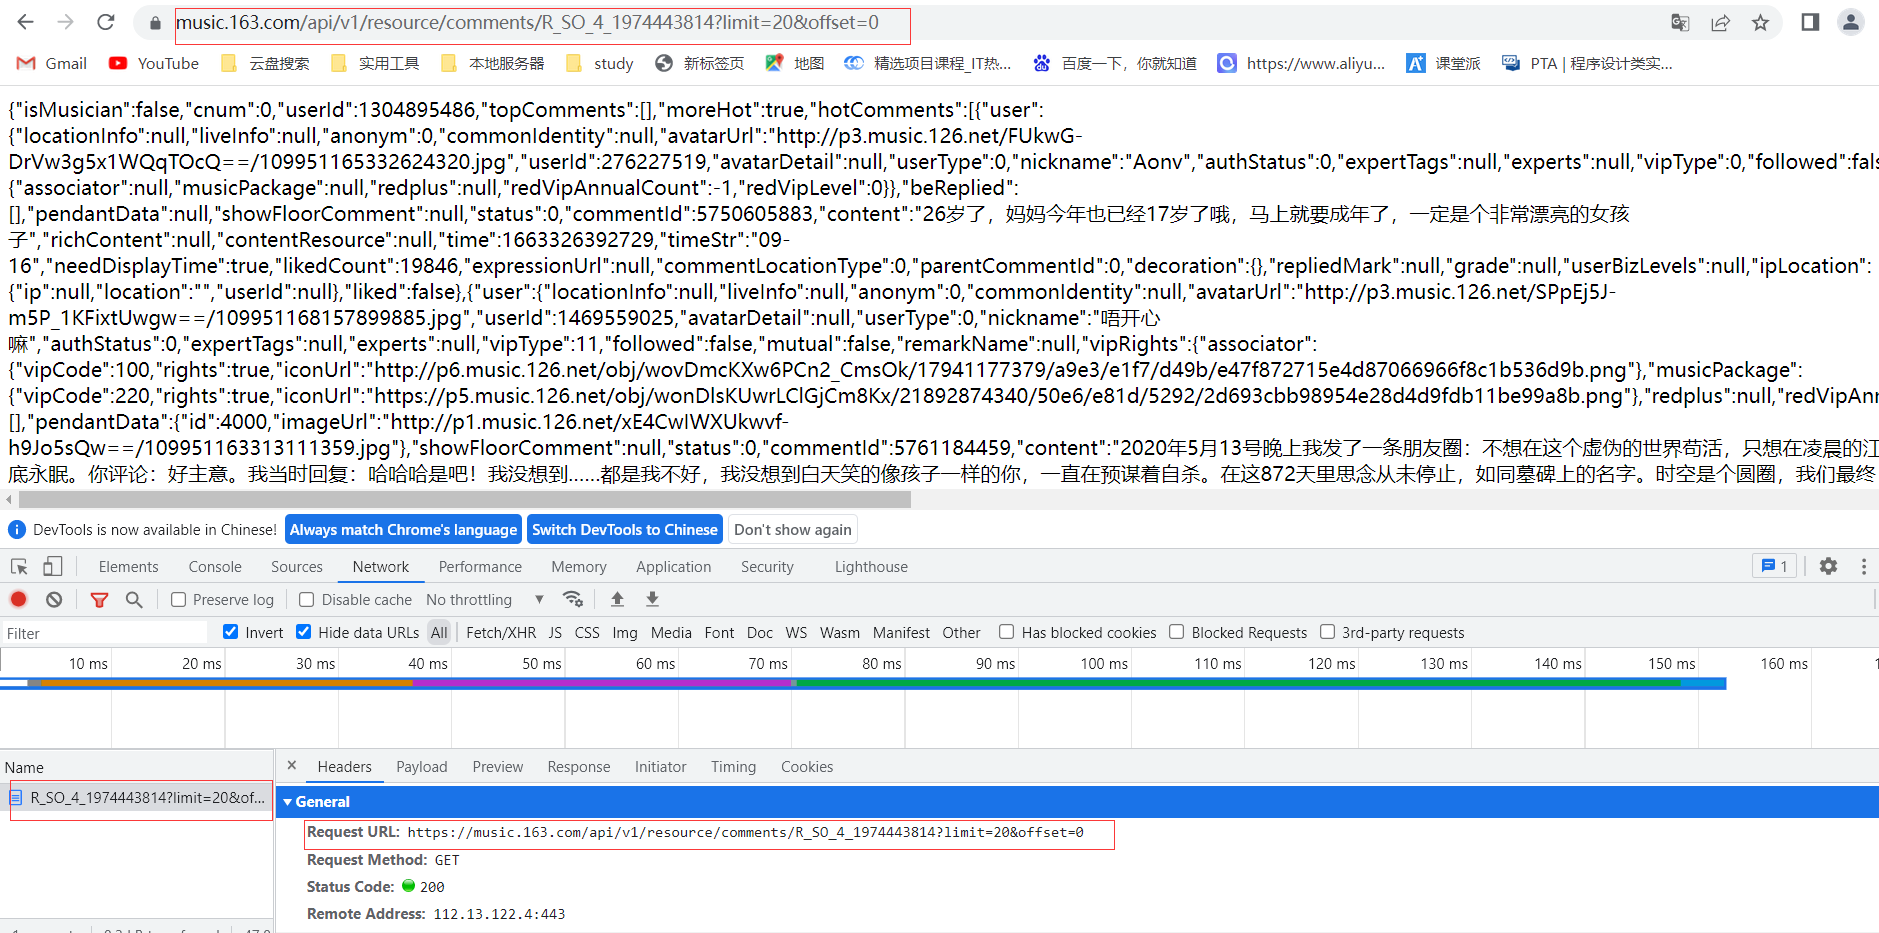
采用网易云音乐官方API根据音乐的ID,获取评论的API,,请求URL有3个可变部分:歌曲ID、每页限制数limit和评论总偏移量offset,通过API分析得知:当offeset=0时,返回json数据中包含有评论总数量total,然后使用Requests库中的get()方法爬取数据将爬取的内容转化为josh数据存储在music.cvs中。使用Pyecharts 、Pandas、Matplotlib等函数库绘制图形,在根据图像进行分析。
技术难点:
在实际操作过程中,虽然不用分析其数据结构直接使用官方API,但是网易云官方对API的请求设置了限制,因为评论采用的是当前热门榜单的歌曲,其歌曲评论是实时更新的,就会导致评论评论会有数据缺失,因此绘图时数据的格式略微有所不同。
三、页面结构特征分析
这里以赵雷的[我记得]为例,根据网易云音乐评论API,其中1974443814为音乐ID,limit为页面结果限制数,最大可设为100,offset为页面偏移。用户评论同理结果如下
网易云音乐评论API
https://music.163.com/api/v1/resource/comments/R_SO_4_1974443814?limit=20&offset=0
用户API
https://music.163.com/api/v1/user/detail/{用户ID}

四、程序设计
1.数据爬取与采集
具体代码如下
import json
import time
import requests

headers = {
        'Host': 'music.163.com',
        'User-Agent': 'Mozilla/5.0 (Windows NT 6.1; WOW64) AppleWebKit/537.36 (KHTML, like Gecko) Chrome/63.0.3239.132 Safari/537.36'
}


def get_comments(page):
    """
        获取评论信息
    """
    url = 'https://music.163.com/api/v1/resource/comments/R_SO_4_2004684052?limit=20&offset=' + str(page)
    response = requests.get(url=url, headers=headers)
    # 将字符串转为json格式
    result = json.loads(response.text)
    items = result['comments']
    for item in items:

        # 用户名
        user_name = item['user']['nickname'].replace(',', ',')
        # 用户ID
        user_id = str(item['user']['userId'])
        # 获取用户信息
        user_message = get_user(user_id)
        # 用户年龄
        user_age = str(user_message['age'])
        # 用户性别
        user_gender = str(user_message['gender'])
        # 用户所在地区
        user_city = str(user_message['city'])
        # 个人介绍
        user_introduce = user_message['sign'].strip().replace('\n', '').replace(',', ',')
        # 评论内容
        comment = item['content'].strip().replace('\n', '').replace(',', ',')
        # 评论ID
        comment_id = str(item['commentId'])
        # 评论点赞数
        praise = str(item['likedCount'])
        # 评论时间
        date = time.localtime(int(str(item['time'])[:10]))
        date = time.strftime("%Y-%m-%d %H:%M:%S", date)
        print(user_name, user_id, user_age, user_gender, user_city, user_introduce, comment, comment_id, praise, date)

        with open('music_comments.csv', 'a', encoding='utf-8-sig') as f:
            f.write(user_name + ',' + user_id + ',' + user_age + ',' + user_gender + ',' + user_city + ',' + user_introduce + ',' + comment + ',' + comment_id + ',' + praise + ',' + date + '\n')
        f.close()

def get_user(user_id):
    """
    获取用户注册时间
    """
    data = {}
    url = 'https://music.163.com/api/v1/user/detail/' + str(user_id)
    # 使用2808proxy代理
    response = requests.get(url=url, headers=headers)
    # 将字符串转为json格式
    js = json.loads(response.text)
    if js['code'] == 200:
        # 性别
        data['gender'] = js['profile']['gender']
        # 年龄
        if int(js['profile']['birthday']) < 0:
            data['age'] = 0
        else:
            data['age'] = (2018 - 1970) - (int(js['profile']['birthday']) // (1000 * 365 * 24 * 3600))
        if int(data['age']) < 0:
            data['age'] = 0
        # 城市
        data['city'] = js['profile']['city']
        # 个人介绍
        data['sign'] = js['profile']['signature']
    else:
        data['gender'] = '无'
        data['age'] = '无'
        data['city'] = '无'
        data['sign'] = '无'
    return data


def main():
    for i in range(0, 25000, 20):
        print('\n---------------第 ' + str(i // 20 + 1) + ' 页---------------')
        get_comments(i)


if __name__ == '__main__':
    main()
最后获得评论信息将获取的数据存入music.csv中


包含了用户名、用户ID、年龄、性别、区域编码、个人介绍、评论、评论ID、点赞数、评论发表时间。总共10.1w条数据,比起大数据的意义上来说,勉强够踏入大数据的门槛。
1.数据清洗
用户评论的ID是唯一的所以可以根据用户评论的ID筛选重复的评论
# 读取数据
df = pd.read_csv('music.csv', header=None, names=['name', 'userid', 'age', 'gender', 'city', 'text', 'comment', 'commentid', 'praise', 'date'], encoding='utf-8-sig')
# 根据评论ID去重
df = df.drop_duplicates('commentid')
# 分组汇总
user_message = df.groupby(['userid'])
user_com = user_message['userid'].agg(['count'])
user_com.reset_index(inplace=True)
user_com_last = user_com.sort_values('count', ascending=False)[0:10]
print(user_com_last)
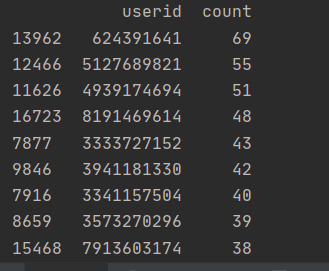
十万条数据重复的只有这些,数据请理的不够全面,程序的编写不够完善。
2.评论词云图
根据获取的数据对ID进行筛选,去除重复的ID,筛选出现词汇最多的词
# 设置文本随机颜色
def random_color_func(word=None, font_size=None, position=None, orientation=None, font_path=None, random_state=None):
    h, s, l = random.choice([(188, 72, 53), (253, 63, 56), (12, 78, 69)])
    return "hsl({}, {}%, {}%)".format(h, s, l)


# 读取信息
df = pd.read_csv('music.csv', header=None, names=['name', 'userid', 'age', 'gender', 'city', 'text', 'comment', 'commentid', 'praise', 'date'], encoding='utf-8-sig')
# 根据评论ID去重
df = df.drop_duplicates('commentid')
words = pd.read_csv('chineseStopWords.txt', encoding='gbk', sep='\t', names=['stopword'])
# 分词
text = ''
for line in df['comment']:
    text += ' '.join(jieba.cut(str(line), cut_all=False))
# 停用词
stopwords = set('')
stopwords.update(words['stopword'])
backgroud_Image = plt.imread('music.jpg')

wc = WordCloud(
    background_color='white',
    mask=backgroud_Image,
    font_path='C:/Windows/Fonts/STCAIYUN.TTF',
    max_words=2000,
    max_font_size=250,
    min_font_size=15,
    color_func=random_color_func,
    prefer_horizontal=1,
    random_state=50,
    stopwords=stopwords
)

wc.generate_from_text(text)
# img_colors = ImageColorGenerator(backgroud_Image)
# 看看词频高的有哪些
process_word = WordCloud.process_text(wc, text)
sort = sorted(process_word.items(), key=lambda e: e[1], reverse=True)
print(sort[:50])
plt.imshow(wc)
plt.axis('off')
wc.to_file("网易云音乐评论词云.jpg")
print('生成词云成功!')

大部分的评论都是[好] [喜欢] [爱]之类的偏向于赞赏鼓励,说明音乐的创作更主要的是唱出倾听者的内心,唤醒人的真善美。
3.用户平均年龄分布
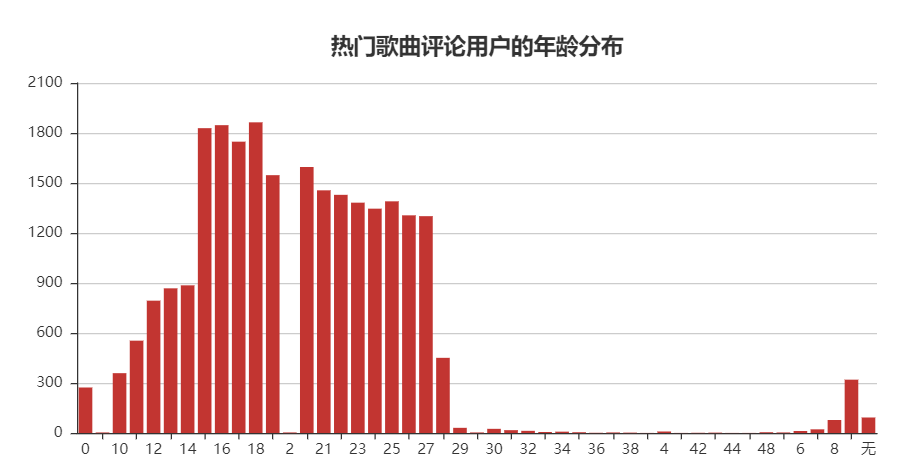
用户的平均年龄大多数再14-25岁之间,这也符合网易云的定位,文艺小青年的集中地,出现0岁的可能是数据爬取时出了问题,出现0岁的情况,年龄排序混乱,目前还不清楚问题出现所在。
4.用户性别平均分布
attr = ['男', '女']
v1 = gender_com['count']
pie = Pie("热门歌曲评论用户的性别情况", title_pos='center', title_top=0)
pie.add("", attr, v1, radius=[40, 75], label_text_color=None, is_label_show=True, legend_orient="vertical", legend_pos="left", legend_top="%10")
pie.render("热门歌曲评论用户的性别情况.html")
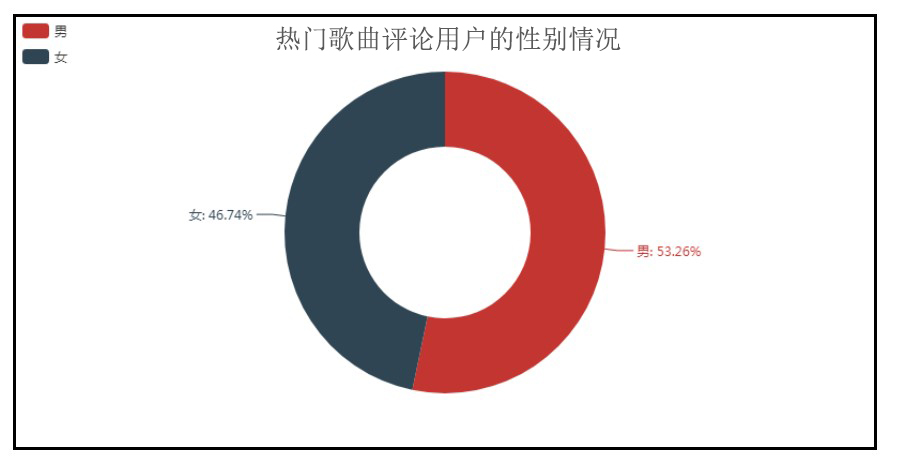
男女对听歌的比例近乎1:1,男生对于歌曲的评价略微比女生多一些,可能是我国男女的比例,男生比较多,所以评论的人数占大多数一点。
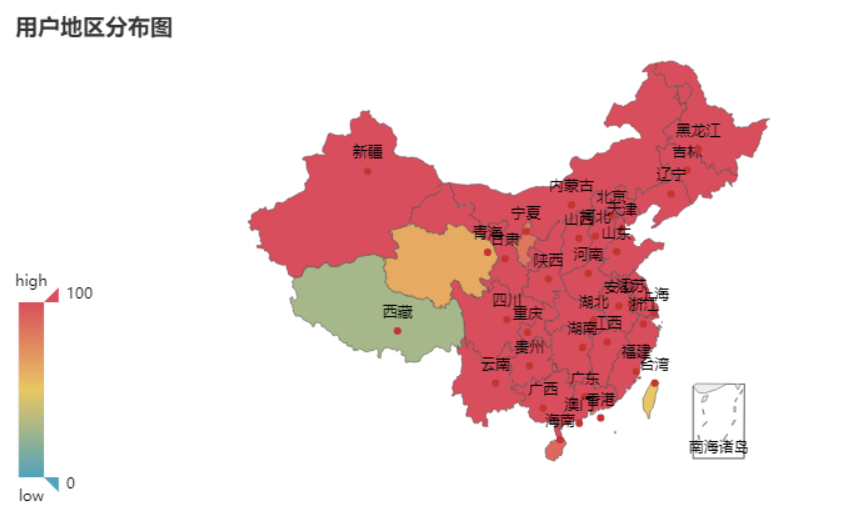
5.用户地区分布
# 绘制地图
value = [i for i in loc_com['count']]
attr = [i for i in loc_com['location']]
map = Map("热门歌曲评论用户的地区分布图", title_pos='center', title_top=0)
map.add("", attr, value, maptype="china", is_visualmap=True, visual_text_color="#000", is_map_symbol_show=False, visual_range=[0, 600])
map.render('热门歌曲评论用户的地区分布图.html')
用户地区分布图可以看出,用户涵盖了全国各大省份,可能是中间数据的缺失,并没有展现出哪个省份特别突出的情况。对歌评的可视化分析,可以看出明显的地区分布差异。
6.热门歌曲评论的时间分布
df['time'] = pd.to_datetime([str(i).split(' ')[0] for i in df['date']])

# 分组汇总
date_message = df.groupby(['time'])
date_com = date_message['time'].agg(['count'])
date_com.reset_index(inplace=True)

# 绘制走势图
attr = date_com['time']
v1 = date_com['count']
line = Line("歌曲发布后评论的日期分布", title_pos='center', title_top='22', width=1000, height=600)
line.add("", attr, v1, is_smooth=True, is_fill=True, area_color="#000", is_xaxislabel_align=True, xaxis_min="dataMin", area_opacity=0.3, mark_point=["max"], mark_point_symbol="pin", mark_point_symbolsize=55)
line.render("热门歌曲评论的日期分布.html")

因为爬取的是当前热门榜单上的歌曲,忽略了能上榜的歌曲评论几乎是近期的时间,这一点想的还不够完善,
不过从日期上看,数据的爬取不够全面,有的歌曲发行时间很早,相关的评论却没有几条到如今依然仍在榜单上,说明好的歌曲是可以源远流长,经过时间的流逝依然火热。
五.程序源码
import json
import time
import requests

headers = {
        'Host': 'music.163.com',
        'User-Agent': 'Mozilla/5.0 (Windows NT 6.1; WOW64) AppleWebKit/537.36 (KHTML, like Gecko) Chrome/63.0.3239.132 Safari/537.36'
}


def get_comments(page):
    """
        获取评论信息
    """
    url = 'https://music.163.com/api/v1/resource/comments/R_SO_4_2004684052?limit=20&offset=' + str(page)
    response = requests.get(url=url, headers=headers)
    # 将字符串转为json格式
    result = json.loads(response.text)
    items = result['comments']
    for item in items:
        # 用户名
        user_name = item['user']['nickname'].replace(',', ',')
        # 用户ID
        user_id = str(item['user']['userId'])
        # 获取用户信息
        user_message = get_user(user_id)
        # 用户年龄
        user_age = str(user_message['age'])
        # 用户性别
        user_gender = str(user_message['gender'])
        # 用户所在地区
        user_city = str(user_message['city'])
        # 个人介绍
        user_introduce = user_message['sign'].strip().replace('\n', '').replace(',', ',')
        # 评论内容
        comment = item['content'].strip().replace('\n', '').replace(',', ',')
        # 评论ID
        comment_id = str(item['commentId'])
        # 评论点赞数
        praise = str(item['likedCount'])
        # 评论时间
        date = time.localtime(int(str(item['time'])[:10]))
        date = time.strftime("%Y-%m-%d %H:%M:%S", date)
        print(user_name, user_id, user_age, user_gender, user_city, user_introduce, comment, comment_id, praise, date)

        with open('music_comments.csv', 'a', encoding='utf-8-sig') as f:
            f.write(user_name + ',' + user_id + ',' + user_age + ',' + user_gender + ',' + user_city + ',' + user_introduce + ',' + comment + ',' + comment_id + ',' + praise + ',' + date + '\n')
        f.close()


def get_user(user_id):
    """
    获取用户注册时间
    """
    data = {}
    url = 'https://music.163.com/api/v1/user/detail/' + str(user_id)
    # 使用2808proxy代理
    response = requests.get(url=url, headers=headers)
    # 将字符串转为json格式
    js = json.loads(response.text)
    if js['code'] == 200:
        # 性别
        data['gender'] = js['profile']['gender']
        # 年龄
        if int(js['profile']['birthday']) < 0:
            data['age'] = 0
        else:
            data['age'] = (2018 - 1970) - (int(js['profile']['birthday']) // (1000 * 365 * 24 * 3600))
        if int(data['age']) < 0:
            data['age'] = 0
        # 城市
        data['city'] = js['profile']['city']
        # 个人介绍
        data['sign'] = js['profile']['signature']
    else:
        data['gender'] = '无'
        data['age'] = '无'
        data['city'] = '无'
        data['sign'] = '无'
    return data


def main():
    for i in range(0, 25000, 20):
        print('\n---------------第 ' + str(i // 20 + 1) + ' 页---------------')
        get_comments(i)


if __name__ == '__main__':
    main()

import pandas as pd

# 读取数据
df = pd.read_csv('music.csv', header=None, names=['name', 'userid', 'age', 'gender', 'city', 'text', 'comment', 'commentid', 'praise', 'date'], encoding='utf-8-sig')
# 根据评论ID去重
df = df.drop_duplicates('commentid')
# 分组汇总
user_message = df.groupby(['userid'])
user_com = user_message['userid'].agg(['count'])
user_com.reset_index(inplace=True)
user_com_last = user_com.sort_values('count', ascending=False)[0:10]
print(user_com_last)
import pandas as pd
from pyecharts import Line

# 读取数据
df = pd.read_csv('music.csv',low_memory=False, header=None, names=['name', 'userid', 'age', 'gender', 'city', 'text', 'comment', 'commentid', 'praise', 'date'], encoding='utf-8-sig')
# 根据评论ID去重
df = df.drop_duplicates('commentid')
# 获取评论日期
df['time'] = pd.to_datetime([str(i).split(' ')[0] for i in df['date']])

# 分组汇总
date_message = df.groupby(['time'])
date_com = date_message['time'].agg(['count'])
date_com.reset_index(inplace=True)

# 绘制走势图
attr = date_com['time']
v1 = date_com['count']
line = Line("歌曲发布后评论的日期分布", title_pos='center', title_top='22', width=1000, height=600)
line.add("", attr, v1, is_smooth=True, is_fill=True, area_color="#000", is_xaxislabel_align=True, xaxis_min="dataMin", area_opacity=0.3, mark_point=["max"], mark_point_symbol="pin", mark_point_symbolsize=55)
line.render("热门歌曲评论的日期分布.html")
from wordcloud import WordCloud
import matplotlib.pyplot as plt
import pandas as pd
import random
import jieba


# 设置文本随机颜色
def random_color_func(word=None, font_size=None, position=None, orientation=None, font_path=None, random_state=None):
    h, s, l = random.choice([(188, 72, 53), (253, 63, 56), (12, 78, 69)])
    return "hsl({}, {}%, {}%)".format(h, s, l)


# 读取信息
df = pd.read_csv('music.csv', header=None, names=['name', 'userid', 'age', 'gender', 'city', 'text', 'comment', 'commentid', 'praise', 'date'], encoding='utf-8-sig')
# 根据评论ID去重
df = df.drop_duplicates('commentid')
words = pd.read_csv('chineseStopWords.txt', encoding='gbk', sep='\t', names=['stopword'])
# 分词
text = ''
for line in df['comment']:
    text += ' '.join(jieba.cut(str(line), cut_all=False))
# 停用词
stopwords = set('')
stopwords.update(words['stopword'])
backgroud_Image = plt.imread('music.jpg')

wc = WordCloud(
    background_color='white',
    mask=backgroud_Image,
    font_path='C:/Windows/Fonts/STCAIYUN.TTF',
    max_words=2000,
    max_font_size=250,
    min_font_size=15,
    color_func=random_color_func,
    prefer_horizontal=1,
    random_state=50,
    stopwords=stopwords
)

wc.generate_from_text(text)
# 看看词频高的有哪些
process_word = WordCloud.process_text(wc, text)
sort = sorted(process_word.items(), key=lambda e: e[1], reverse=True)
print(sort[:50])
plt.imshow(wc)
plt.axis('off')
wc.to_file("网易云音乐评论词云.jpg")
print('生成词云成功!')
import pandas as pd
from pyecharts import Bar
# 读取数据
df = pd.read_csv('music.csv',low_memory=False, header=None, names=['name', 'userid', 'age', 'gender', 'city', 'text', 'comment', 'commentid', 'praise', 'date'], encoding='utf-8-sig')
# 根据评论ID去重
df = df.drop_duplicates('commentid')
# 去除无年龄信息的
df = df[df.age != 'null']

# 分组汇总
age_message = df.groupby(['age'])
age_com = age_message['age'].agg(['count'])
age_com.reset_index(inplace=True)

# 生成柱状图
attr = age_com['age']
v1 = age_com['count']
bar = Bar("热门歌曲评论用户的年龄分布", title_pos='center', title_top='18', width=800, height=400)
bar.add("", attr, v1, is_stack=True, is_label_show=False)
bar.render("热门歌曲评论用户的年龄分布.html")
import pandas as pd
from pyecharts import Map


def city_group(cityCode):
    """
    城市编码
    """
    city_map = {
        '11': '北京',
        '12': '天津',
        '31': '上海',
        '50': '重庆',
        '5e': '重庆',
        '81': '香港',
        '82': '澳门',
        '13': '河北',
        '14': '山西',
        '15': '内蒙古',
        '21': '辽宁',
        '22': '吉林',
        '23': '黑龙江',
        '32': '江苏',
        '33': '浙江',
        '34': '安徽',
        '35': '福建',
        '36': '江西',
        '37': '山东',
        '41': '河南',
        '42': '湖北',
        '43': '湖南',
        '44': '广东',
        '45': '广西',
        '46': '海南',
        '51': '四川',
        '52': '贵州',
        '53': '云南',
        '54': '西藏',
        '61': '陕西',
        '62': '甘肃',
        '63': '青海',
        '64': '宁夏',
        '65': '新疆',
        '71': '台湾',
        '10': '其他',
    }
    cityCode = str(cityCode)
    return city_map[cityCode[:2]]


# 读取数据
df = pd.read_csv('music.csv',low_memory=False, header=None, names=['name', 'userid', 'age', 'gender', 'city', 'text', 'comment', 'commentid', 'praise', 'date'], encoding='utf-8-sig')
# 根据评论ID去重
df = df.drop_duplicates('commentid')
# 进行省份匹配
df['location'] = df['city'].apply(city_group)

# 分组汇总
loc_message = df.groupby(['location'])
loc_com = loc_message['location'].agg(['count'])
loc_com.reset_index(inplace=True)

# 绘制地图
value = [i for i in loc_com['count']]
attr = [i for i in loc_com['location']]
map = Map("热门歌曲评论用户的地区分布图", title_pos='center', title_top=0)
map.add("", attr, value, maptype="china", is_visualmap=True, visual_text_color="#000", is_map_symbol_show=False, visual_range=[0, 600])
map.render('热门歌曲评论用户的地区分布图.html')
import pandas as pd
from pyecharts import Pie

# 读取数据
df = pd.read_csv('music.csv',low_memory=False, header=None, names=['name', 'userid', 'age', 'gender', 'city', 'text', 'comment', 'commentid', 'praise', 'date'], encoding='utf-8-sig')
# 根据评论ID去重
df = df.drop_duplicates('commentid')
# 去除无性别信息的
df = df[df.gender != 0]
df = df[df.gender != 3]

# 分组汇总
gender_message = df.groupby(['gender'])
gender_com = gender_message['gender'].agg(['count'])
gender_com.reset_index(inplace=True)

# 生成饼图
attr = ['男', '女']
v1 = gender_com['count']
pie = Pie("热门歌曲评论用户的性别情况", title_pos='center', title_top=0)
pie.add("", attr, v1, radius=[40, 75], label_text_color=None, is_label_show=True, legend_orient="vertical", legend_pos="left", legend_top="%10")
pie.render("热门歌曲评论用户的性别情况.html")
六.总结
  根据对网易云音乐评论的爬取,通过年龄,歌曲评价,性别等等分析。可以了解现代青年对歌曲的评价,进而创作出更符合当代年轻人的歌曲所好,
但是仅仅是对一款音乐平台的爬取是不够的,需要更为全面的数据才能分析出更为准确的趋势。
本次项目发现了自身存在许多的不足,数据的理解不够全面等等诸多原因,也发现了Python的魅力所在,在今后的日子中,不断学习进步,学会使用更多的技术,相信不远的将来,就能实现。
