
python性能分析器:cProfile
代码:
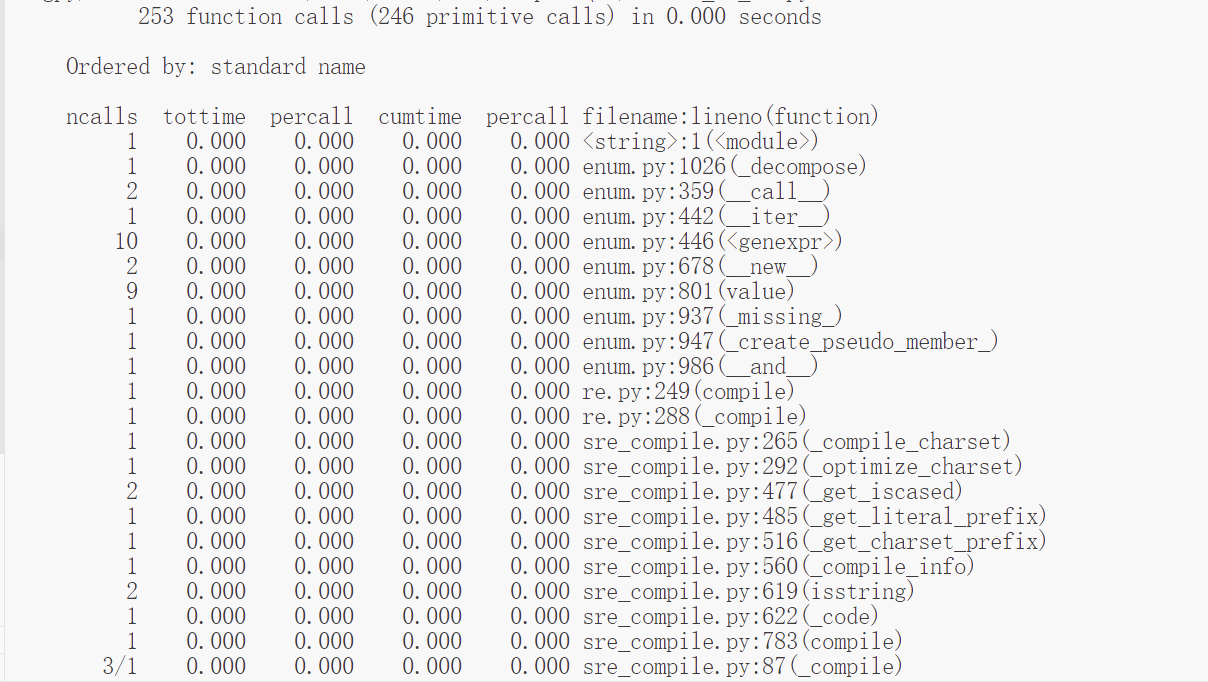
(1)
import cProfile
import re
cProfile.run('re.compile("foo|bar")')
运行结果:
(2)
import cProfile
def runRe():
    import re
    cProfile.runctx('re.compile("foo|bar")', None, locals())
runRe()
运行结果:
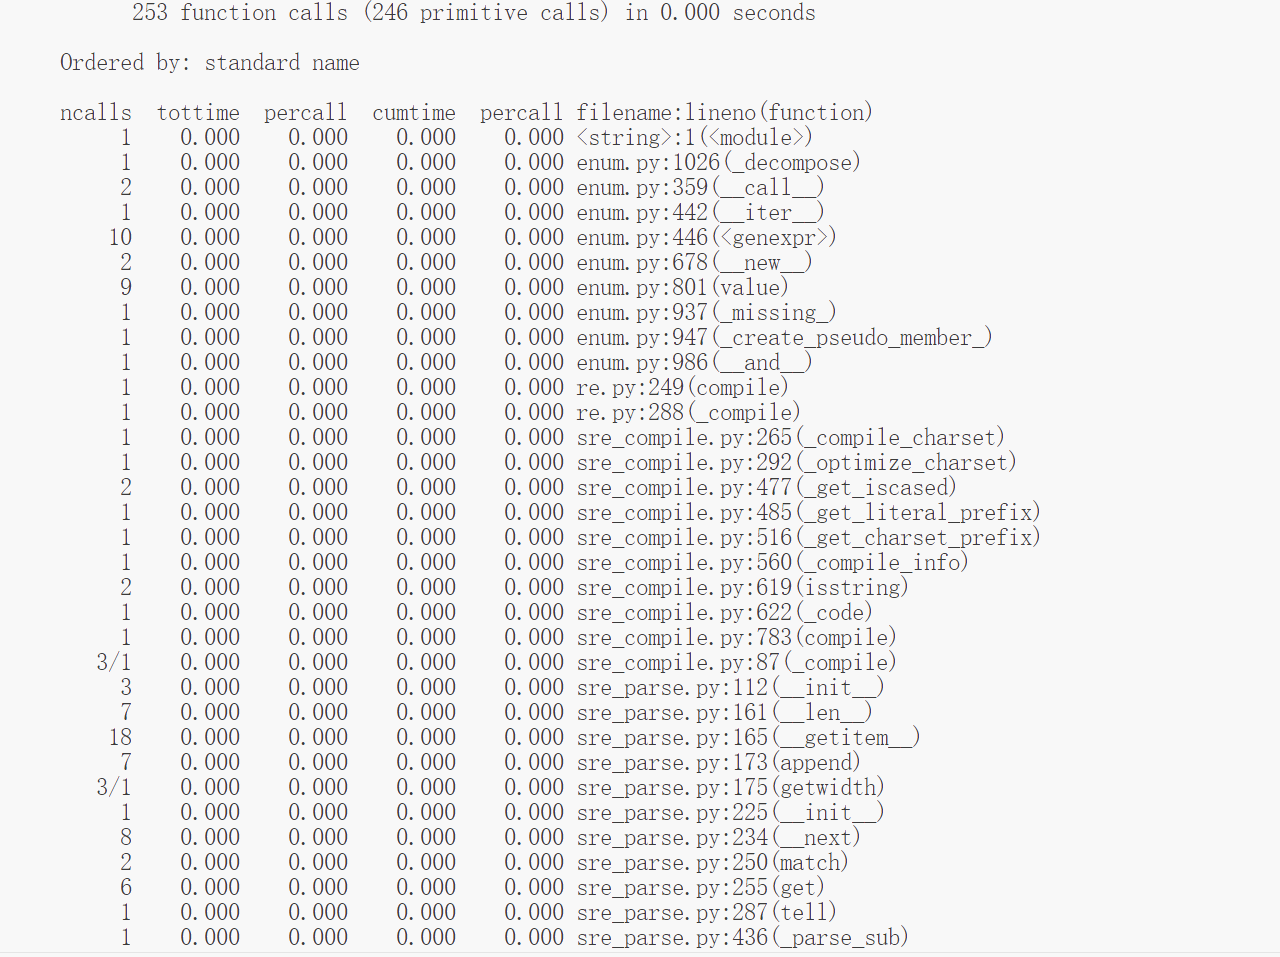
(3)
import cProfile

import re
def runRe():
    re.compile("foo|bar")

prof = cProfile.Profile()
prof.enable()
runRe()
prof.create_stats()
prof.print_stats()
运行结果:
(4)
# import cProfile

import re
def runRe():
    re.compile("foo|bar")

# prof = cProfile.Profile()
# prof.enable()
runRe()
# prof.create_stats()
# prof.print_stats()
运行结果:
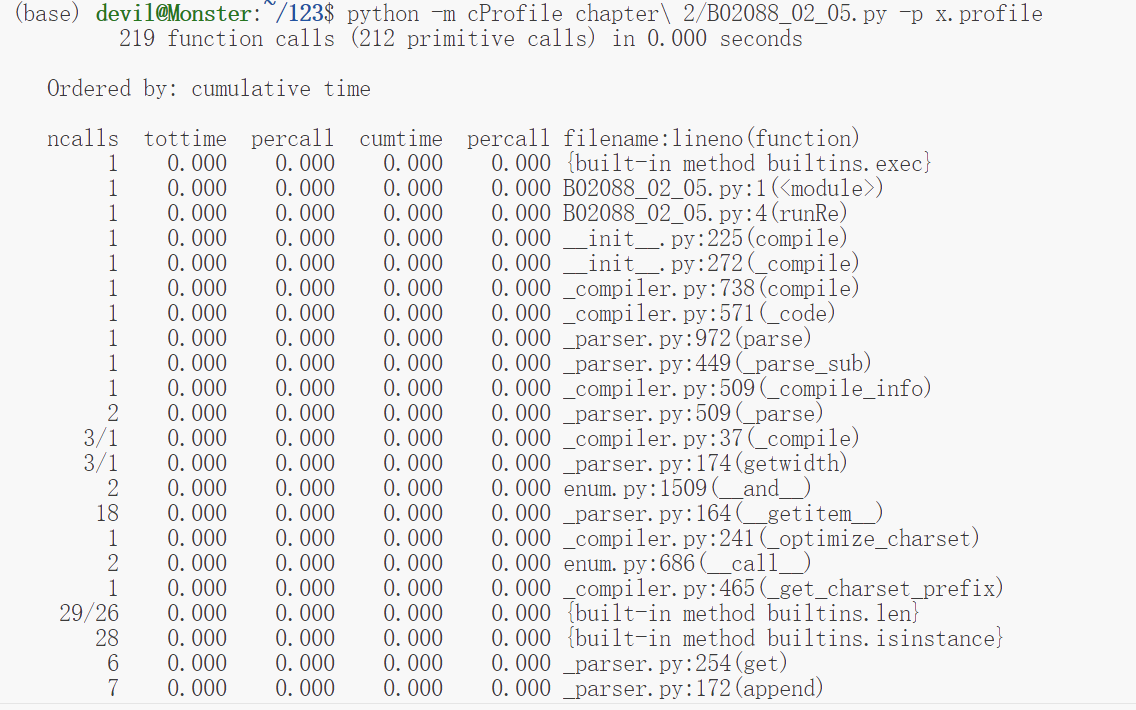
python -m cProfile -o x.profile x.py
需要注意的是,如果写成:
python -m cProfile x.py -o x.profile
那么就不会生成x.profile文件。
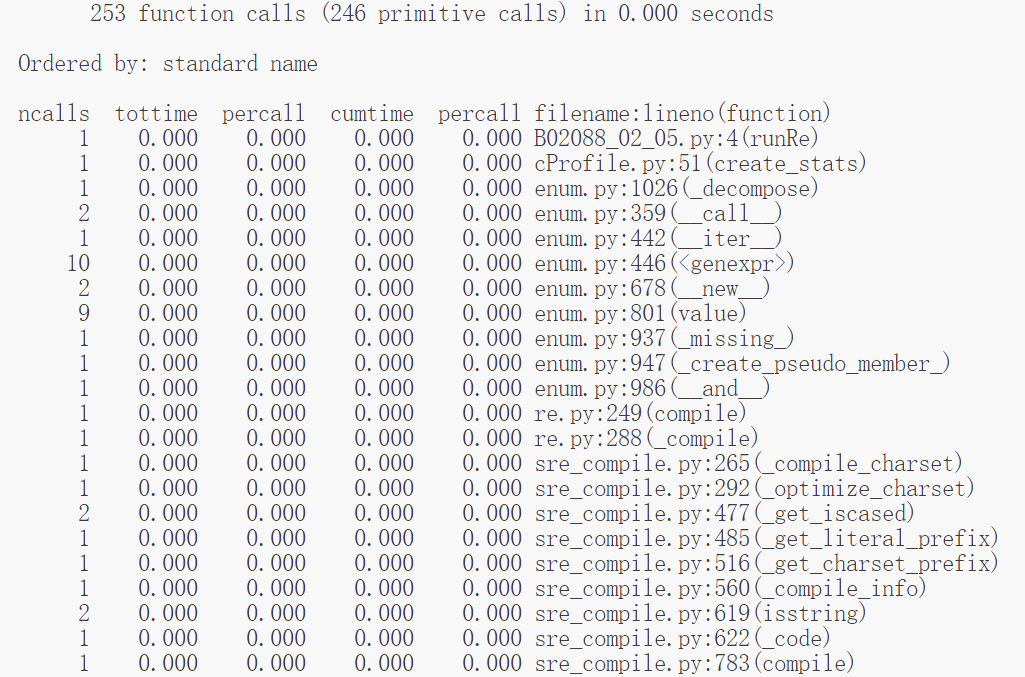
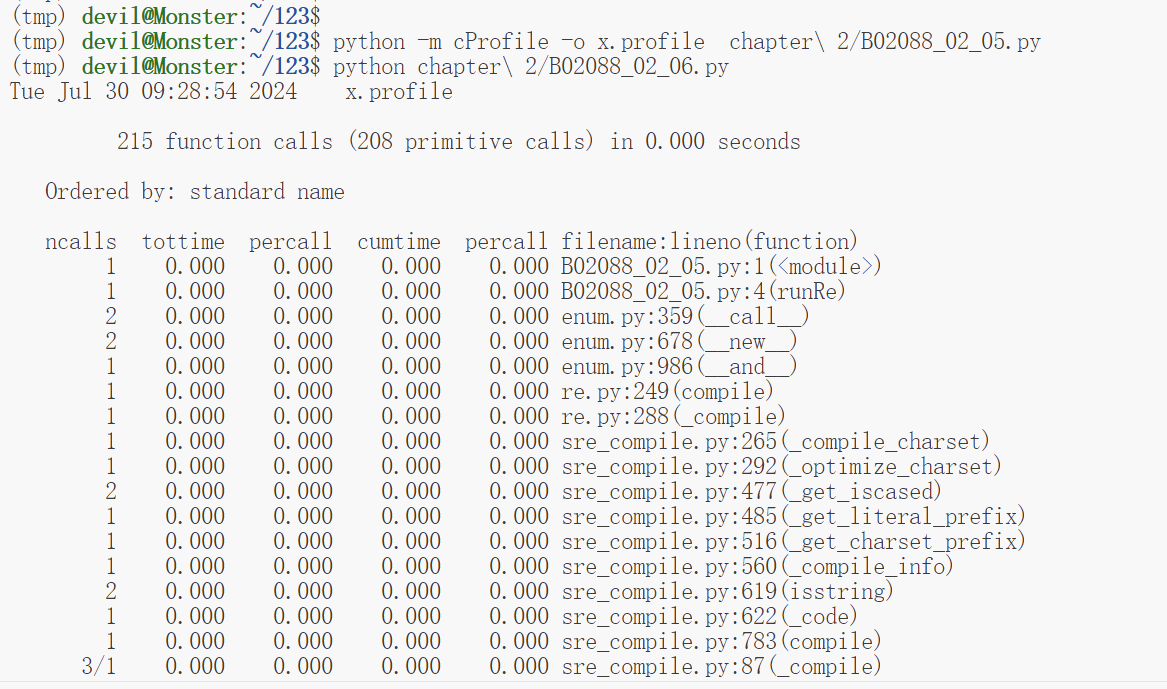
(5)
对生成的性能文件x.profile进行内容解析和打印:
import pstats
p = pstats.Stats('x.profile')
p.strip_dirs().sort_stats(-1).print_stats()
运行结果:
(6)
import cProfile
import pstats

def runRe():
    import re
    re.compile("foo|bar")
prof = cProfile.Profile()
prof.enable()
runRe()
prof.create_stats()

p = pstats.Stats(prof)
p.print_callers()
本博客是博主个人学习时的一些记录,不保证是为原创,个别文章加入了转载的源地址,还有个别文章是汇总网上多份资料所成,在这之中也必有疏漏未加标注处,如有侵权请与博主联系。
如果未特殊标注则为原创,遵循 CC 4.0 BY-SA 版权协议。
posted on 2024-07-30 08:55 Angry_Panda 阅读(53) 评论(0) 收藏 举报


 浙公网安备 33010602011771号