
面对问题
欠拟合
在训练集与测试集都不能获得很好的拟合数据时,认为该假设出现了欠拟合(模型过于简单)
-
原因:模型学习到样本特征太少
-
解决:增加样本的特征数量(多项式回归)
过拟合
在训练集上能获得较好拟合,在训练集以外的数据集上却不能很好的拟合数据
-
原因:原始特征过多,存在一些嘈杂特征
-
解决:
-
进行特征选择,消除关联性大的特征(很难)
-
正则化之岭回归(掌握)
-
欠拟合
-
不使用多项式时实验代码
from sklearn.linear_model import LinearRegression
import numpy as np
import matplotlib.pyplot as plt
# 样本的训练数据,特征和目标值
x_train = [[6], [8], [10], [14], [18]] # 大小
y_train = [[7], [9], [13], [17.5], [18]] # 大小
# 一次线性回归的学习与预测y=wx+b
regressor = LinearRegression()
test_1 = regressor.fit(x_train, y_train)
print(test_1)
# 画出一次线性回归的拟合曲线
xx = np.linspace(0, 25, 100)
xx = xx.reshape(-1, 1)
yy = regressor.predict(xx)
plt.scatter(x_train, y_train)
plt.plot(xx, yy)
plt.show()
# 得出一条直线
多项式回归
-
添加高次项特征构造
-
主要使用工具
PolynomialFeatures
-
使用sklearn.preprocessing.PolynomialFeatures来进行告辞特征构造
-
使用多项式的方法来进行,如果有a, b两个特征,那么它的2次多项式为(1, a, b, a^2, ab, b^2 )
-
PolynomialFeatures有三个参数
-
degree:控制多项式的度
-
interaction_only:默认为false,如果指定为trye,那么就不会有特征自己和自己结合的项,上面的二次项中没有a^2和b^2
-
include_bias:默认为true,如果为false,那么就不会有1的一项
-
-
from sklearn.preprocessing import PolynomialFeatures
c = [[5, 10]]
p1 = PolynomialFeatures()
b = p1.fit_transform(c)
print(b)
[[ 1. 5. 10. 25. 50. 100.]]
Process finished with exit code 0
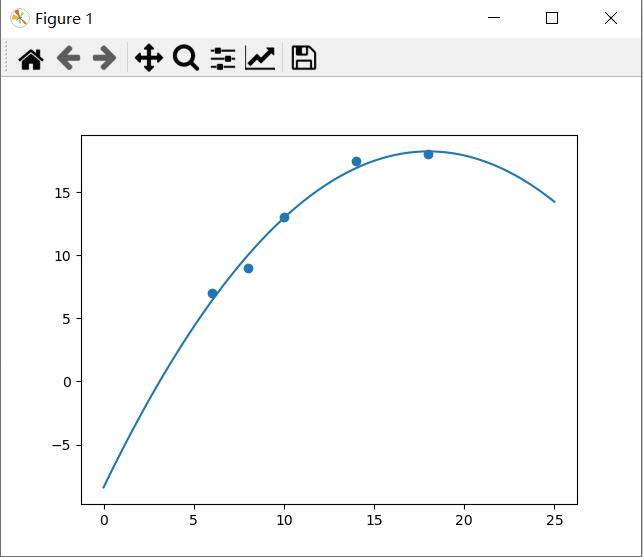
使用PolynomialFeatures
from sklearn.preprocessing import PolynomialFeatures
from sklearn.linear_model import LinearRegression
import numpy as np
import matplotlib.pyplot as plt
# 样本的训练数据,特征和目标值
x_train = [[6], [8], [10], [14], [18]] # 大小
y_train = [[7], [9], [13], [17.5], [18]] # 大小
# 使用PolynomialFeatures
poly2 = PolynomialFeatures(degree=2)
x_train_poly2 = poly2.fit_transform(x_train)
# 一次线性回归的学习与预测y=wx+b
regressor_poly2 = LinearRegression()
regressor_poly2.fit(x_train_poly2, y_train)
# 画出一次线性回归的拟合曲线
xx = np.linspace(0, 25, 100)
xx = xx.reshape(-1, 1)
xx_poly2 = poly2.fit_transform(xx)
yy_poly2 = regressor_poly2.predict(xx_poly2)
plt.scatter(x_train, y_train)
plt.plot(xx, yy_poly2, label="Degree2")
plt.show()
# 得出一条曲线
![]()

 浙公网安备 33010602011771号