echarts绘制世界地图
一、
一定要给高度和宽度,不然不出效果
二、
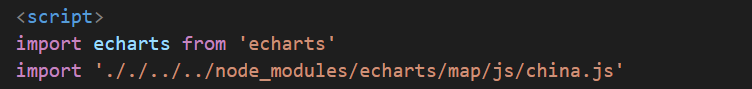
在方法中初始化 echars官网有详细介绍(https://echarts.apache.org/v4/examples/zh/index.html#chart-type-line)

三、引入china.js如果你引入不成功,检查echarts版本
建议版本:(5.0版本引不到china.js)
四、代码展示
let option = {
tooltip: {
formatter: '{b}: {c}',//鼠标滑过展示的内容调整
},
visualMap: {
min: 0,//数值的最大值和最小值
max: 2000,
orient: 'horizontal',
realtime: false,
calculable: true,
align: 'bottom',
left: 30,//位置
top: 30,
inRange: {
color: ['#C62238', '#FFA056'], // 地图渐变的颜色
},
},
geo: {
map: 'china', //中国地图/其他省份就改写shanghai
roam: true,
label: {
normal: {
show: true,
textStyle: {
color: 'rgba(0,0,0,0.4)',
},
},
},
itemStyle: {
normal: {
borderColor: 'rgba(0, 0, 0, 0.2)',
areaColor: '#ccdaff',
},
emphasis: {
areaColor: '#FFD05D', // 地图划过显示的颜色
shadowOffsetX: 0,
shadowOffsetY: 0,
shadowBlur: 20,
borderWidth: 0,
shadowColor: 'rgba(0, 0, 0, 0.5)',
},
},
},
series: [
{
type: 'map',
roam: true,
coordinateSystem: 'geo',
geoIndex: 0,
label: {
normal: {
formatter: '{b}',
position: 'right',
show: false,
},
emphasis: {
show: true,
},
},
itemStyle: {
normal: {
color: '#F06C00',
},
},
data: data.mapList,
},
],
}
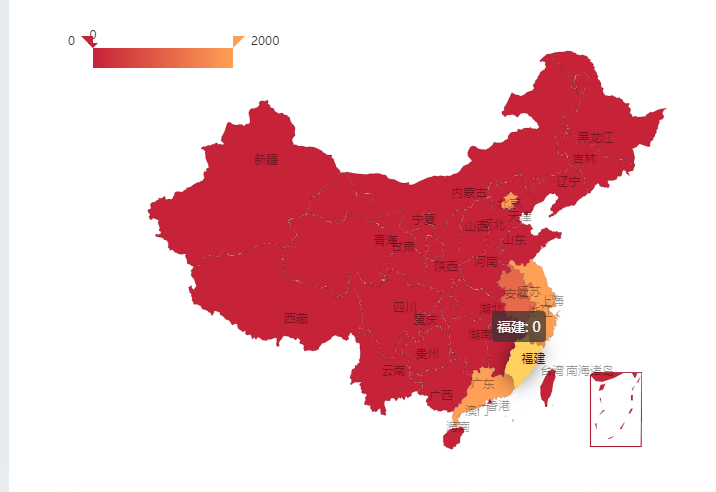
附上效果图:
本文来自博客园,作者:danmo_xx,转载请注明原文链接:https://www.cnblogs.com/xx321/p/15849922.html

 浙公网安备 33010602011771号