
docker安装filebeat采集本地日志并检索到Elastic搭建Kibana呈现
1、filebeat安装
https://www.elastic.co/guide/en/beats/filebeat/current/running-on-docker.html
拉取镜像
docker pull docker.elastic.co/beats/filebeat:8.1.0
创建容器
docker run -d --name=filebeat docker.elastic.co/beats/filebeat:8.1.0
复制配置文件到本地
docker cp filebeat:/usr/share/filebeat /Users/xuweiqiang/Documents/filebeat
再删除镜像
docker stop filebeat

docker rm filebeat
重新启动filebeat\磁盘挂载\加入网络
# 启动filebeat镜像

docker run -d --name=filebeat -v ~/nginx/www/tmp:/tmp -v /Users/xuweiqiang/Documents/filebeat:/usr/share/filebeat --network one_net --network-alias filebeat docker.elastic.co/beats/filebeat:8.1.0
更改 Documents/filebeat里面的配置 filebeat.yml (红色字是增加的部分)

filebeat.inputs:
- type: log
  enabled: true
  encoding: utf-8
  paths:
    - /tmp/*.log
  fields:
    tag: 'service-springboot'

filebeat.config:
  modules:
    path: ${path.config}/modules.d/*.yml
    reload.enabled: false

processors:
  - add_cloud_metadata: ~
  - add_docker_metadata: ~

#output.elasticsearch:
#  hosts: '${ELASTICSEARCH_HOSTS:elasticsearch:9200}'
#  username: '${ELASTICSEARCH_USERNAME:}'
#  password: '${ELASTICSEARCH_PASSWORD:}'

#打印到控制台
#output.console:
#  pretty: true
#  enable: true

output.elasticsearch:
  enable: true
  allow_older_versions: true
  # Array of hosts to connect to.
  hosts: ["elasticsearch:9200"]
  indices:
    - index: "service-springboot-%{+yyyy.MM.dd}"
      when.contains:
        fields:
          tag: "service-springboot"
    - index: "security-%{+yyyy.MM.dd}"
      when.contains:
        fields:
          tag: "security"
更新配置以后重启服务
docker restart filebeat
2、容器之间互相访问
a、docker容器之间互访:https://blog.csdn.net/lcgskycby/article/details/108586358
b、docker的network:https://blog.csdn.net/wangyue23com/article/details/111172076
总结:
a、docker run 的参数 --network 可以指定加入某一个内部网络之中,--network-alias可以指定当前网络的别名
b、docker network 可以维护管理网络
创建网络
docker network create one_net

docker network create two_net

#查看网络
docker network ls
部署容器
#加入网络 one_net 别名 jack
docker run -d --name nginx_jack  --network one_net --network-alias jack nginx:latest


#加入网络 one_net 别名 rose
docker run -d --name nginx_rose  --network one_net --network-alias rose nginx:latest


#加入网络 two_net 别名 tom
docker run -d --name nginx_tom  --network two_net --network-alias tom nginx:latest
容器内部安装一些程序
#bash: ifconfig: command not found
apt-get update && apt install net-tools

#bash: ping: command not found
apt-get update && apt install iputils-ping

#bash: ip: command not found
apt-get update && apt-get install -y iproute2

#bash: vi: command not found
apt-get update &&  apt-get install vim
验证网络
# 同一个网络下可以通
$jack : ping -c 3 rose

# 不同网络下不通
$rose : ping -c 3 tome
3. 安装Elastic 这里因为我的是mac pro m1,版本 7.9 支持
docker pull docker.elastic.co/elasticsearch/elasticsearch:7.14.1

docker run -d --name=elastic --network one_net --network-alias elasticsearch -p 9200:9200 -p 9300:9300 -e "discovery.type=single-node" docker.elastic.co/elasticsearch/elasticsearch:7.14.1
4. 确保在filebeat可以 ping elasticsearch 9200 有响应
5. 更改 ~/nginx/www/tmp目录
新增一个 test.log 文件,可以在filebeat容器内部看到采集的信息
6. 查询Elastic看到多了一个索引
http://127.0.0.1:9200/_alias
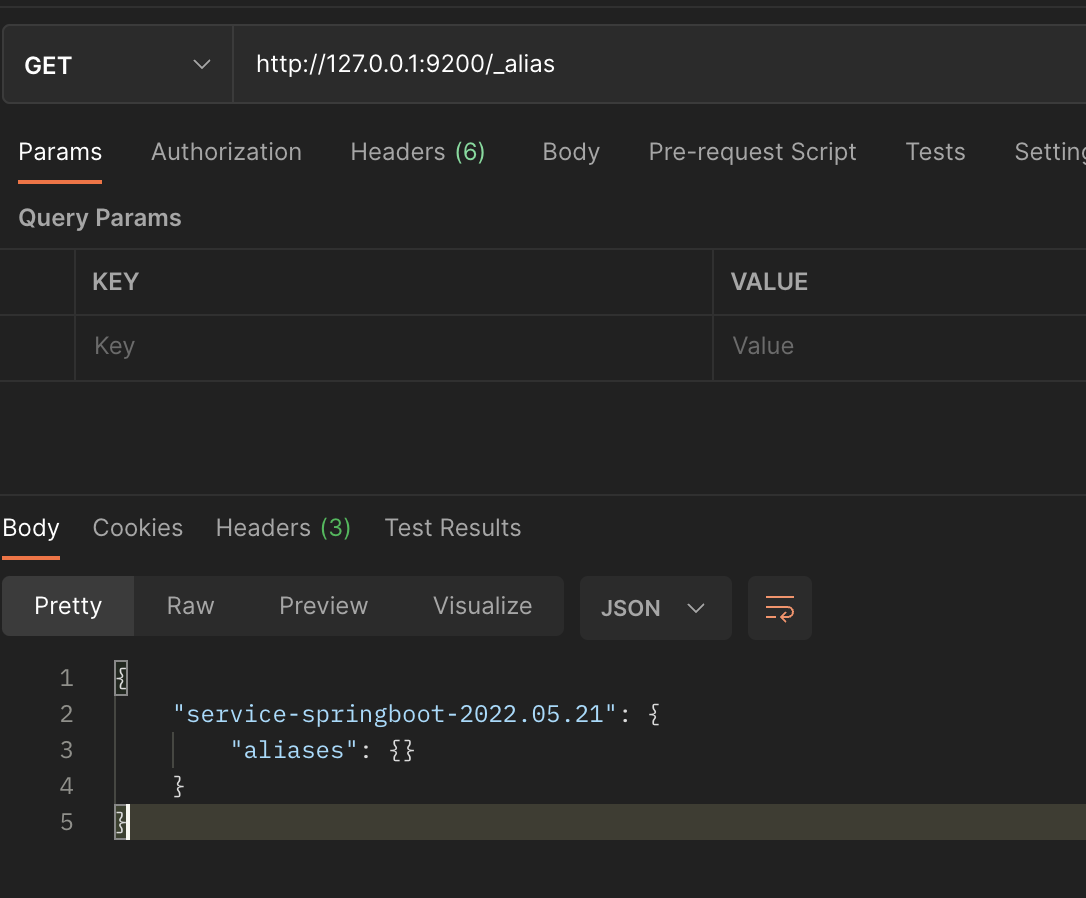
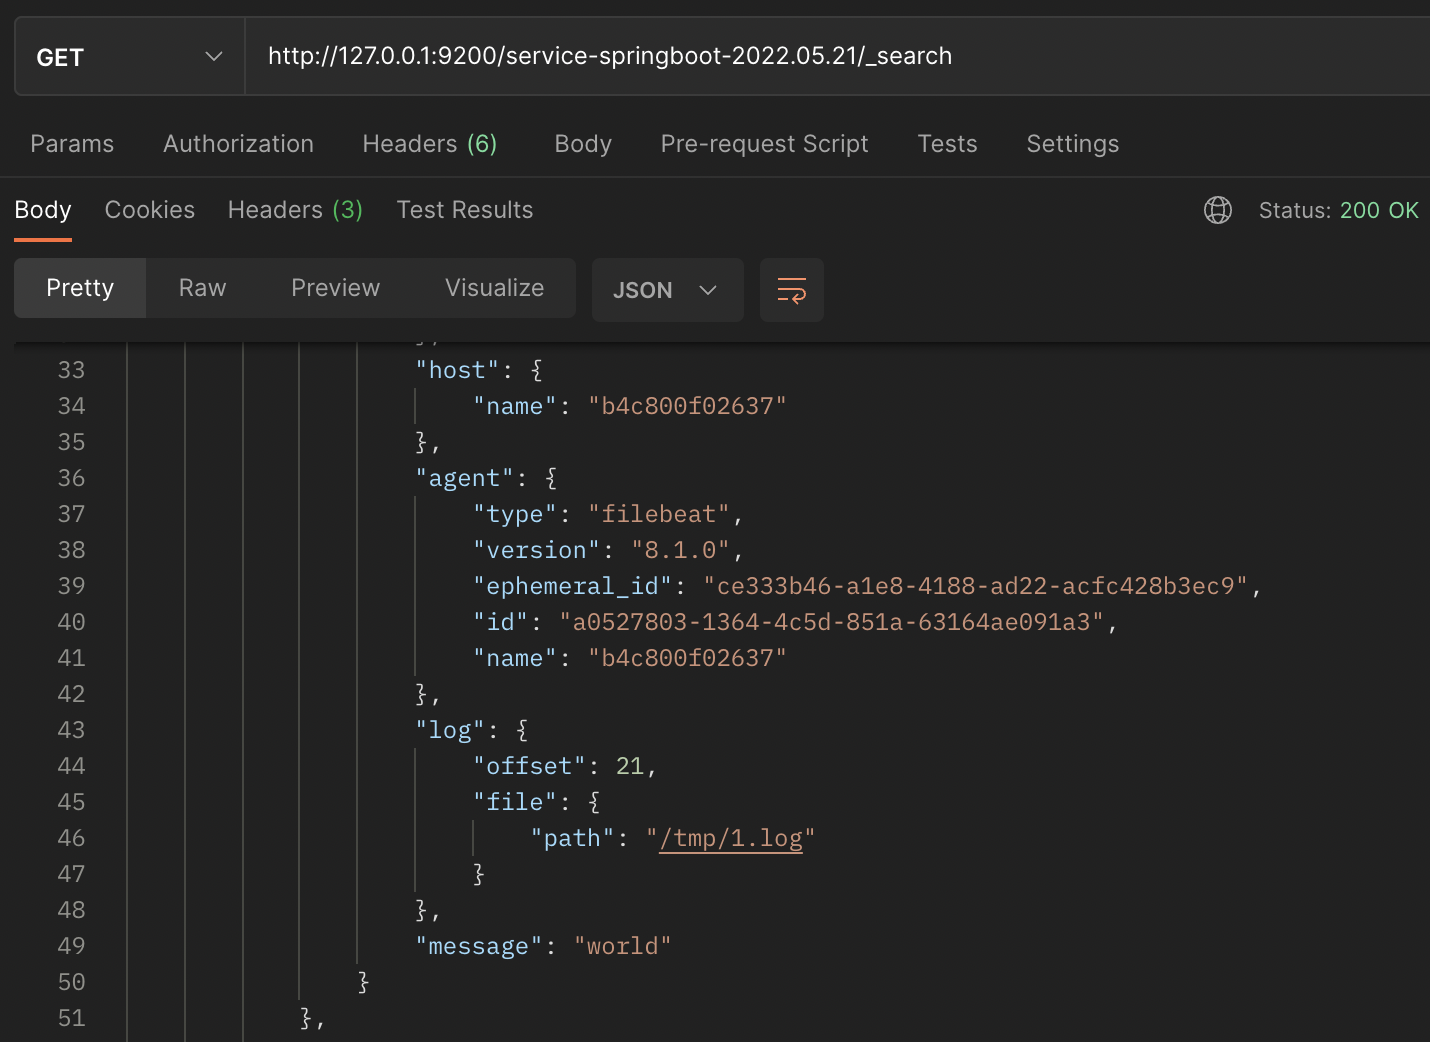
采集到的数据如下:
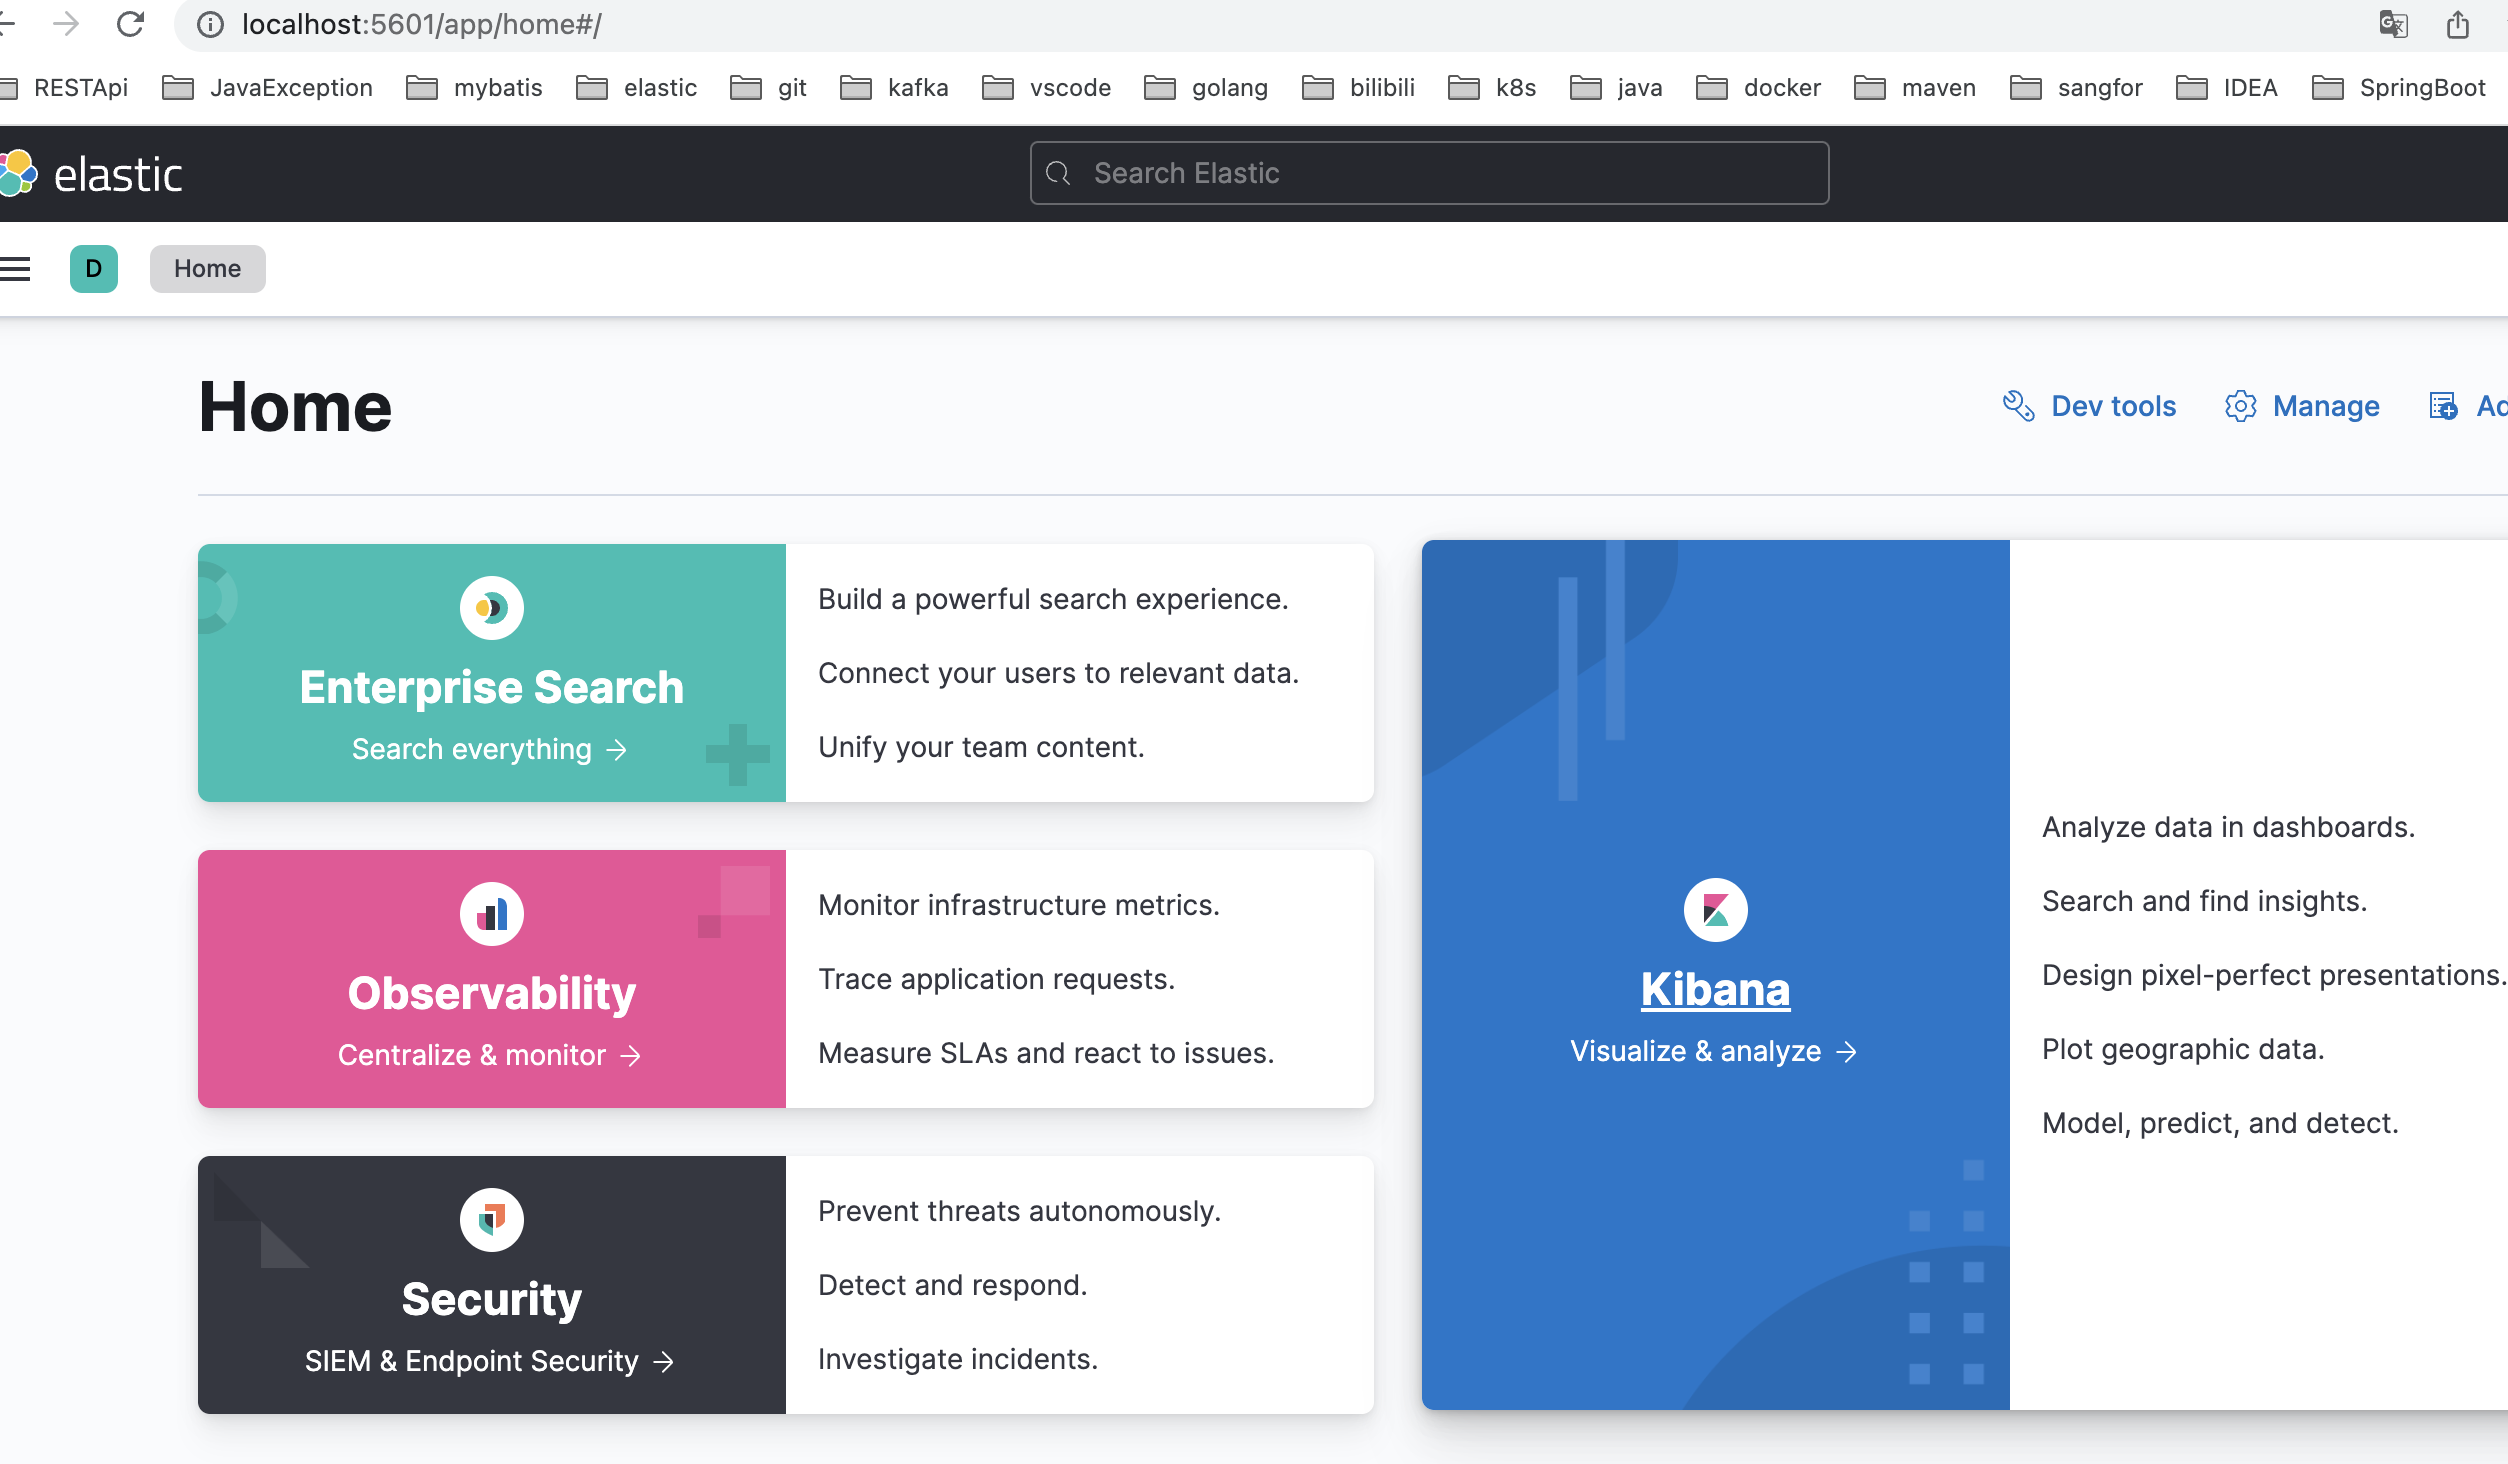
7、安装kibana
docker pull docker.elastic.co/kibana/kibana:7.14.1


docker run -d -p 5601:5601 --network one_net --network-alias kibana -e ELASTICSEARCH_HOSTS=http://elasticsearch:9200 --name kibana docker.elastic.co/kibana/kibana:7.14.1
访问 localhost:5601 可以看到
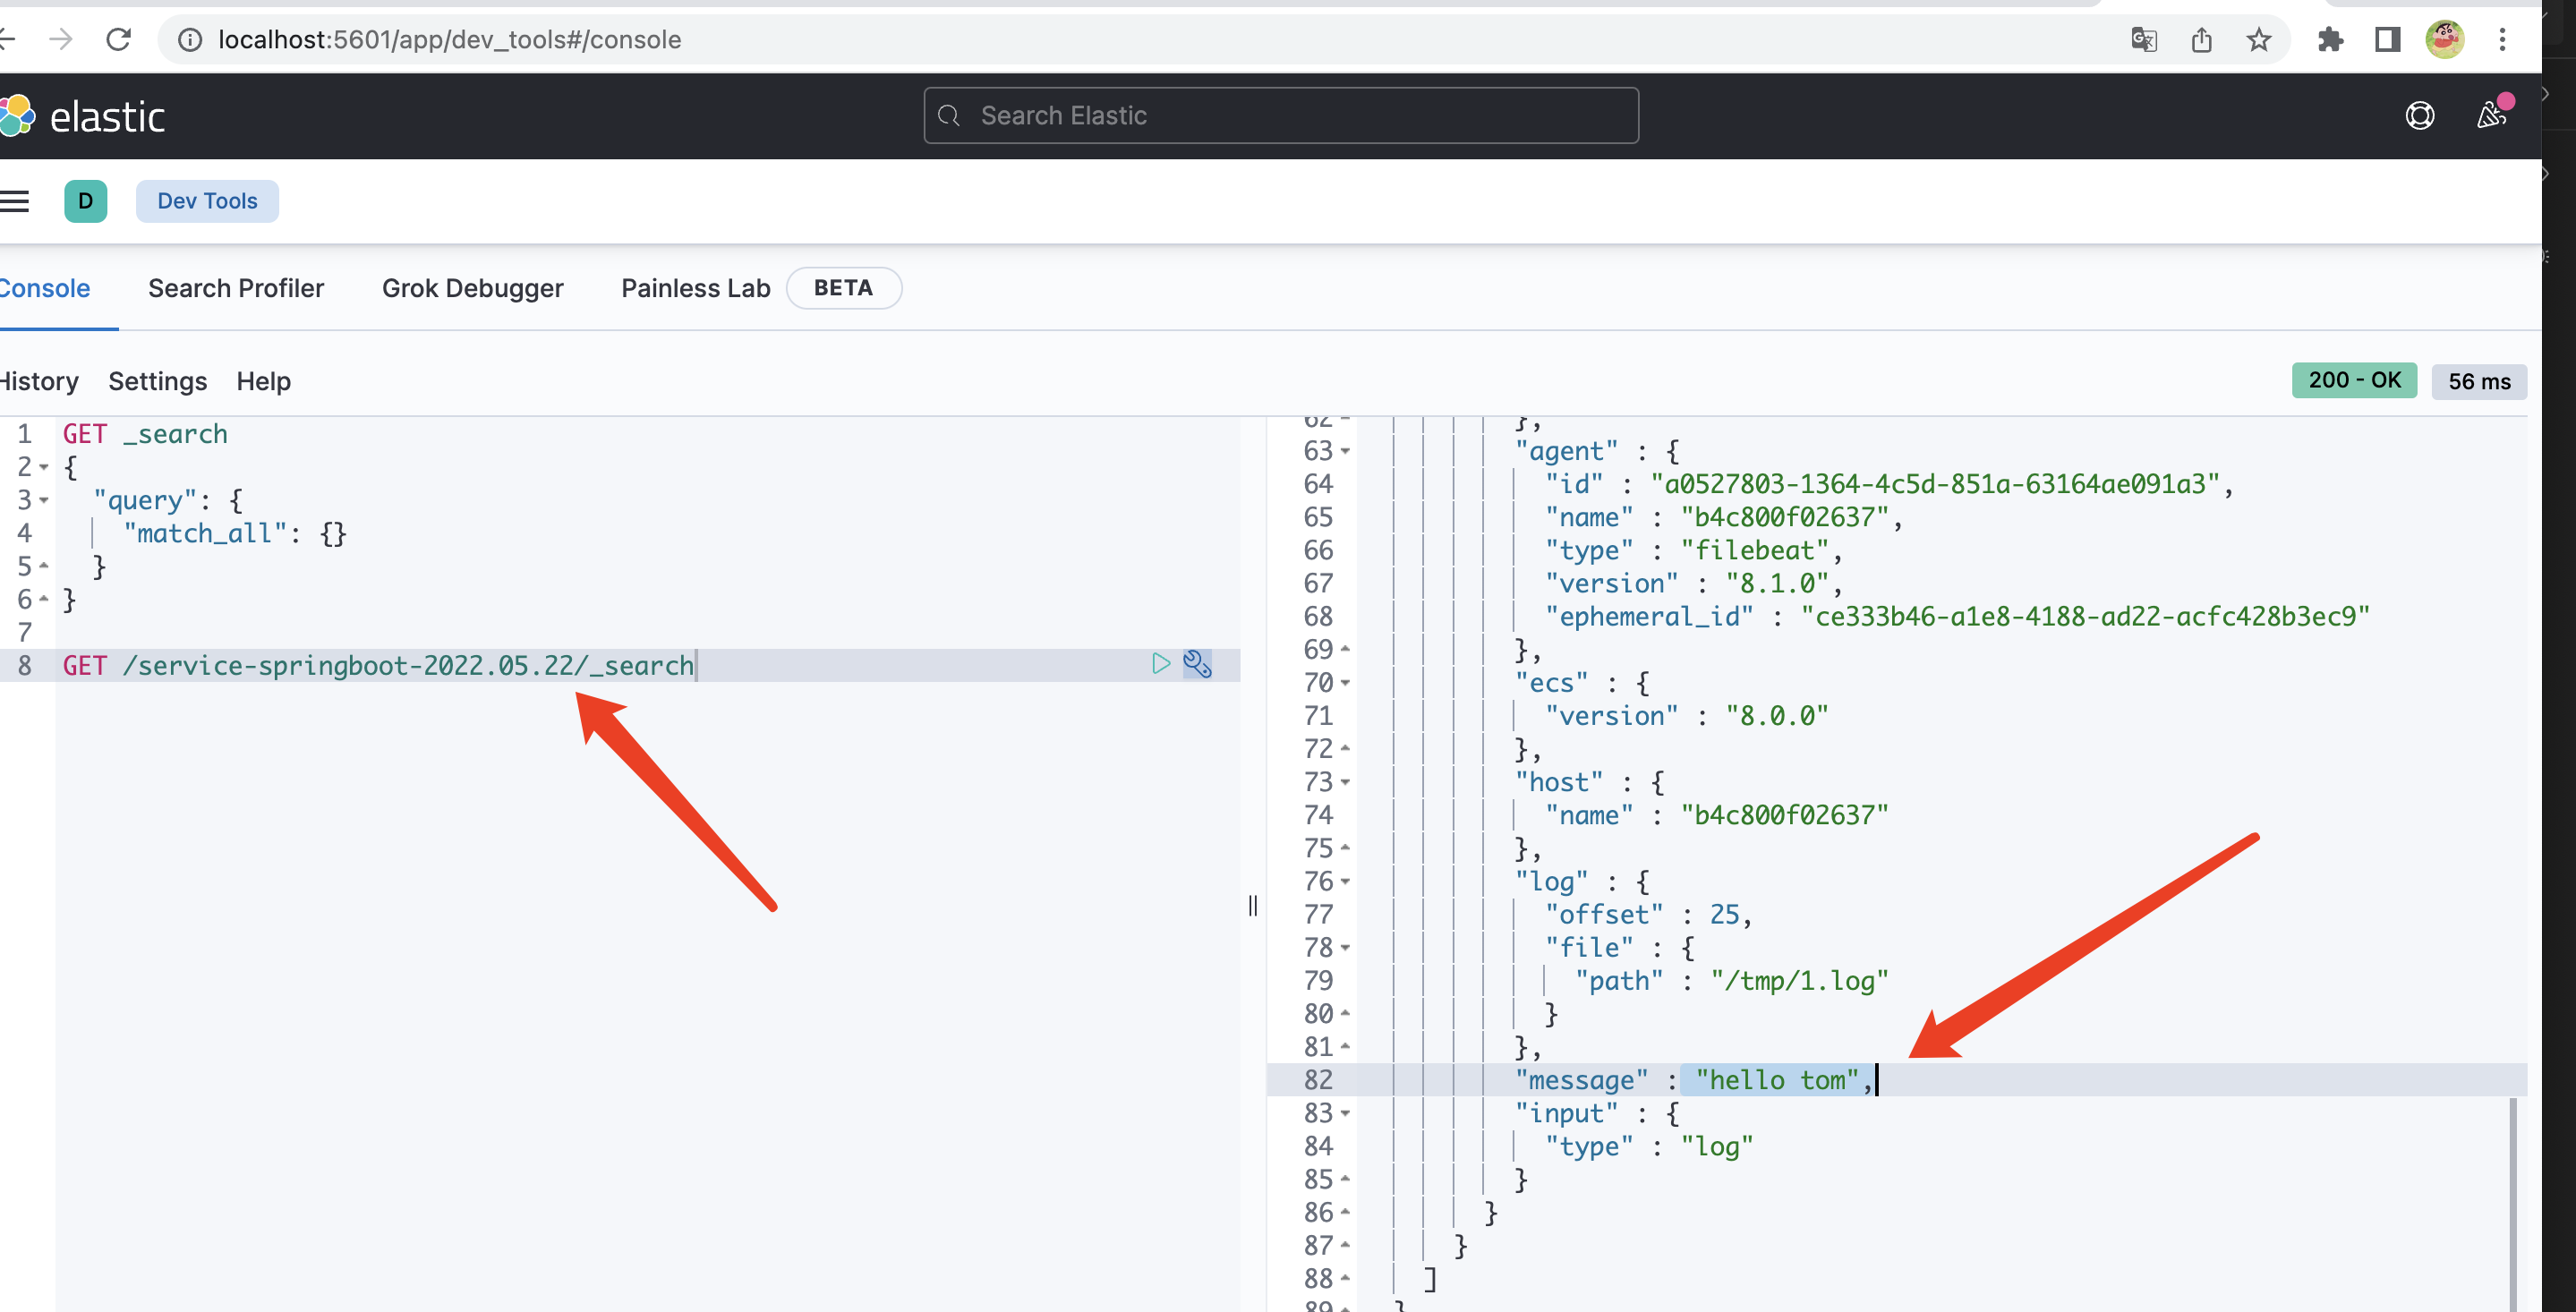
现在添加一条log日志
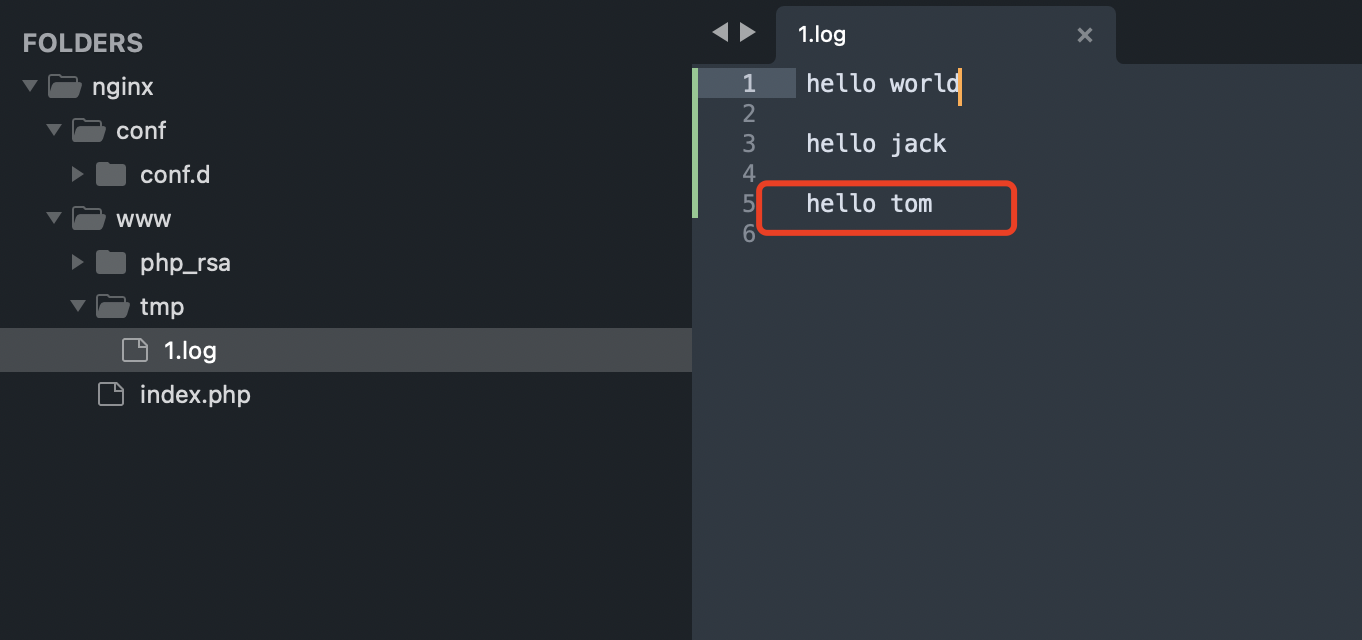
在kibana之中可以查看
注意:
以上的执行顺序不一定是准确的,需要注意的就是 filebeat磁盘挂载 + 和Elastic加入同一个网络 one_net 下;
如果 Elastic 总是连接不上,试着将 output 输出到标准输出看看采集的效果。
参考地址:
docker安装filebeat:https://www.elastic.co/guide/en/beats/filebeat/current/running-on-docker.html
filebeat定义输出:https://www.elastic.co/guide/en/beats/filebeat/current/elasticsearch-output.html
定义输入:https://www.elastic.co/guide/en/beats/filebeat/current/configuration-filebeat-options.html
kibana的基本操作:https://blog.csdn.net/Wsxyi/article/details/123435486
kibana官网手册:https://www.elastic.co/guide/en/kibana/current/index.html
filebeat官网手册:https://www.elastic.co/guide/en/beats/filebeat/current/index.html
8、简单的行日志文件读取配置
假设日志文件是:_test.log
{"security":true,"name":"jacke","age":18,"time":"2020-01-01 09:08:02"}
2022-01-01 12:09:01 [debug] GET 200
{"security":true,"name":"rose","age":19,"time":"2020-01-01 09:08:02"}
目标是将带有security的行日志解析存储到对应的Elastic索引之中,并且json数据解析成字段,配置如下:
1 2 3 4 5 6 7 8 9 10 11 12 13 14 15 16 17 18 19 20 21 22 23 24 25 26 27 28 29 30 31 32 33 34 35 36 37 38 39 40 41 42 43 | filebeat.inputs:# 添加日志文件中读取行通道- type: log # 启用 enabled: true # 文件编码 encoding: utf-8 # 读取的行包含文字 include_lines: ['security'] # 读取的文件路径 paths: - /tmp/*.log # 向输出添加附加信息的可选字段 fields: tag: 'security'filebeat.config: modules: path: ${path.config}/modules.d/*.yml reload.enabled: false# 处理器processors: # json处理器 - decode_json_fields: # 对messgae字段进行json格式解析 fields: ['message'] # 解析后的json字段挂载字段detail下面 target: 'detail'# 添加elasticsearch的输出output.elasticsearch: enable: true # 允许接入其他版本的elasticsearch allow_older_versions: true # 连接地址\允许多个 hosts: ["elasticsearch:9200"] indices: - index: "security_%{+yyyy.MM.dd}" # 当含有tag为security的时候数据写入对应的索引 when.contains: fields: tag: "security" |
解析结果示例:
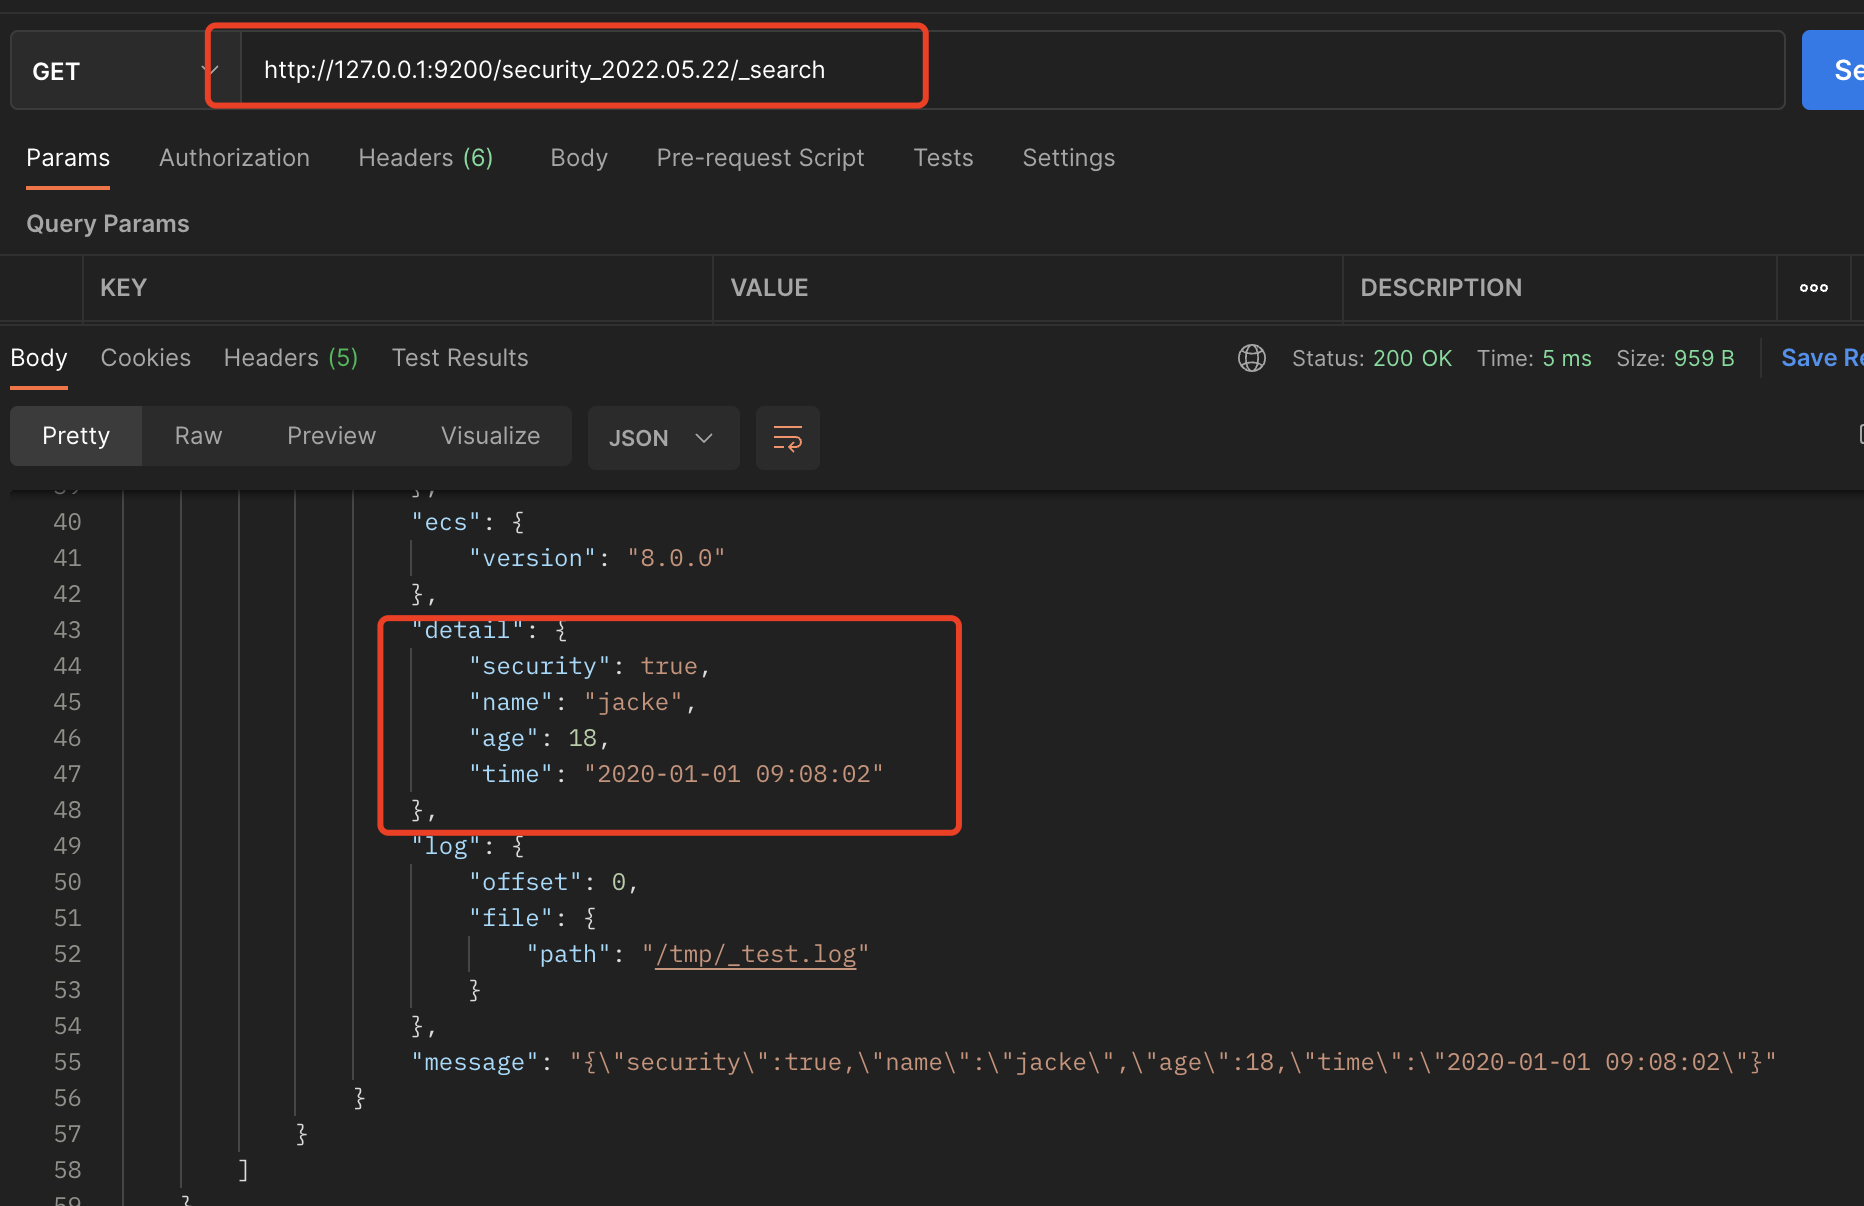
messgae是原始日志


【推荐】国内首个AI IDE,深度理解中文开发场景,立即下载体验Trae
【推荐】编程新体验,更懂你的AI,立即体验豆包MarsCode编程助手
【推荐】抖音旗下AI助手豆包,你的智能百科全书,全免费不限次数
【推荐】轻量又高性能的 SSH 工具 IShell:AI 加持,快人一步
· TypeScript + Deepseek 打造卜卦网站:技术与玄学的结合
· Manus的开源复刻OpenManus初探
· AI 智能体引爆开源社区「GitHub 热点速览」
· 三行代码完成国际化适配,妙~啊~
· .NET Core 中如何实现缓存的预热?