zabbix
Zabbix
【1】、简介
- zabbix是一个高度集成的监控解决方案
- 可以实现企业级的开源分布式监控
- Zabbix通过C/S模式采集监控数据
- Zabbix通过B/S模式实现Web管理
- 实施监控的几个方面
- 数据采集:使用agent(可安装在软件的系统上)、SNMP(简单网络管理协议,用于网络设备的数据采集)
- 数据存储:使用MySQL数据库
- 数据展示:通过web页面
- Zabbix通过在远程主机上安装agent进行数据采集。存储到MySQL数据库,通过web页面进行展示
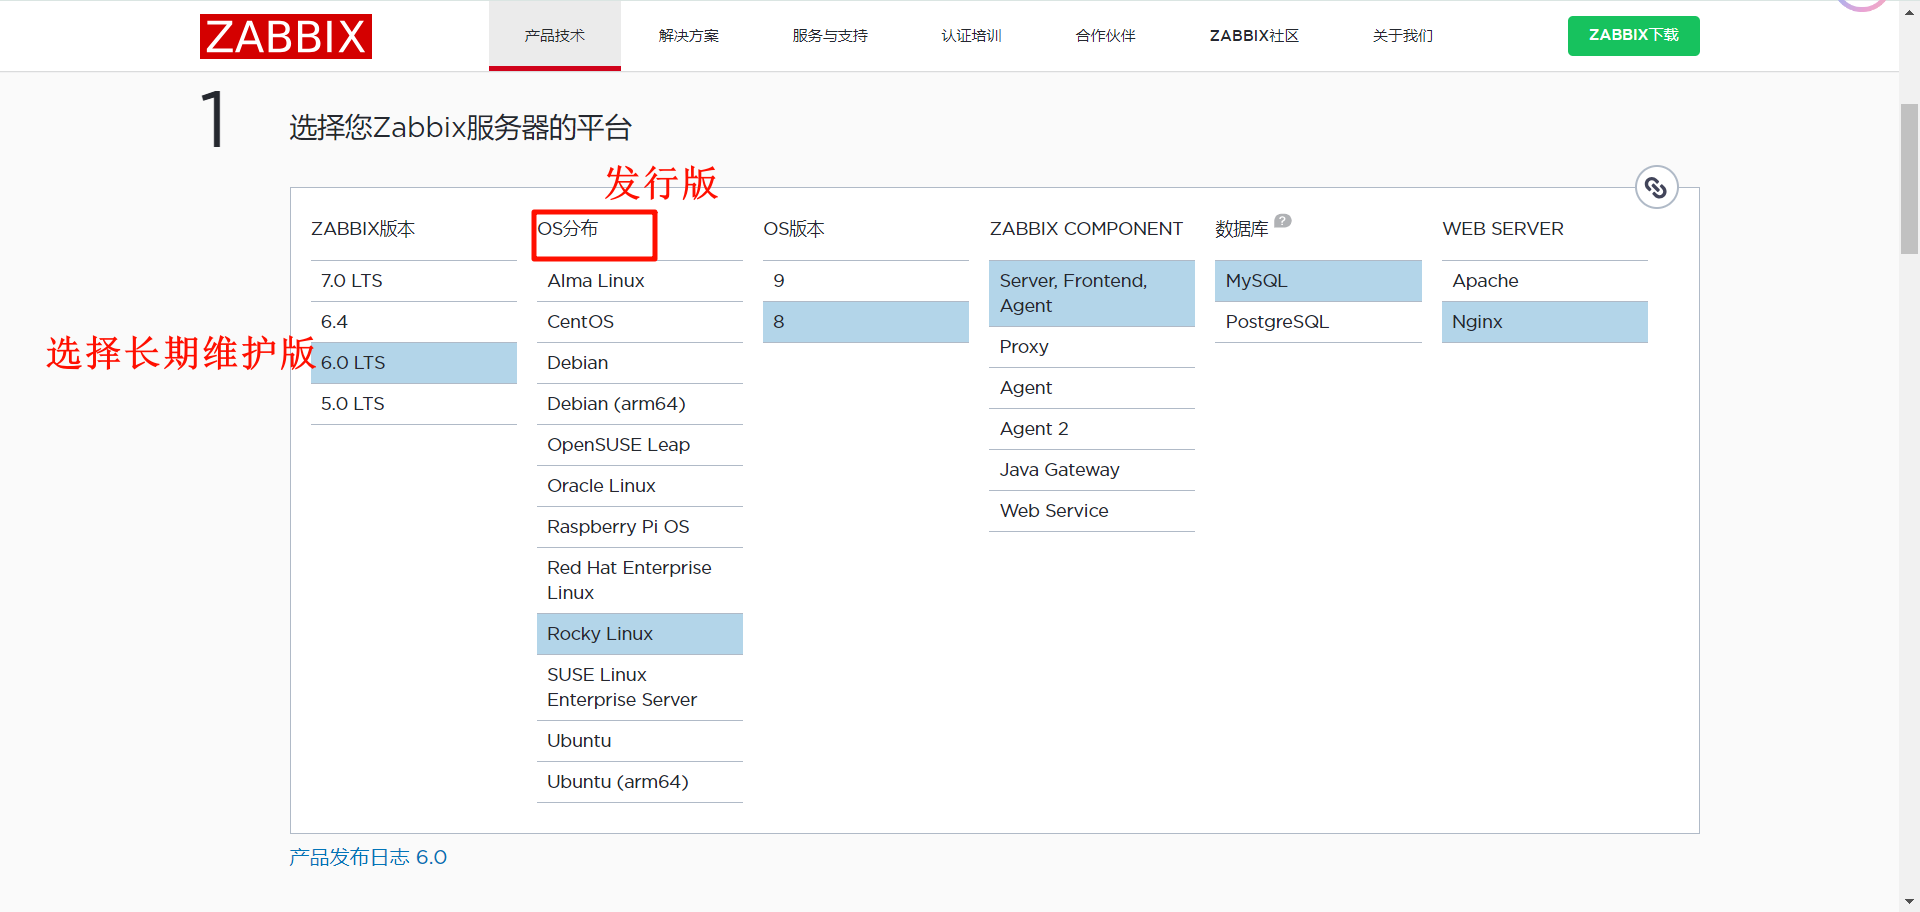
【2】、安装Zabbix6.0
环境准备
| 主机名 | IP |
|---|---|
| ZabbixServer | 192.168.121.5/24 |
| web1 | 192.168.121.100/24 |
| web2 | 192.168.121.200/24 |
# 1、更新软件仓库,清除缓存
rpm -Uvh https://repo.zabbix.com/zabbix/6.0/rhel/8/x86_64/zabbix-release-6.0-4.el8.noarch.rpm
dnf clean all

# 2、装Zabbix server,Web前端,agent、数据库MySQL
dnf install -y zabbix-server-mysql zabbix-web-mysql zabbix-nginx-conf zabbix-sql-scripts zabbix-selinux-policy zabbix-agent mysql-server

# 3、创建初始数据库
mysql
mysql> create database zabbix character set utf8mb4 collate utf8mb4_bin;
mysql> create user zabbix@localhost identified by 'zabbix';
mysql> grant all privileges on zabbix.* to zabbix@localhost;
mysql> set global log_bin_trust_function_creators = 1;
mysql> quit;

# 4、导入初始架构和数据
cp /usr/share/zabbix-sql-scripts/mysql/server.sql.gz .
gzip -d server.sql.gz
mysql -uzabbix -pzabbix < server.sql
【3】、配置zabbix
1、数据收集
配置zabbix-server
# 修改数据库的密码
[root@ZabbixServer:192.168.121.5 ~]$vim  +129 /etc/zabbix/zabbix_server.conf
DBPassword=zabbix
配置zabbix-agent
# 修改主机名
[root@ZabbixServer:192.168.121.5 ~]$vim /etc/zabbix/zabbix_agentd.conf
Hostname=ZabbixServer
2、数据呈现
主配置文件:/etc/nginx/nginx.conf
php配置文件:/etc/nginx/default.d/php.conf
php和nginx连接配置文件:/etc/nginx/conf.d/php-fpm.conf
nginx提供的zabbix的页面配置文件:/etc/nginx/conf.d/zabbix.conf
将 /etc/nginx/conf.d/zabbix.conf的第二行和第三行的注释取消
3、启动服务
---
- name: start server
  hosts: ZabbixServer
  tasks:
    - name: start server
      service:
        name: "{{item}}"
        state: started
        enabled: yes
      loop:
        - zabbix-server
        - zabbix-agent
        - nginx
        - php-fpm
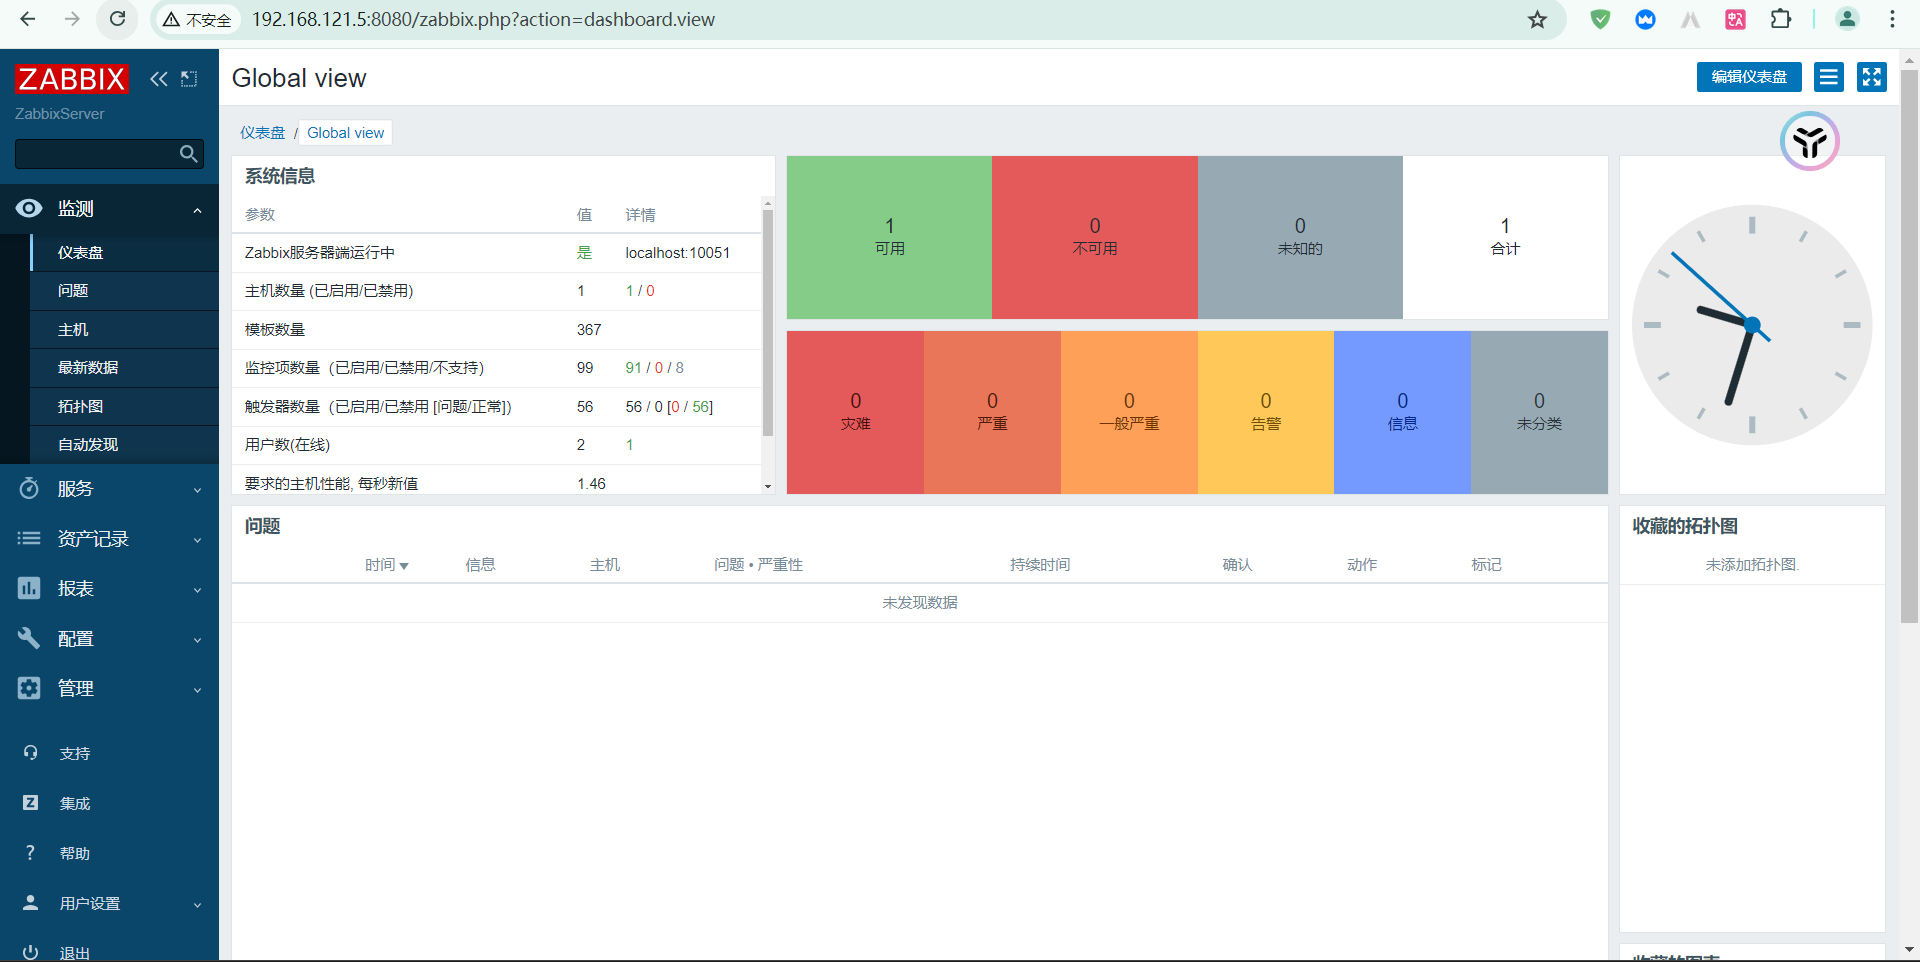
4、访问web页面
# /etc/nginx/conf.d/zabbix.conf,写着nginx监听的端口
server {
        listen          8080;
        server_name     example.com;
在第一次访问时,需要先进行设置、配置、安装
【4】、在客户端安装zabbi-agent
# web1、web2
[root@web2:192.168.121.200 ~]$rpm -Uvh https://repo.zabbix.com/zabbix/6.0/rhel/8/x86_64/zabbix-release-6.0-4.el8.noarch.rpm
[root@web2:192.168.121.200 ~]$yum install -y zabbix-agent

# 修改zabbix-agent的配置文件
vim /etc/zabbix/zabbix-agentd.conf
117 Server=192.168.121.5,127.0.0.1 # 允许192.168.121.5和本机监控自己
# 启动zabbix-agent
systemctl restart zabbix-agent
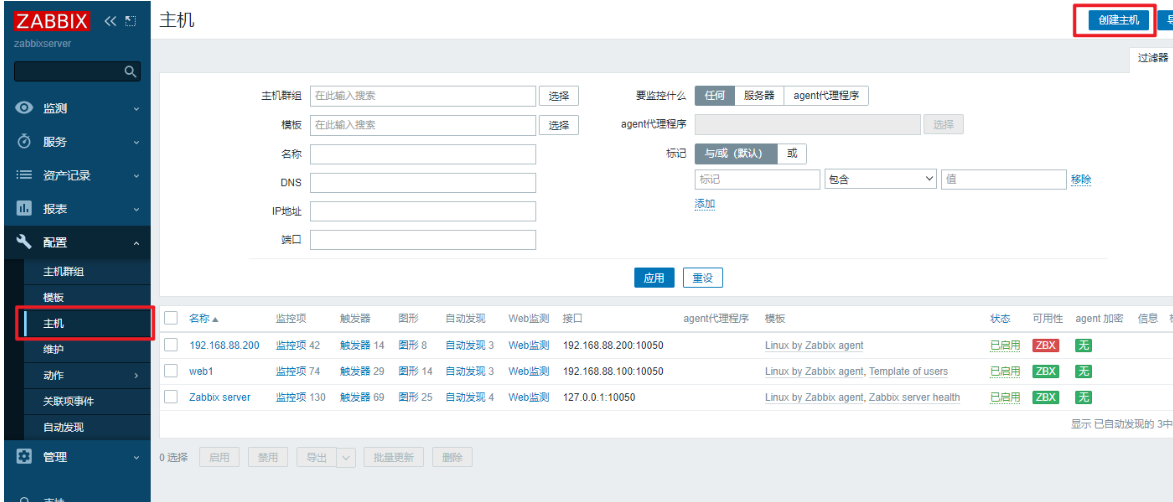
【5】、web页面端操作
zabbix 服务端 zabbix_server 默认使用 10051 端口,客户端 zabbix_agent2 默认使用 10050 端口。
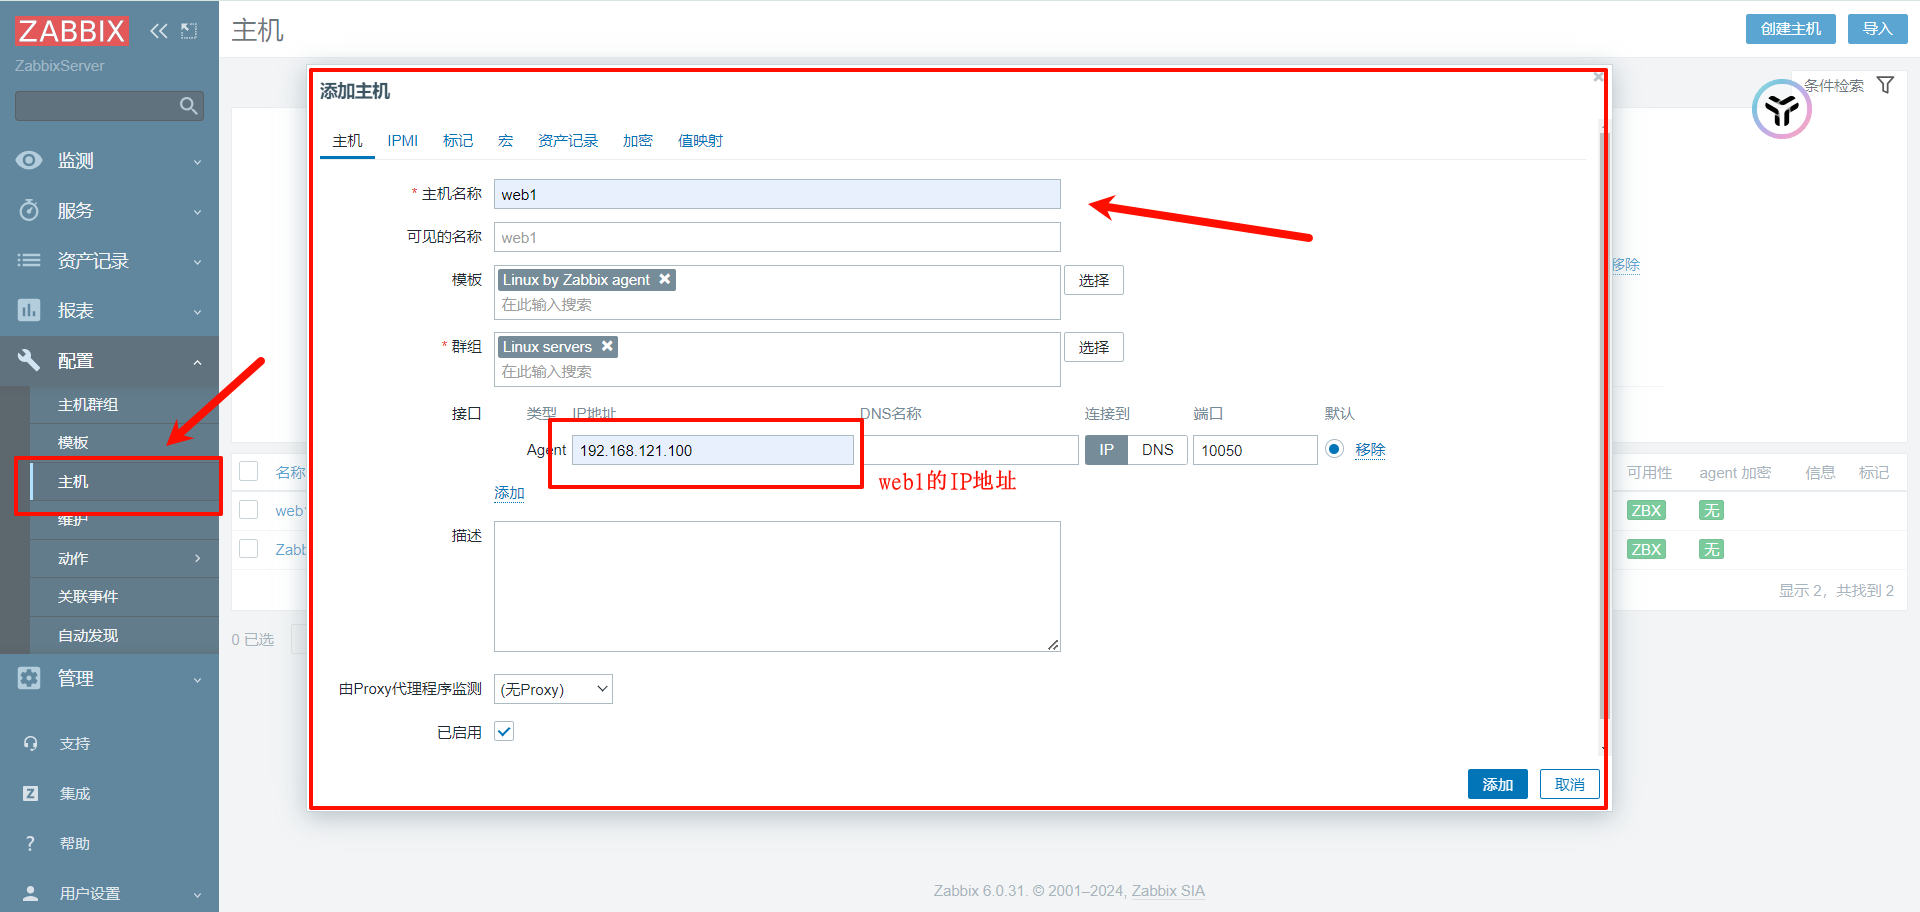
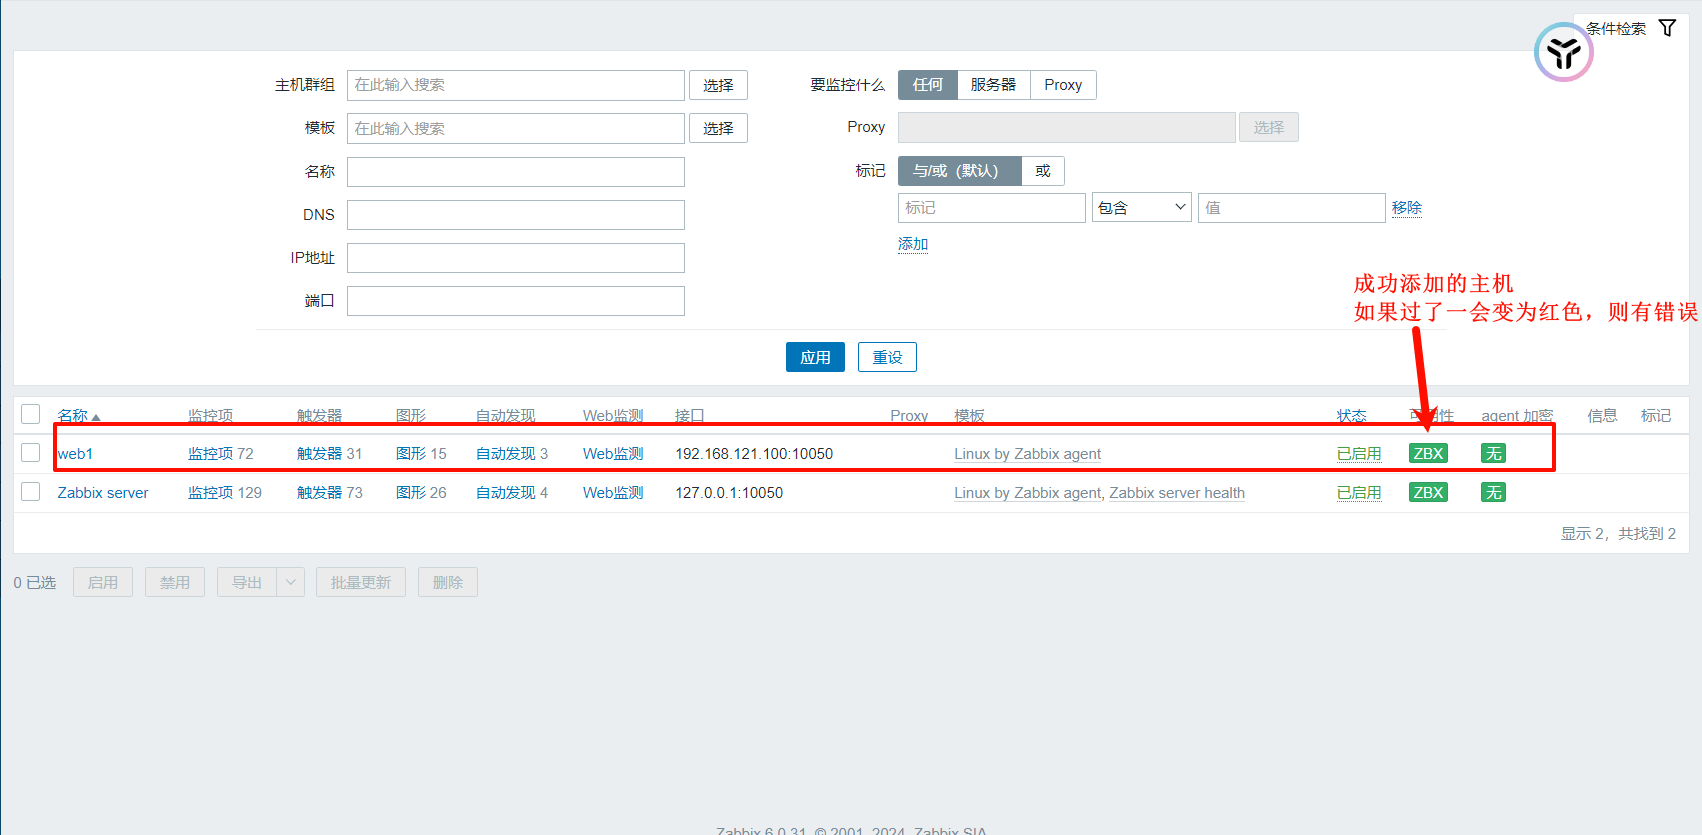
1、添加监控主机
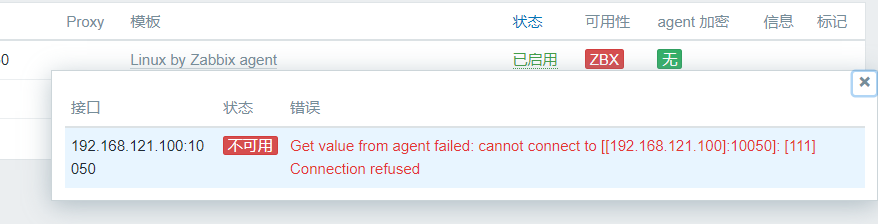
常见报错情况1
这通常是由于web1端的zabbix-agent没有启动,导致10050端口没有开启,所以会出现连接被拒绝的情况,当前也有可能因为防火墙的问题
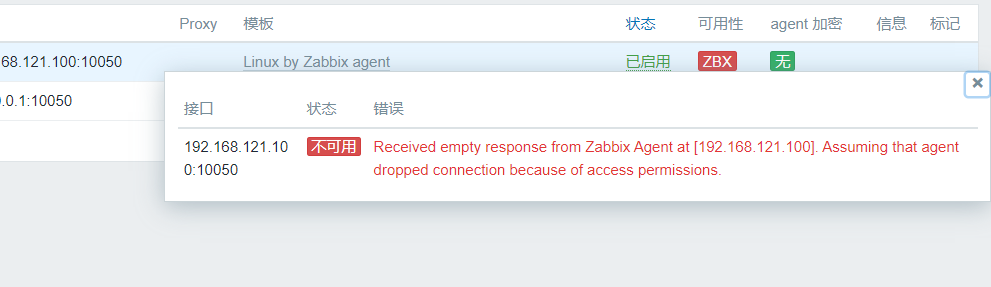
常见报错情况2
这是由于权限被拒绝导致的报错。大概是因为zabbix-server不能连接到zabbix-agent,通常是由于zabbix-agent.conf编写错误导致的,需检查配置文件
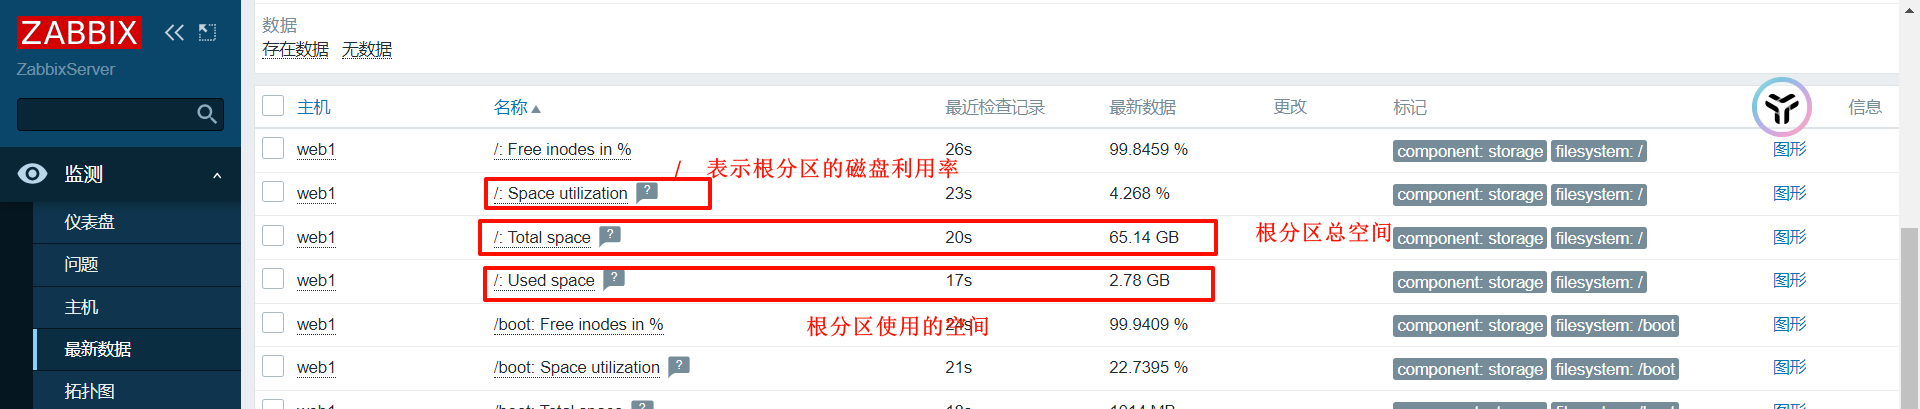
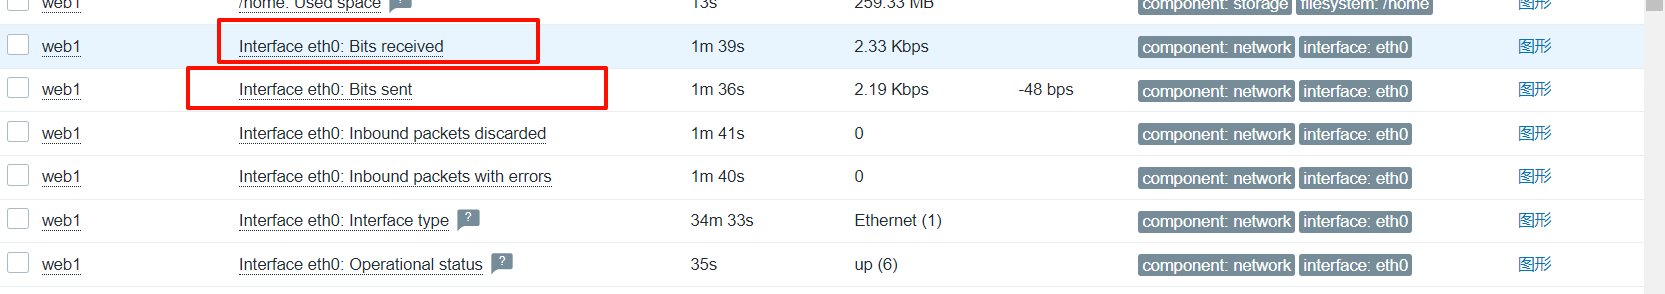
2、系统自带监控项
- Space utilization:以百分比的形式显示磁盘利用率
- Used space:已用磁盘空间
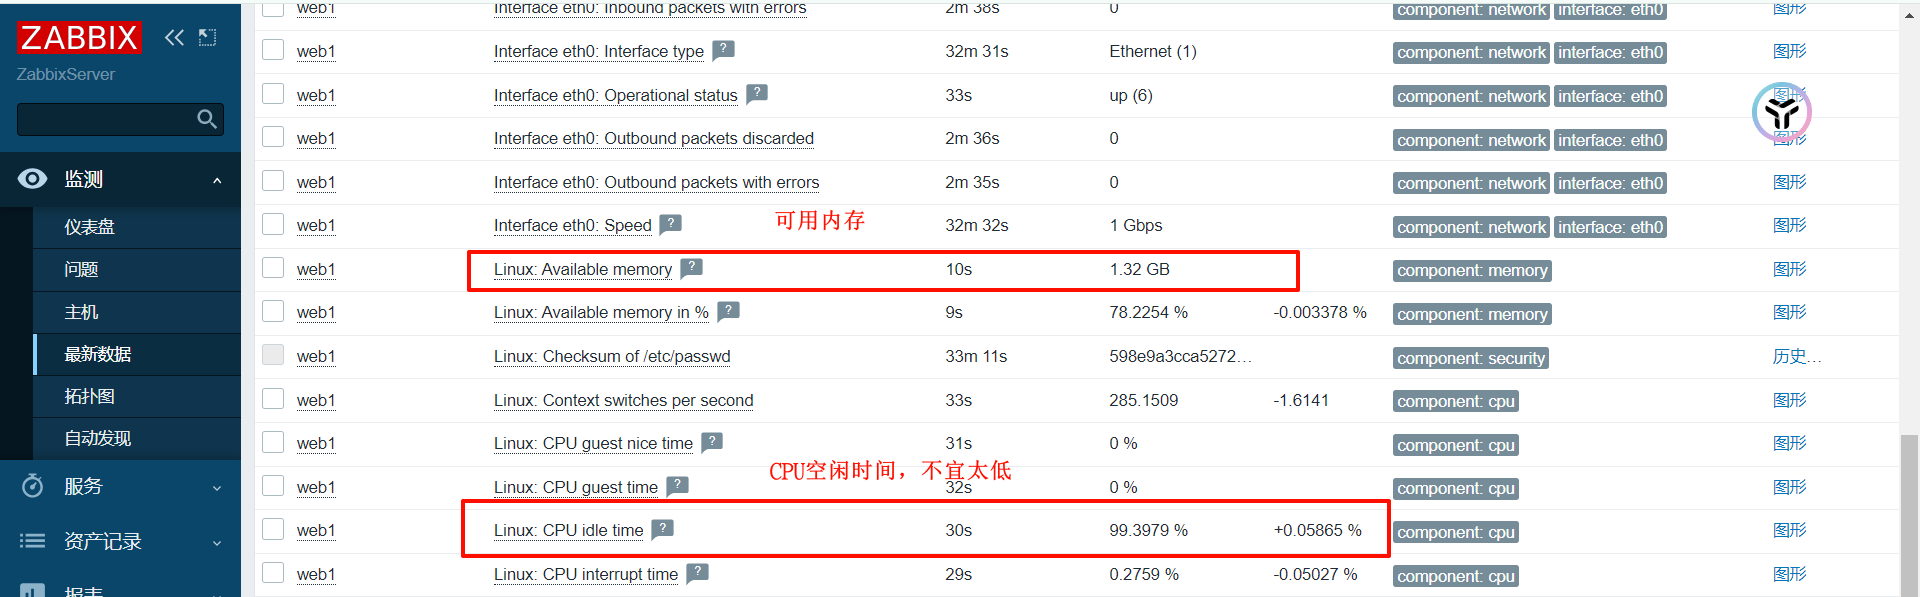
- Available memory:可用内存
- CPU idle time:CPU空闲时间不易过低
- Load average(1m avg)、Load average(5m avg)、Load average(15m avg):CPU1分钟、5分钟、15分钟的平均负载。这个值不应长期大于核心数
- Interface eth0:Bits received:网卡接收到的数据流量
- Interface eth0:Bits sent:网卡发送的数据量
- Number of processes:系统运行的进程数
- Number of logged in users:已登录的用户数
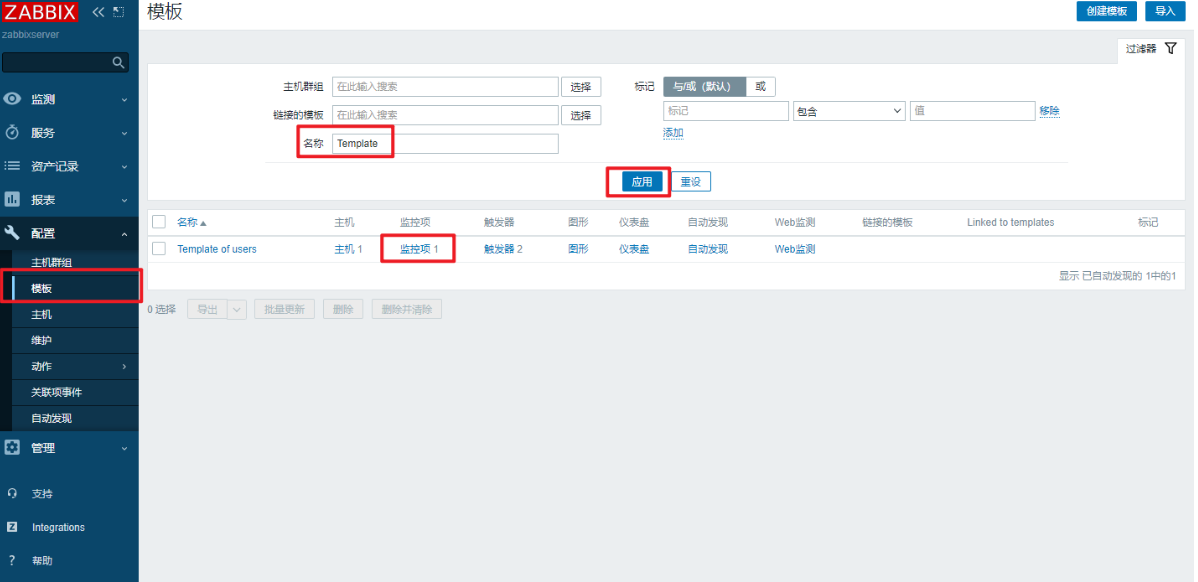
【6】、自定义监控项
1、在被控端创建key,被控端被监控的内容叫做key,可以理解为他就是一个变量名,具体的名字自己决定
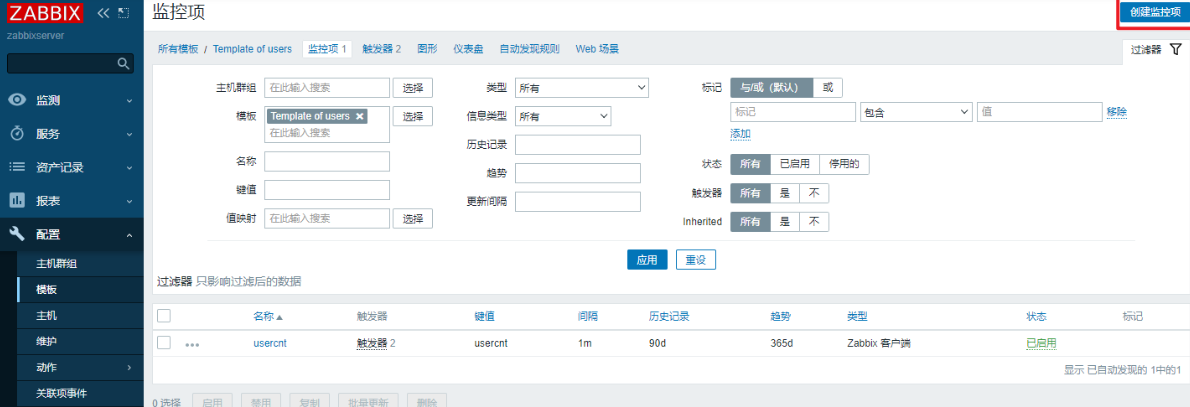
2、在web页面中创建监控项。监控项对于key值
1、实现监控web1用户数量的监控项
# 创建key的语法,命令的执行结果就是value
UserParameter=自定义key值,命令


# 1、创建自定义配置文件,文件名自定义
[root@web1:192.168.121.100 /etc/zabbix/zabbix_agentd.d]$vim usercnt.conf
UserParameter=usercnt,sed -n '$=' /etc/passwd
[root@web1:192.168.121.100 /etc/zabbix/zabbix_agentd.d]$systemctl restart zabbix-agent.service

# 2、验证添加的配置项
# 在web1和ZabbixServer上安装zabbix-get软件包,安装好后使用zabbix_get命令检查能否看到新增的key
[root@web1:192.168.121.100 ~]$yum install -y zabbix-get
[root@web1:192.168.121.100 ~]$zabbix_get -s 127.0.0.1 -k usercnt
31
# 在ZabbixServer上测试
[root@ZabbixServer:192.168.121.5 /]$zabbix_get -s 192.168.121.100 -k usercnt
31
# 让ZabbixServer也可以监控用户数量
[root@web1:192.168.121.100 ~]$scp /etc/zabbix/zabbix_agentd.d/usercnt.conf root@192.168.121.5:/etc/zabbix/zabbix_agentd.d/usercnt.conf
[root@ZabbixServer:192.168.121.5 /]$systemctl restart zabbix-server.service
[root@ZabbixServer:192.168.121.5 /]$systemctl restart zabbix-agent.service
[root@ZabbixServer:192.168.121.5 /]$zabbix_get -s 127.0.0.1 -k usercnt
34
【7】、配置告警
- 默认情况下,监控项不会自动发送告警消息
- 需要配置触发器与告警,并且通过通知方式发送信息给联系人
- 触发器:设置条件,当条件达到时,将会执行某个动作
- 动作:触发器条件达到后要采取的行为,比如发邮件或执行命令
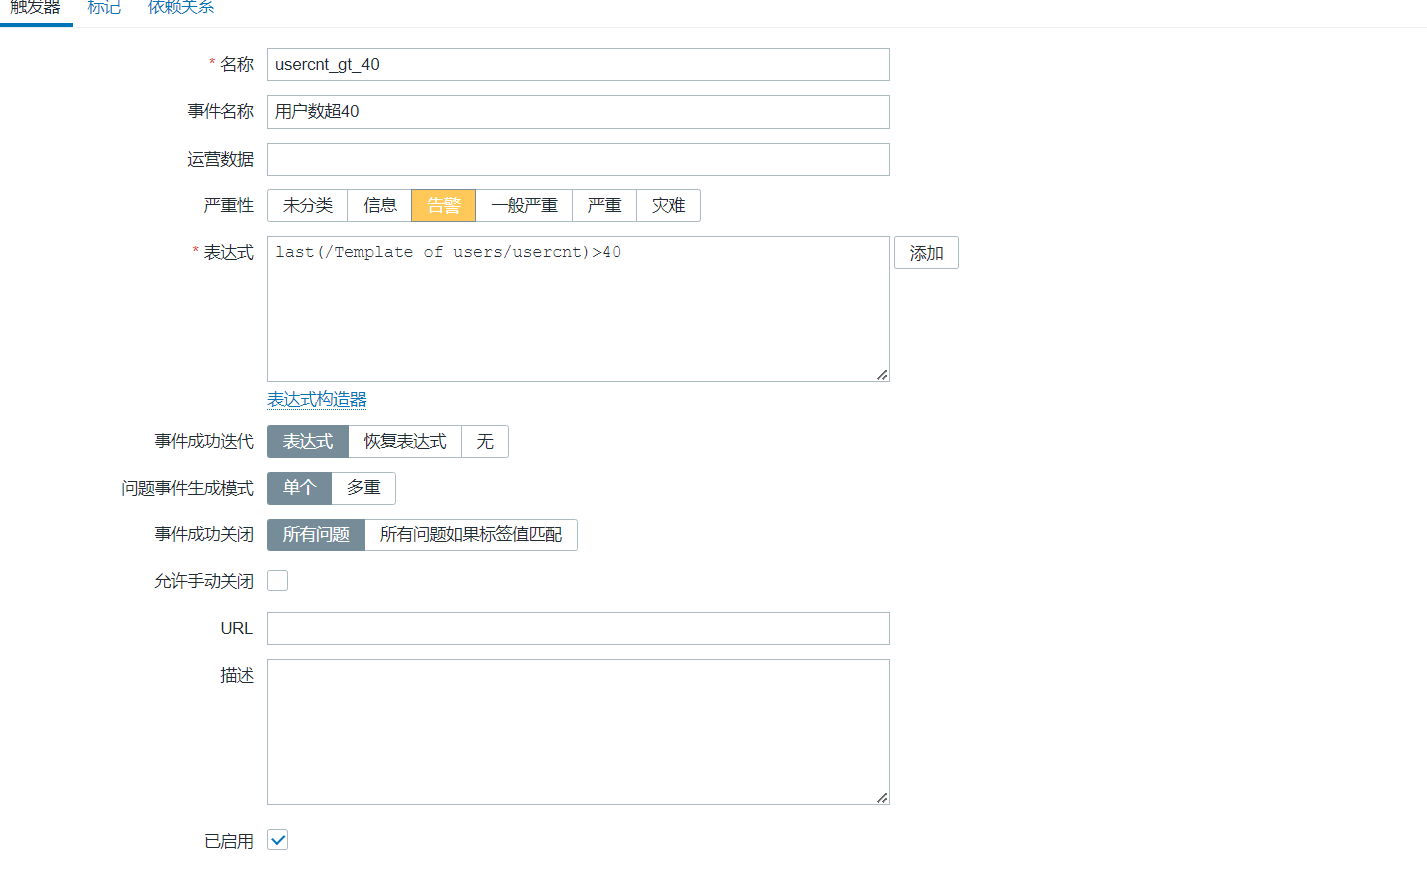
1、用户数超过40,发送警告邮件
- 当web1的用户数量超过30时,会认为这是一个问题(problem)
- 当出现问题时,将会执行动作
- 执行的动作时给管理员发邮件
- 给管理员发邮件,还要配置邮件服务器地址,以及管理员Email地址
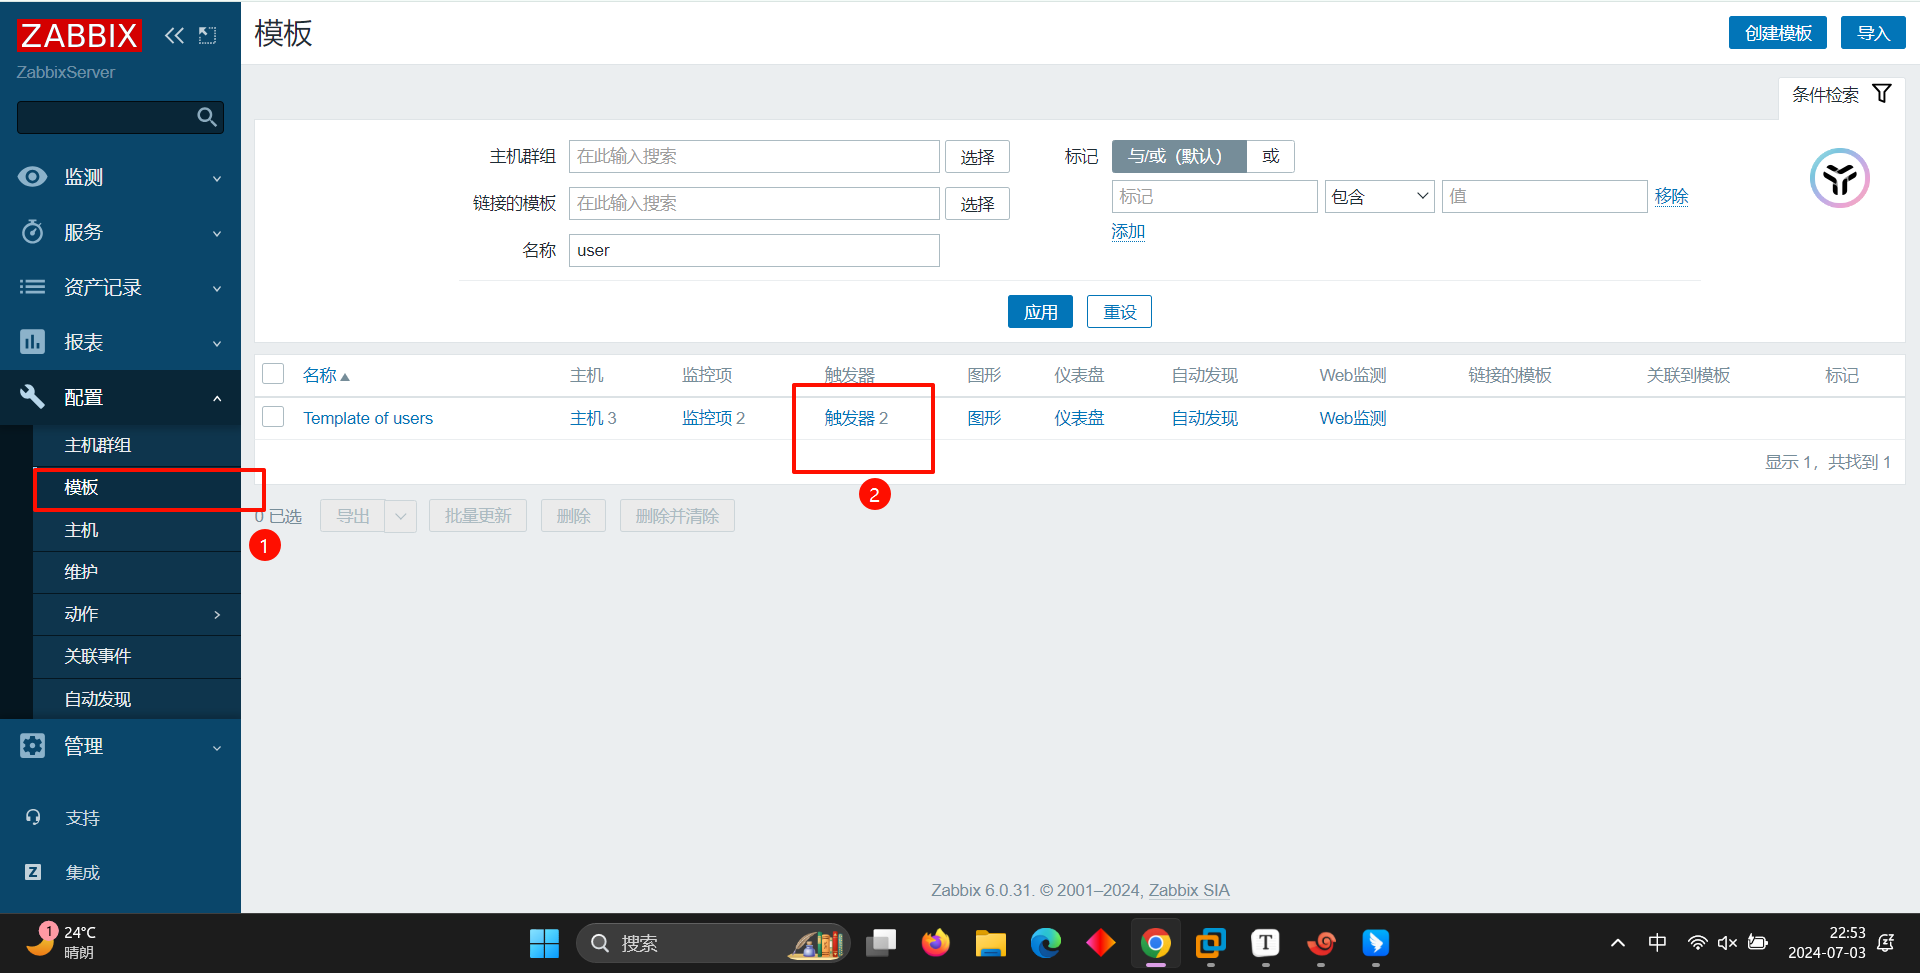
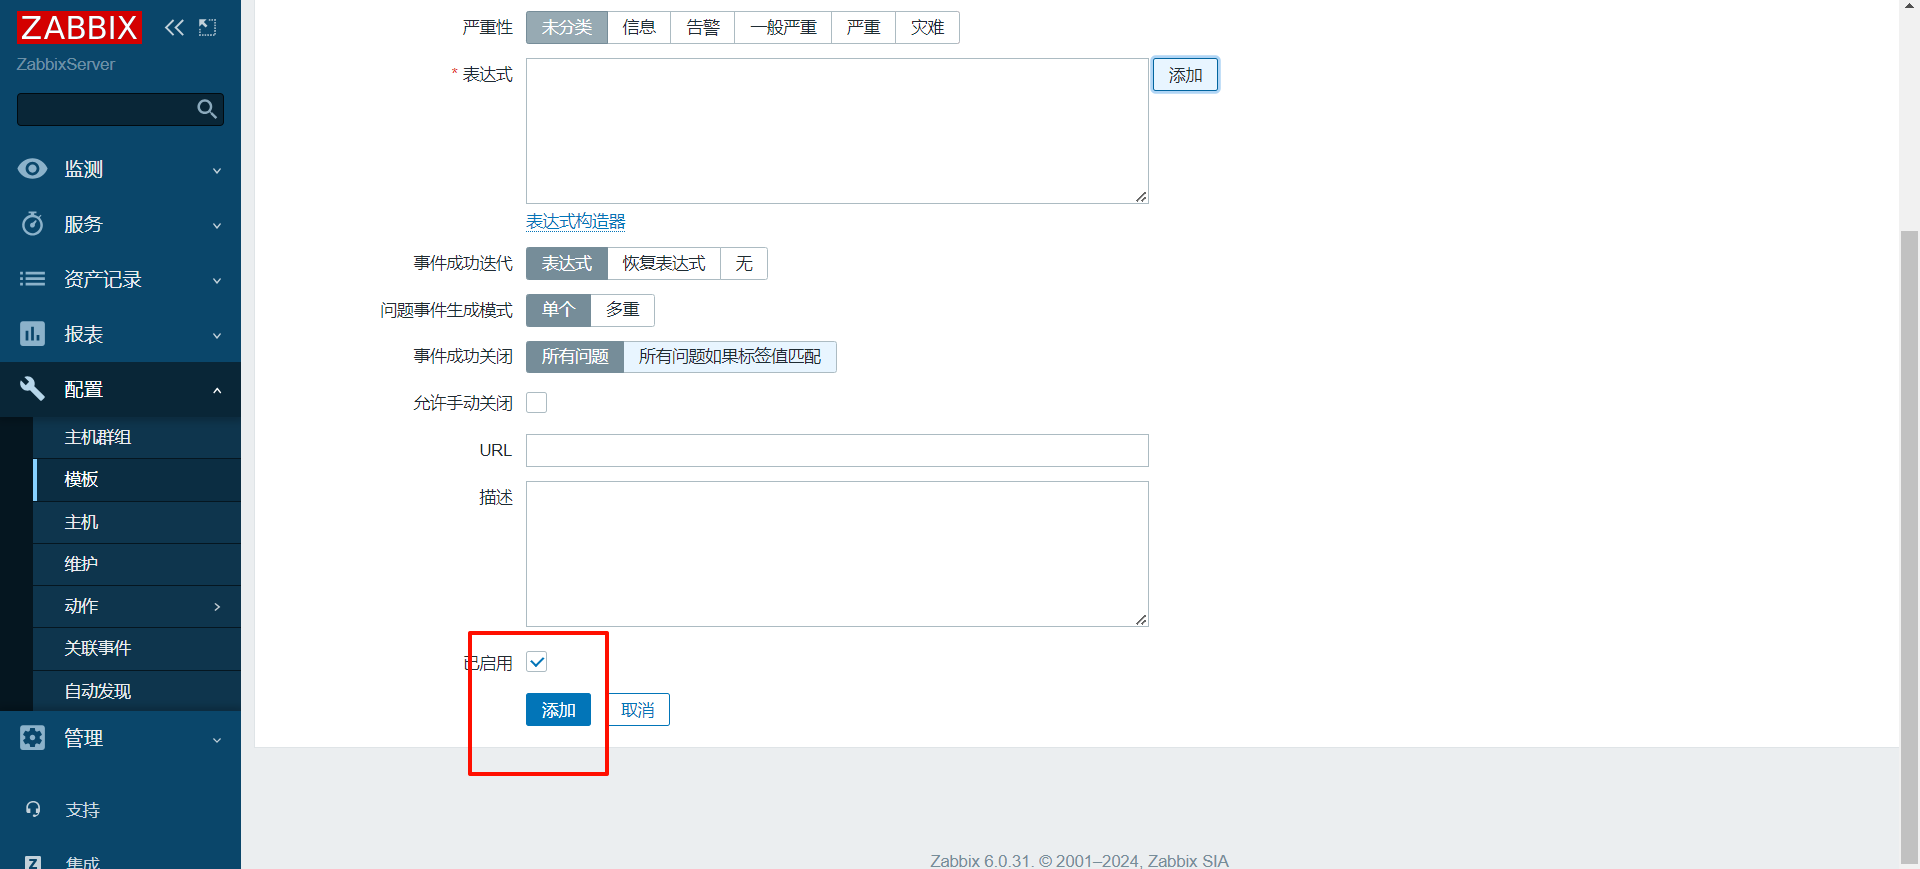
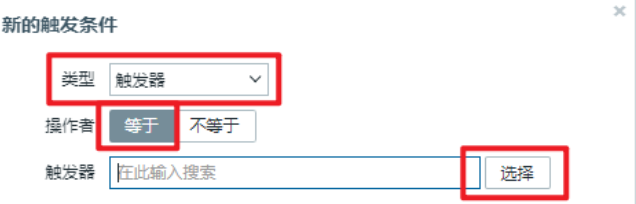
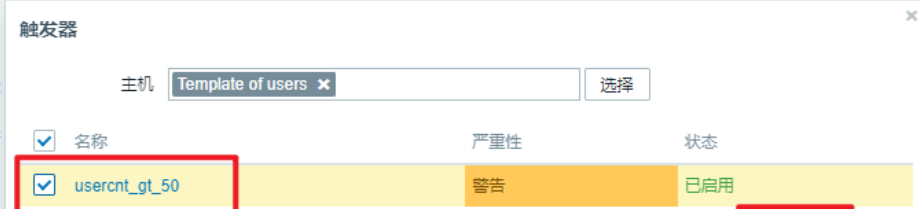
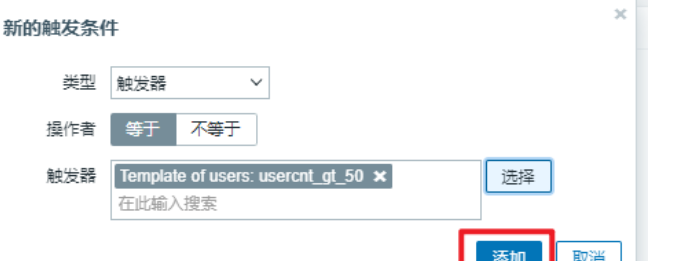
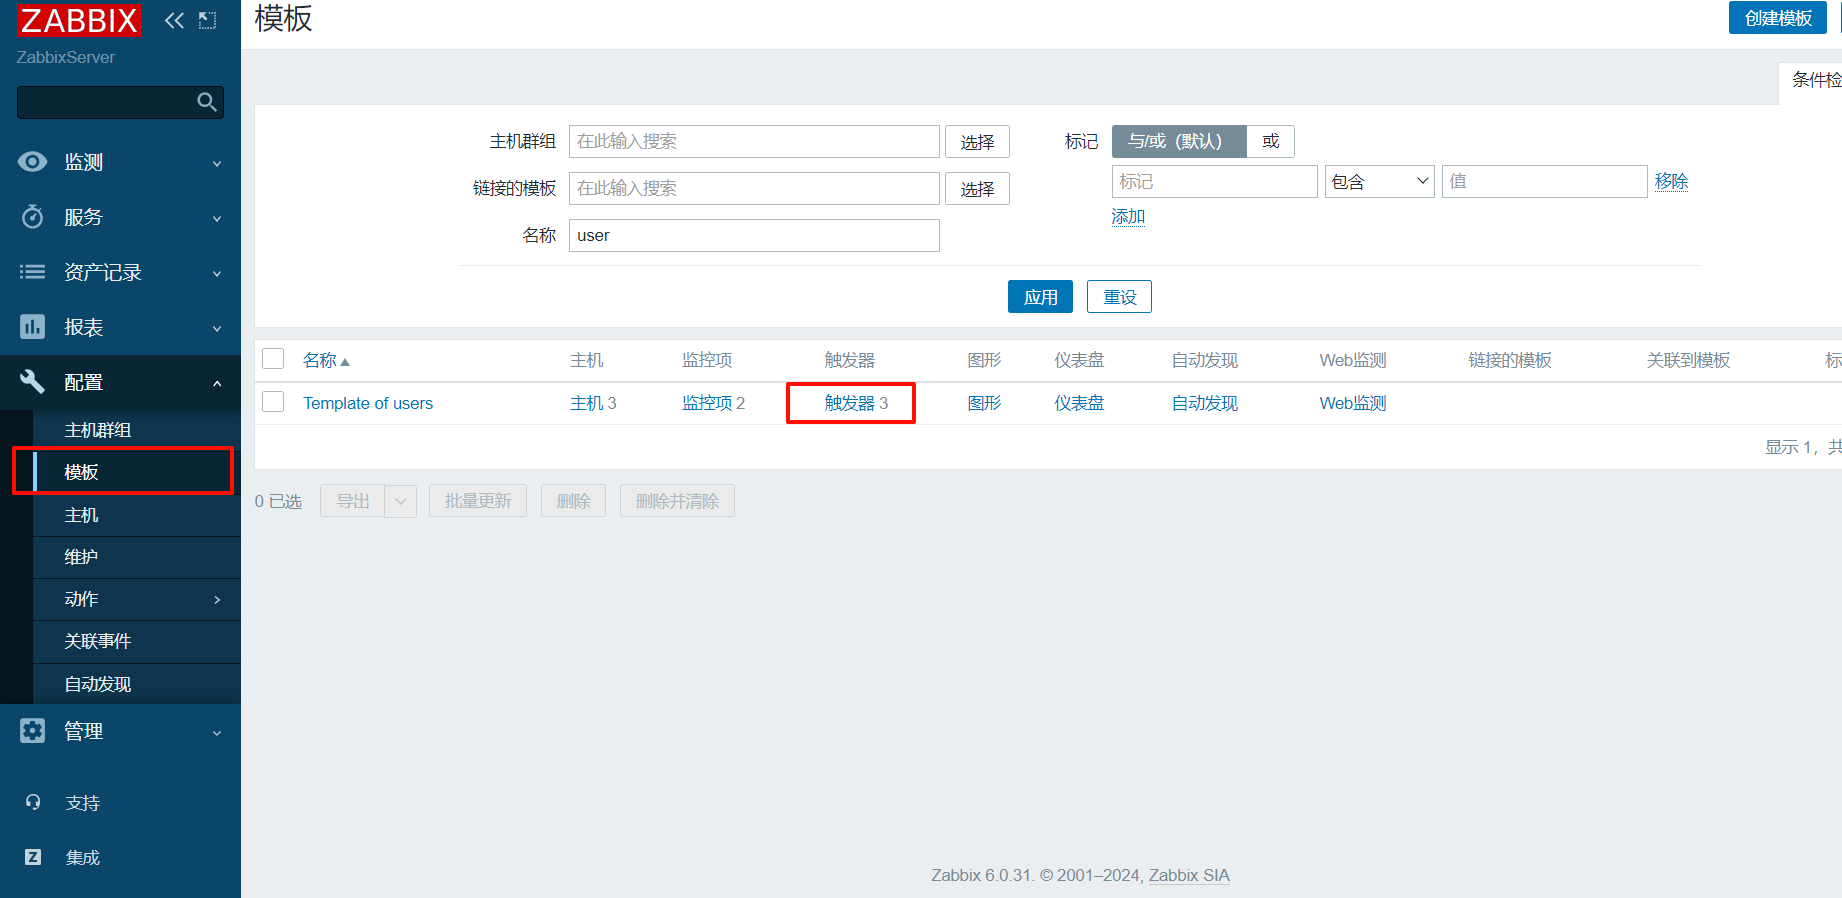
(1)、创建触发器规则
在一个模板中添加触发器
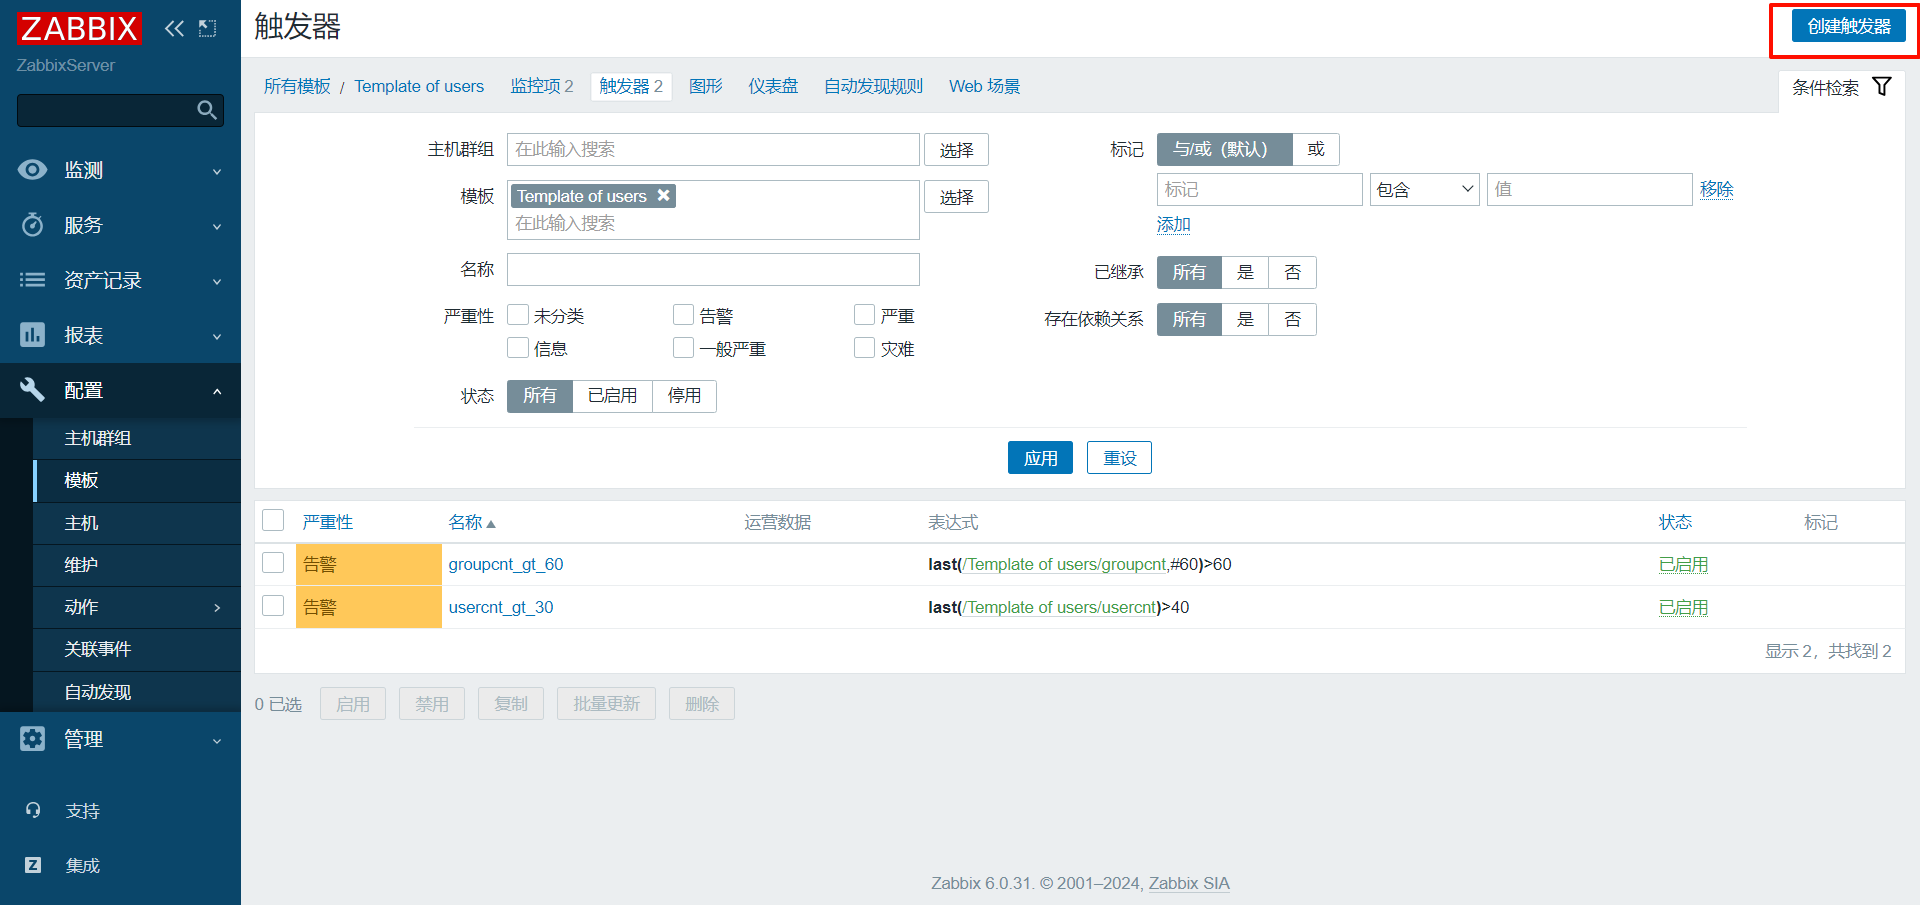
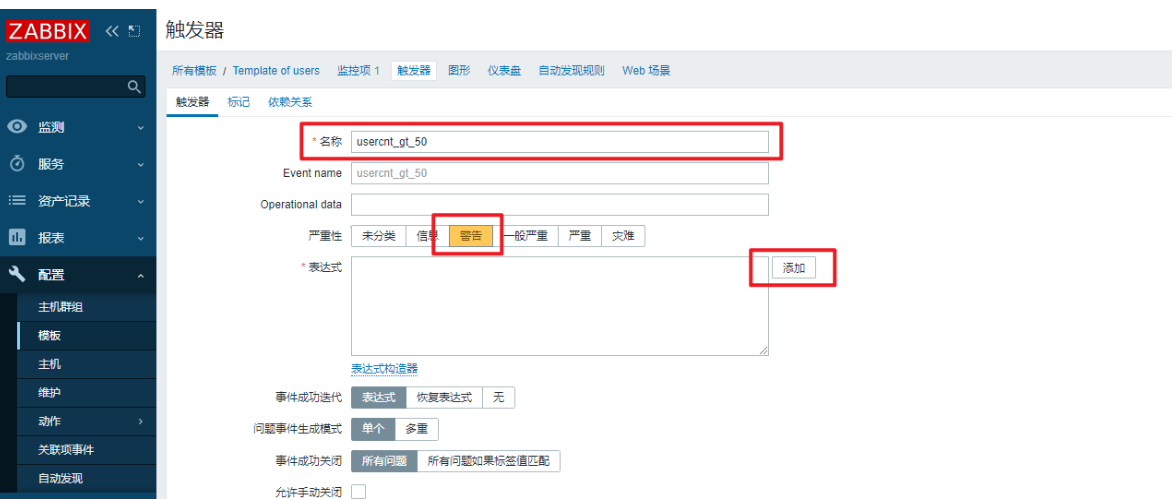
点击添加,进行配置
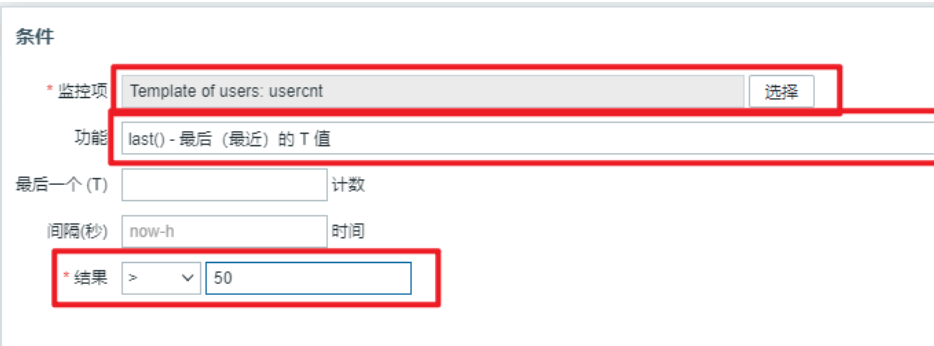
配置完成后添加
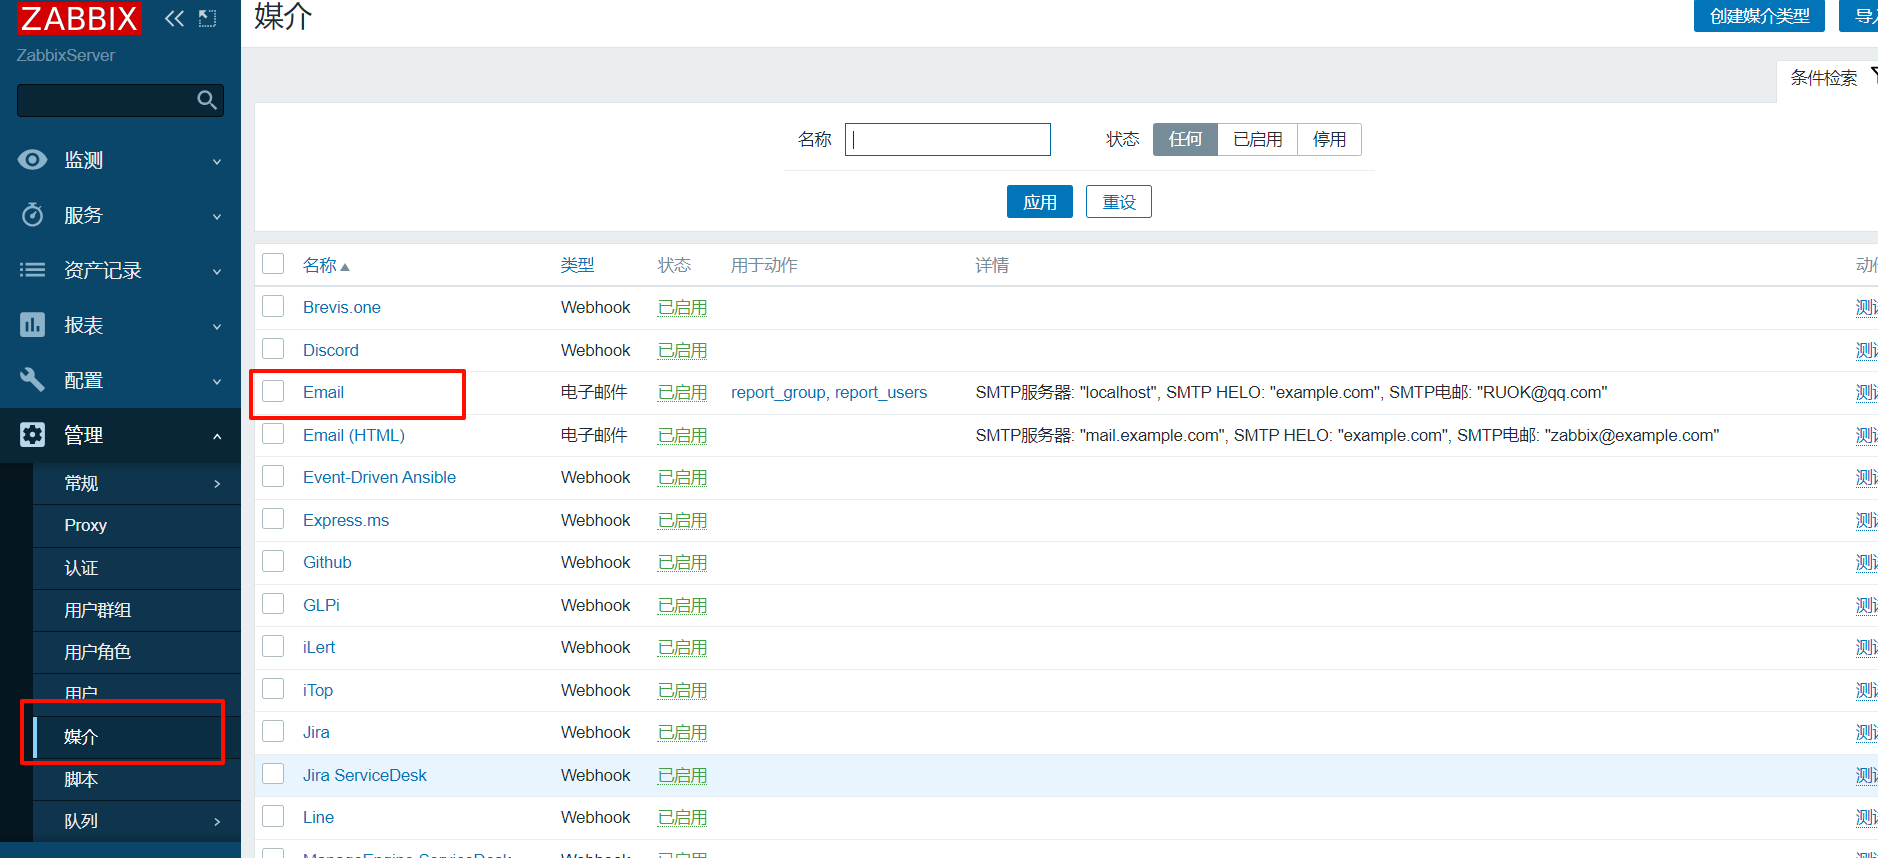
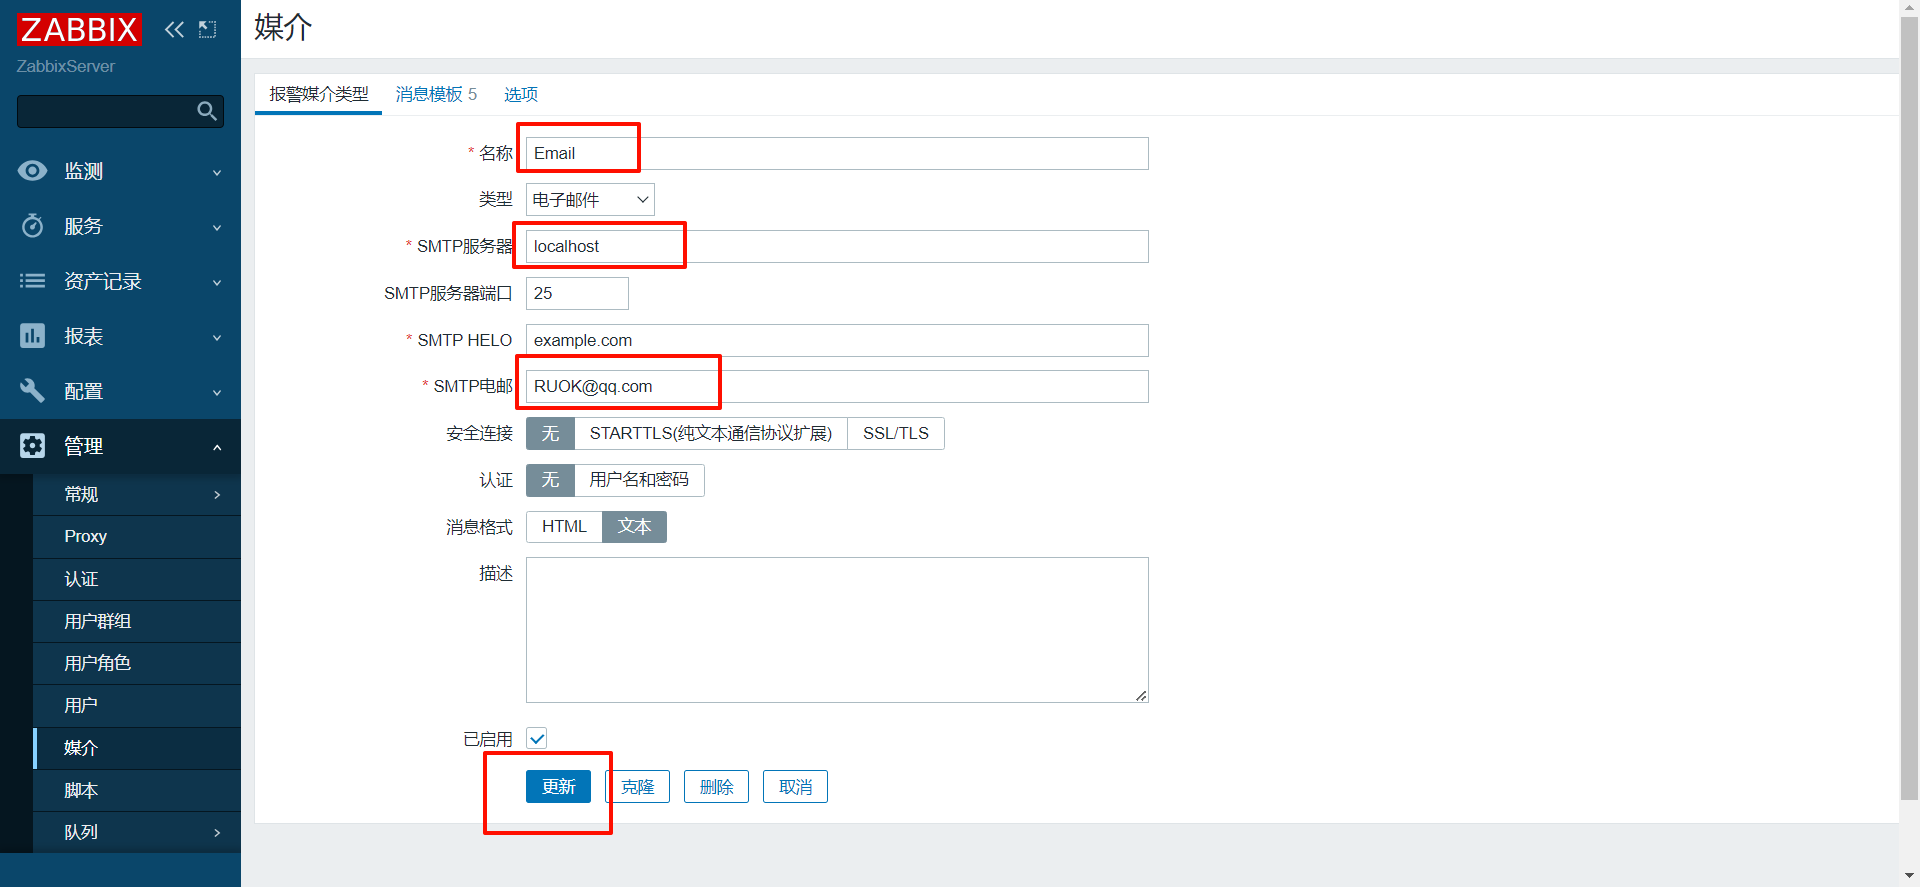
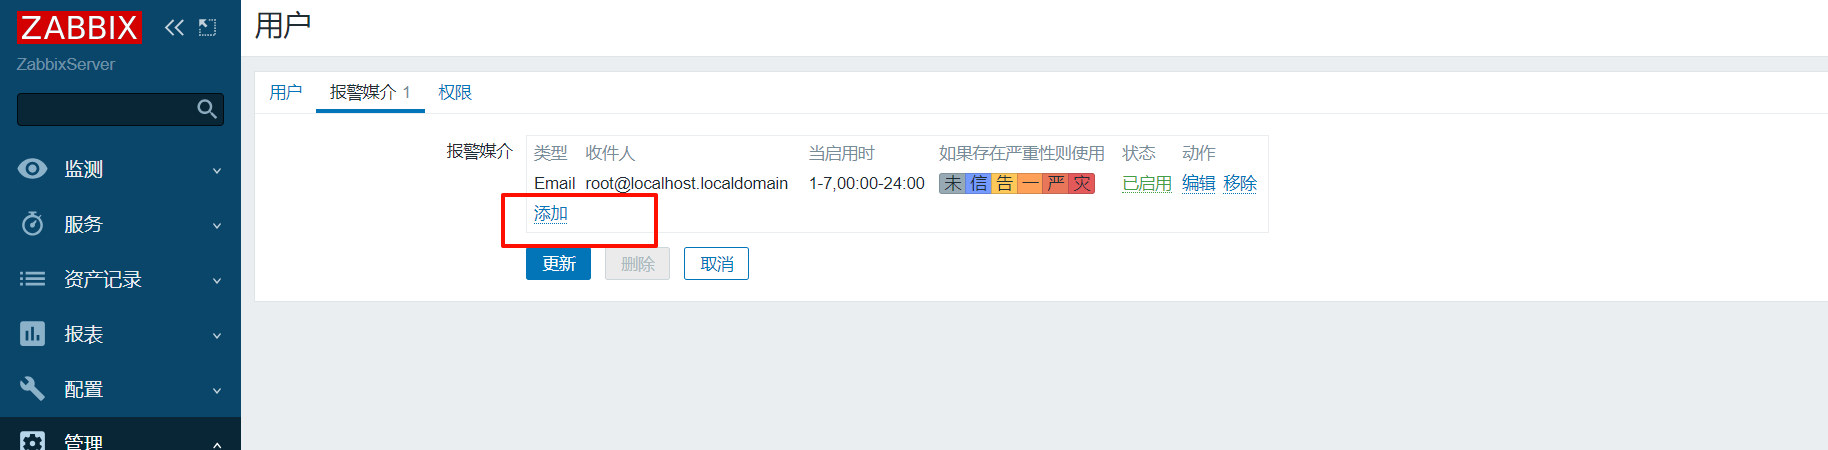
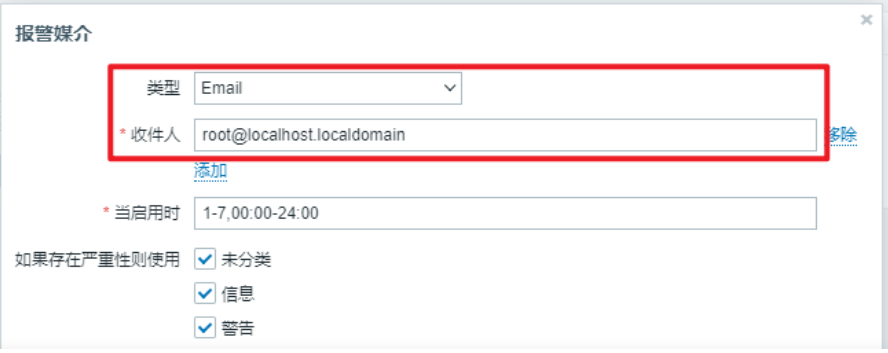
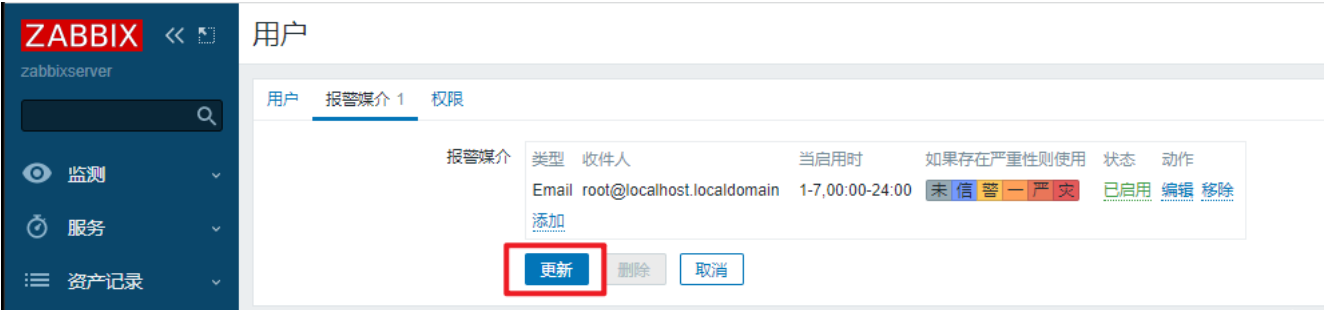
(2)、创建邮件类型的报警媒介
选择email电子媒介
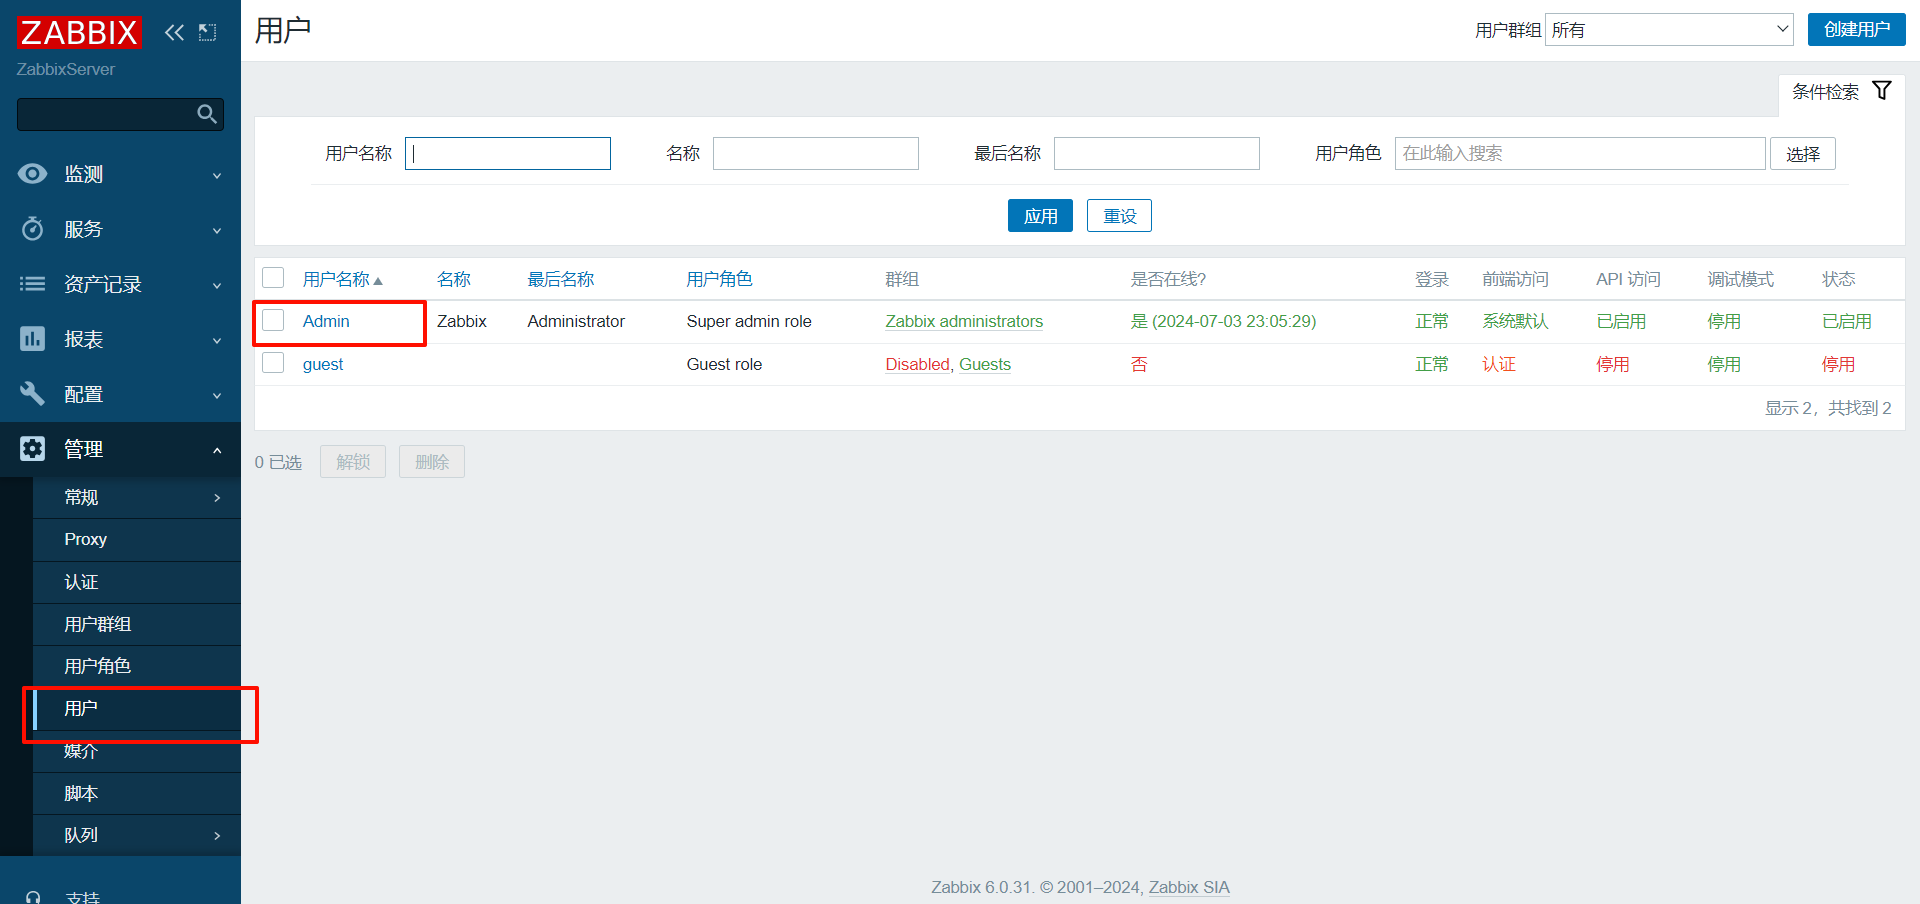
(3)、为用户关联邮箱
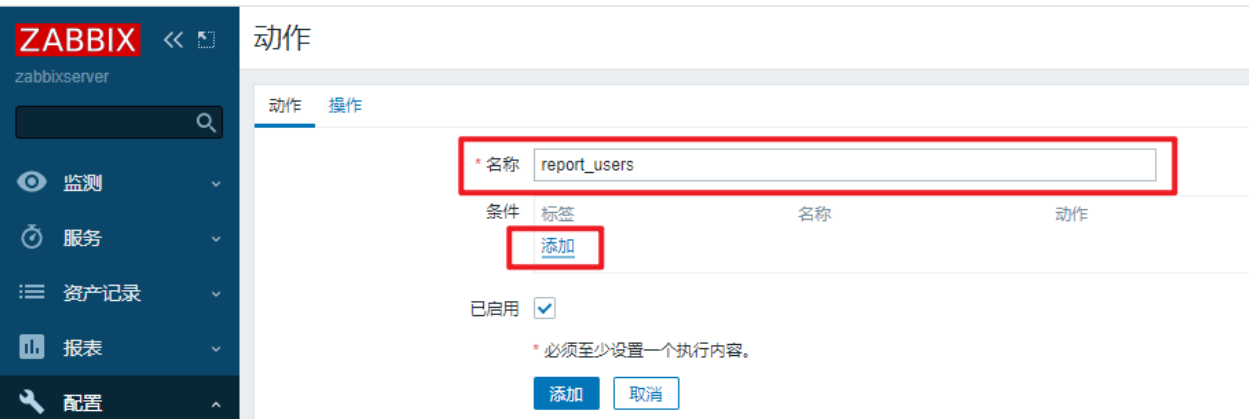
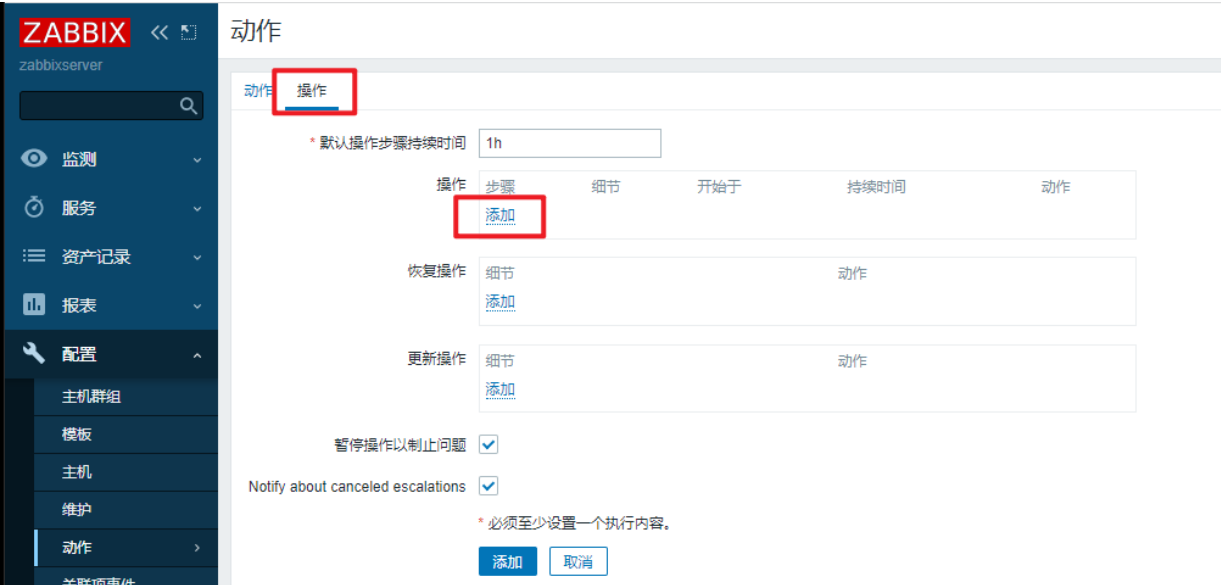
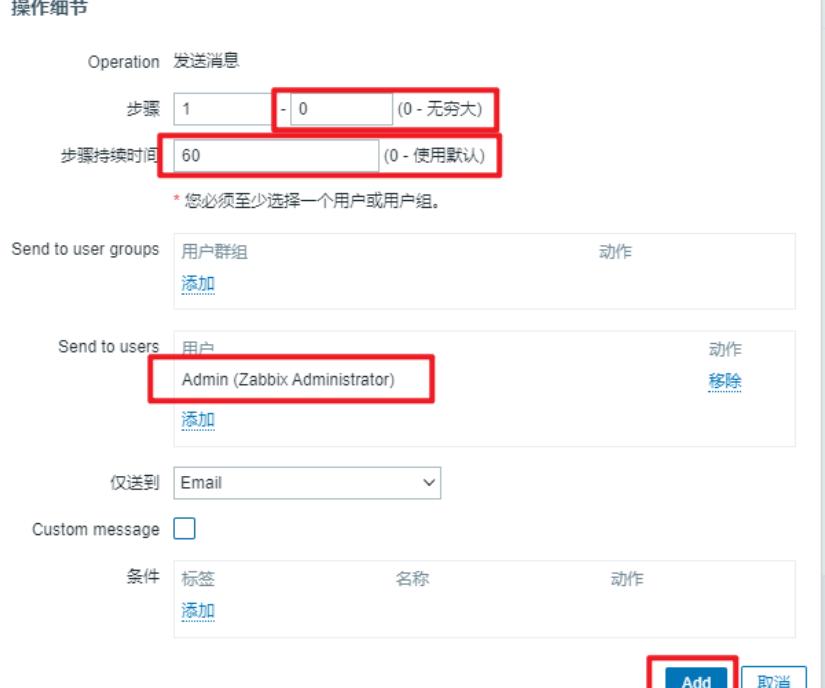
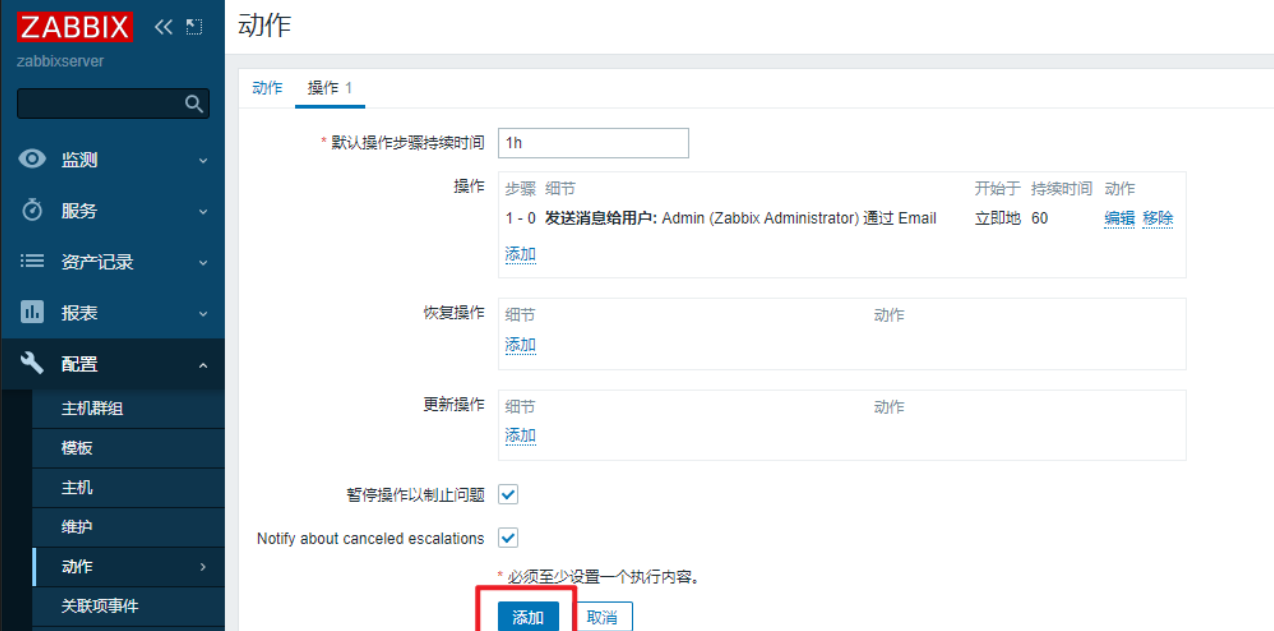
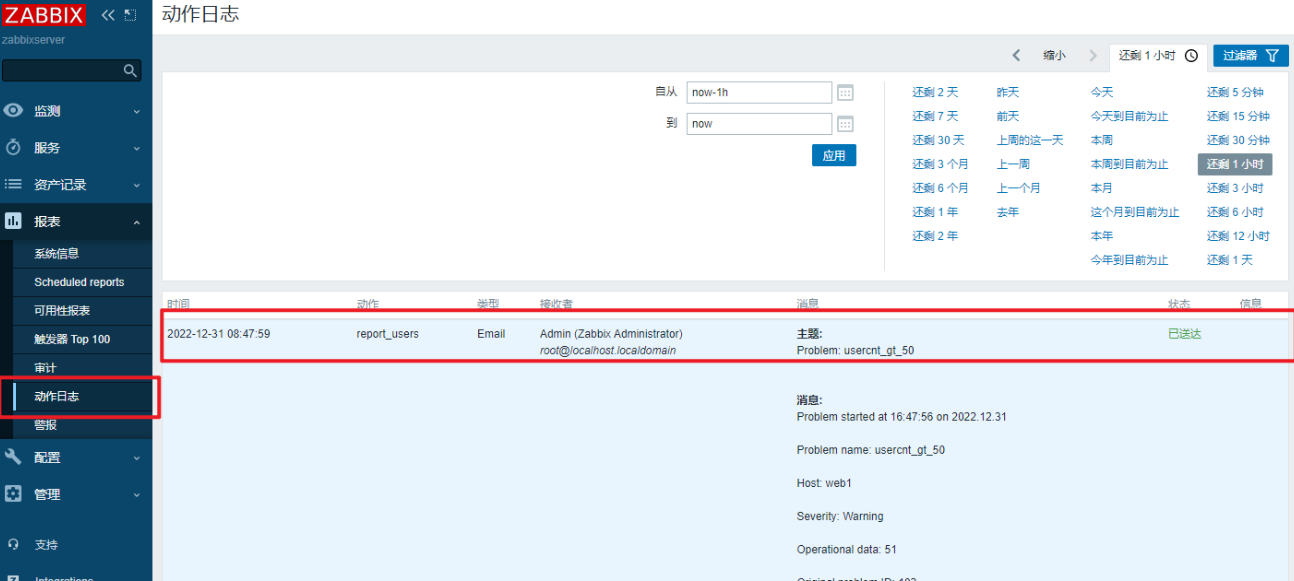
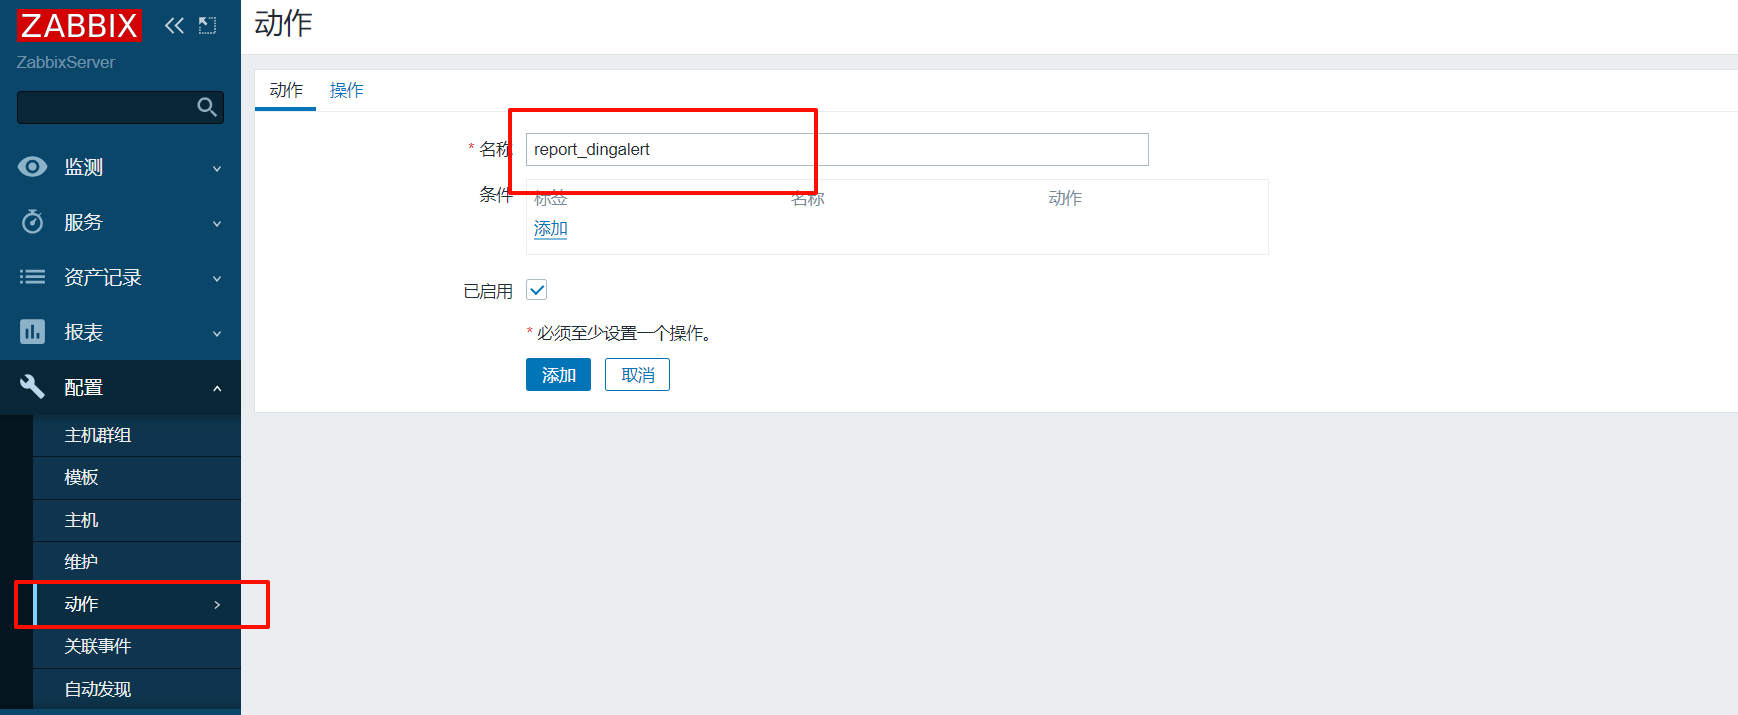
(4)、创建动作
当出现Problem状态时,给admin发邮件
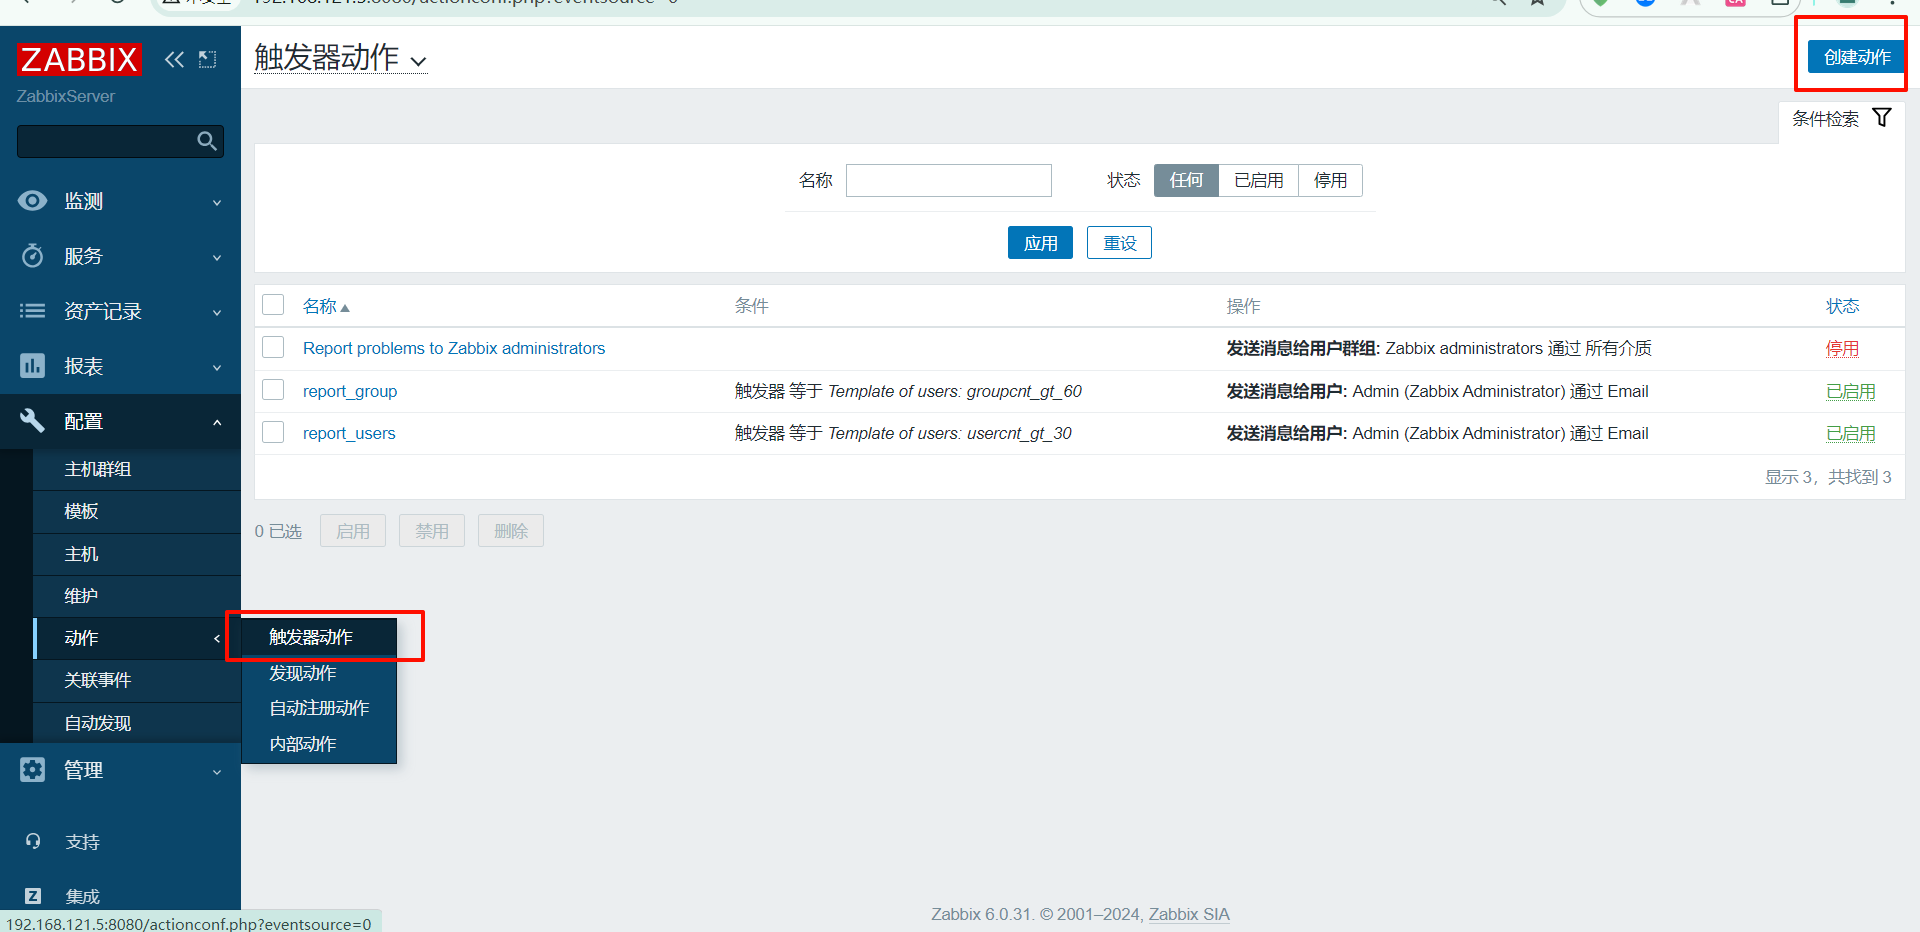
回到“创建动作”页面后,点击“操作”:
(5)、在zabbixserver上配置邮件服务
yum install -y postfix mailx
systemctl enable postfix --now

# 在web1创建用户,使总用户数超过50
[root@web1 ~]# for user in user{1..5}
> do
> useradd $user
> done

# 查看Linux中的日志
[root@zabbixserver ~]# mail   # 查看邮件
Heirloom Mail version 12.5 7/5/10.  Type ? for help.
"/var/spool/mail/root": 2 messages 2 new
>N  1 zzg@tedu.cn           Sat Dec 31 16:47  21/932   "Problem: usercnt_gt_50"
 N  2 zzg@tedu.cn           Sat Dec 31 16:48  21/932   "Problem: usercnt_gt_50"
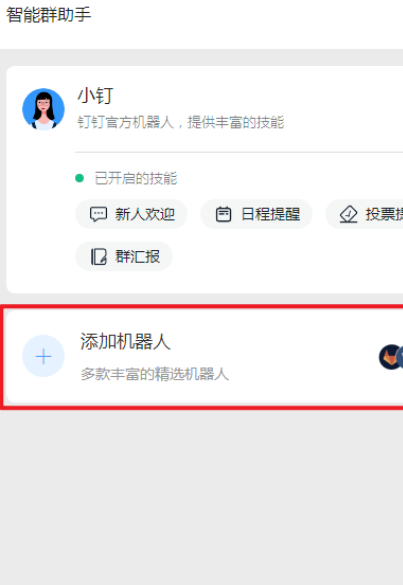
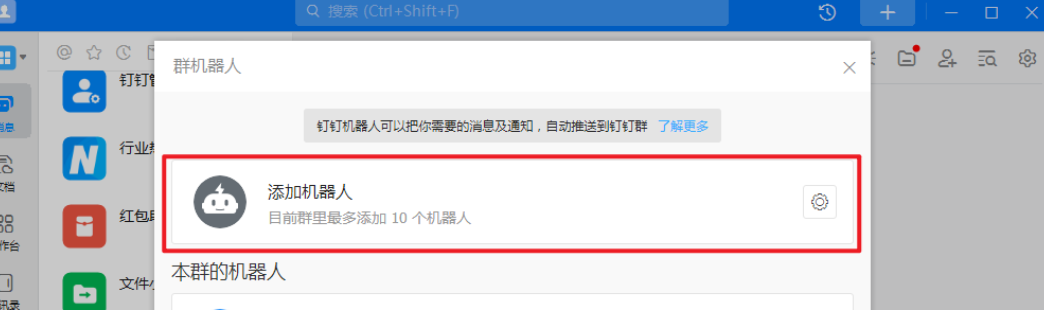
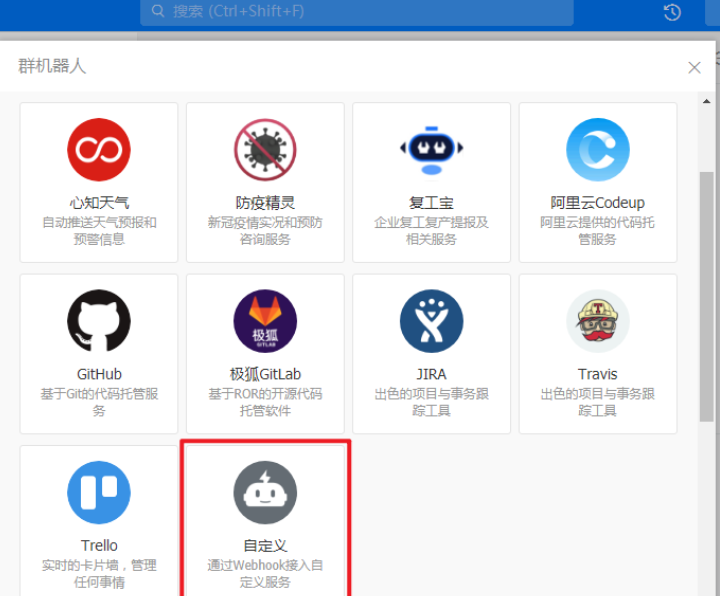
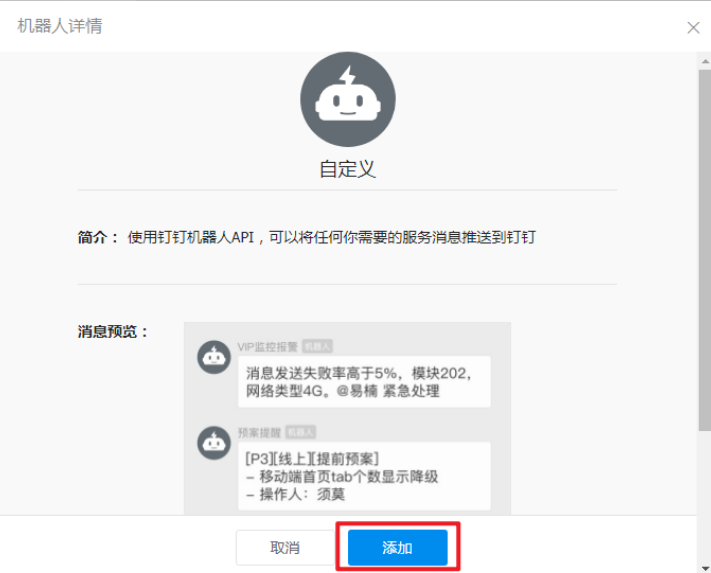
2、添加钉钉机器人
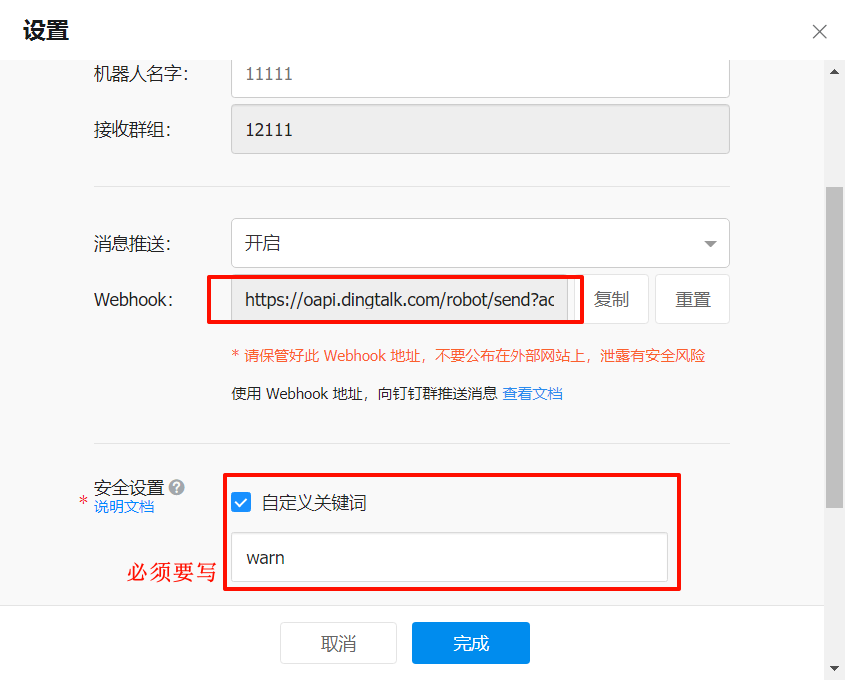
(1)、添加钉钉机器人
编写脚本并测试
# 安装钉钉机器人脚本需要用到的模块
[root@zabbixserver ~]# yum install -y python3-requests

# 编写钉钉机器人脚本
[root@zabbixserver ~]# vim /usr/lib/zabbix/alertscripts/dingalert.py
#!/usr/bin/env python3
import json
import requests
import sys
def send_msg(url, remiders, msg):
    headers = {'Content-Type': 'application/json; charset=utf-8'}
    data = {
        "msgtype": "text",
        "at": {
            "atMobiles": remiders,
            "isAtAll": False,
        },
        "text": {
            "content": msg,
        }
    }
    r = requests.post(url, data=json.dumps(data), headers=headers)
    return r.text
if __name__ == '__main__':
    msg = sys.argv[1]
    remiders = []
    url = '钉钉机器人Webhook地址'  # 注意此处需输入机器人的webhook地址
    print(send_msg(url, remiders, msg))
[root@zabbixserver ~]# chmod +x /usr/lib/zabbix/alertscripts/dingalert.py
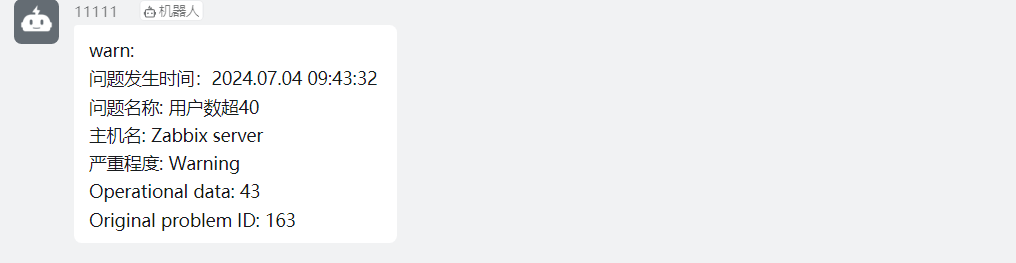
# 注意消息中要包含关键字warn
[root@zabbixserver ~]# /usr/lib/zabbix/alertscripts/dingalert.py 'warn: 晚上吃什么'
{"errcode":0,"errmsg":"ok"}

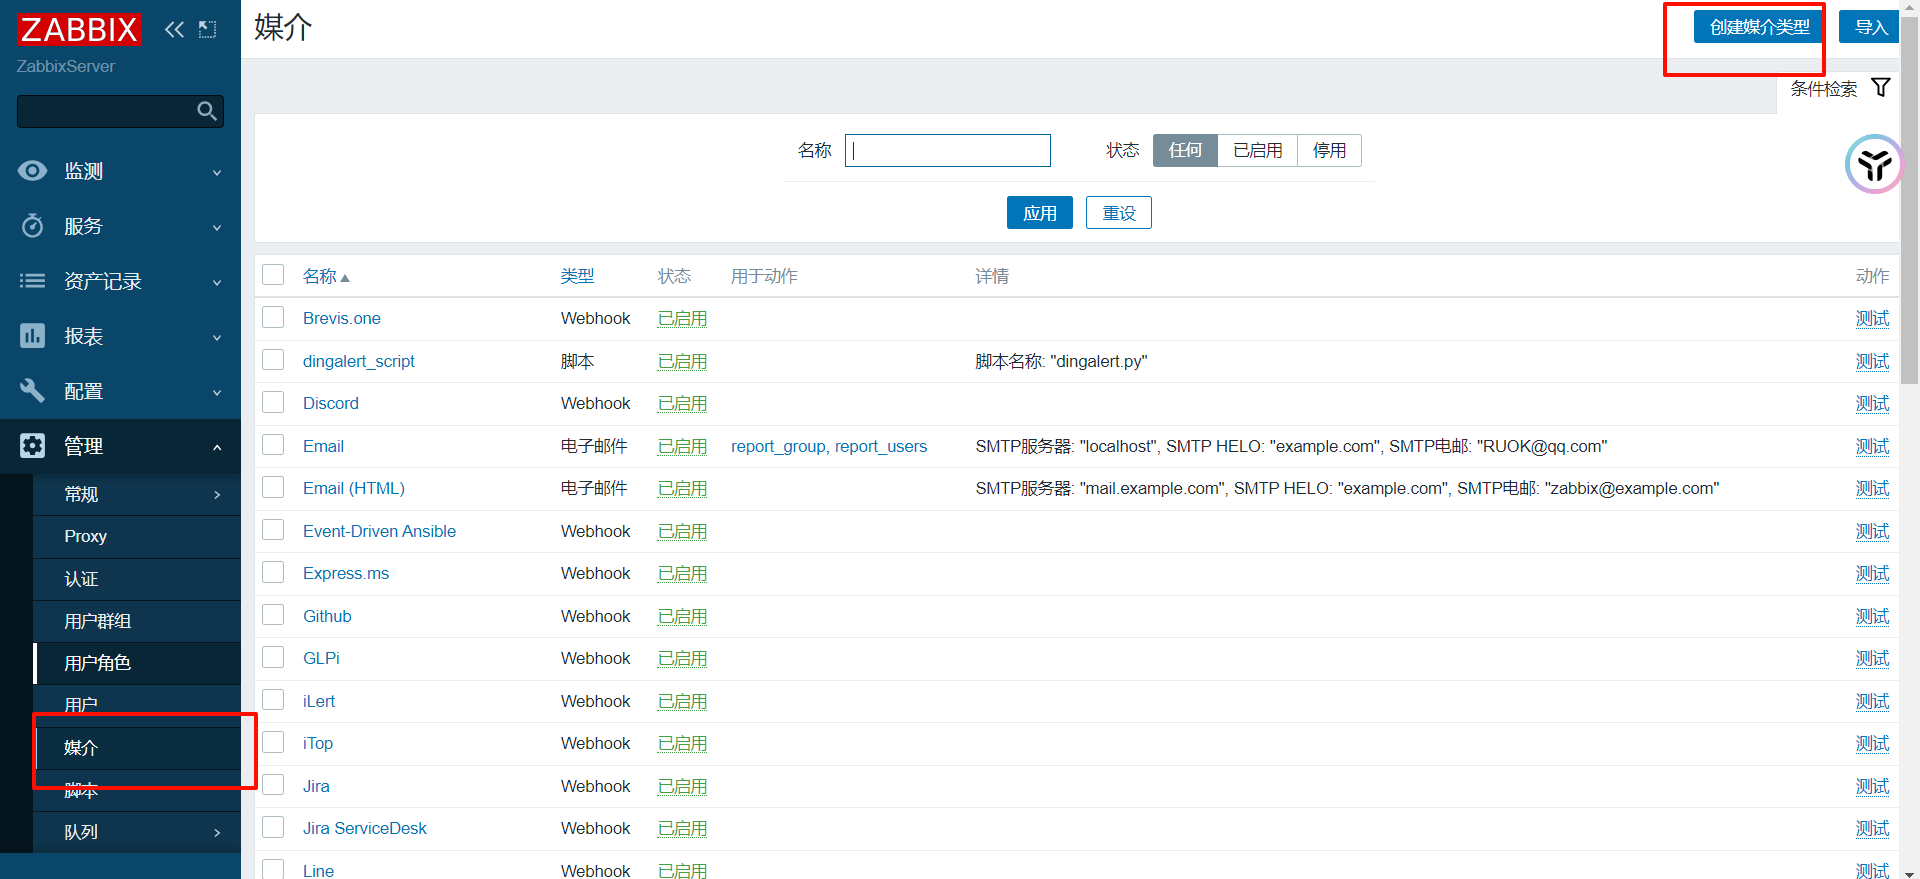
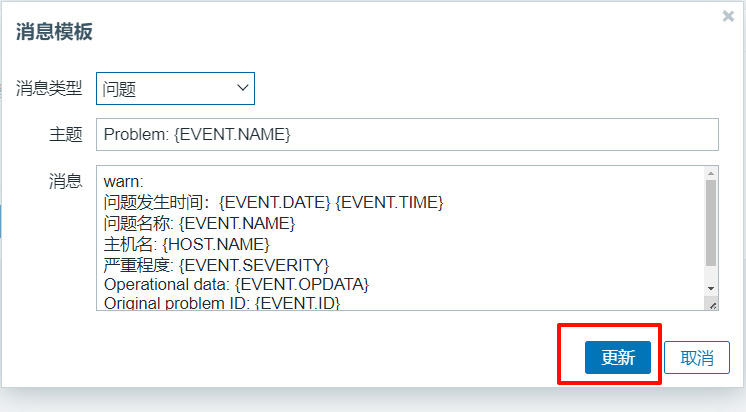
(2)、添加报警媒介类型
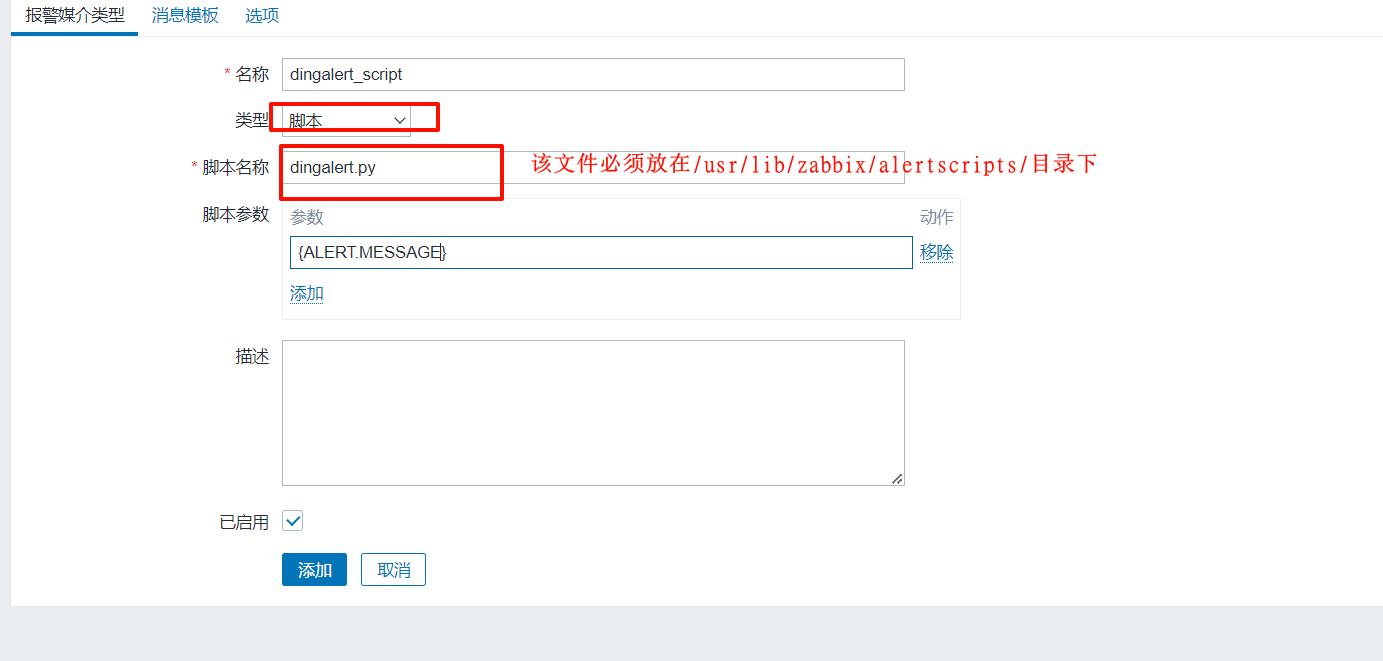
添加消息模板

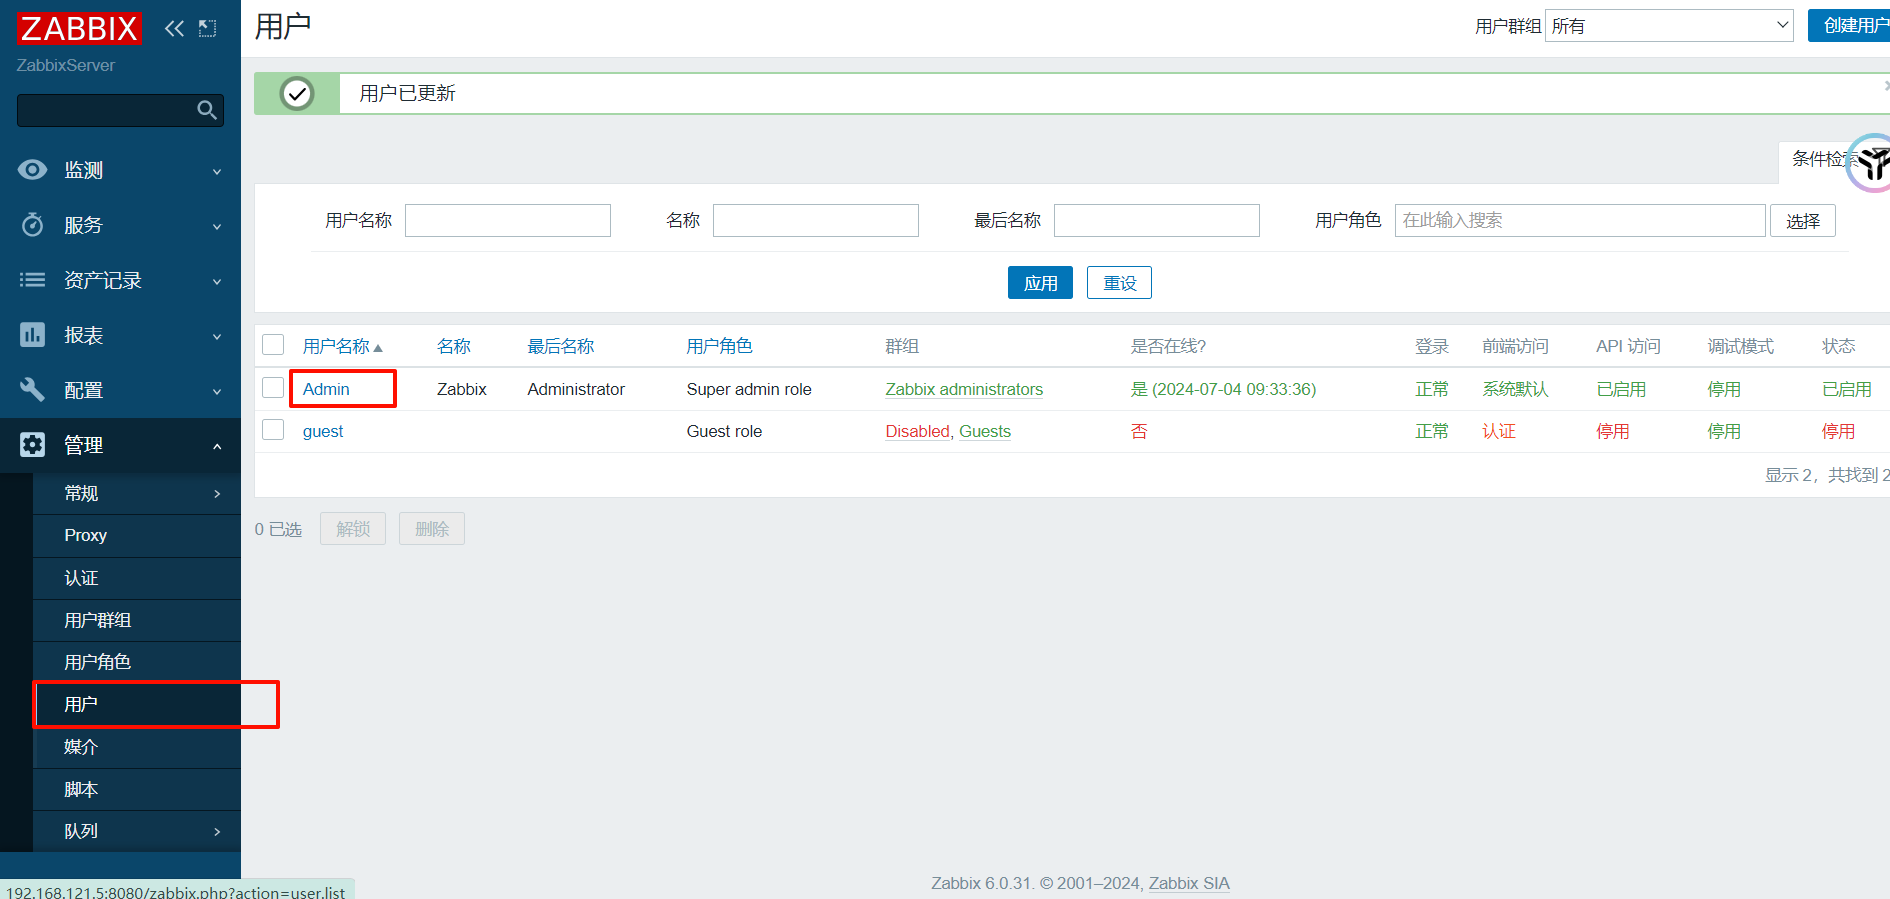
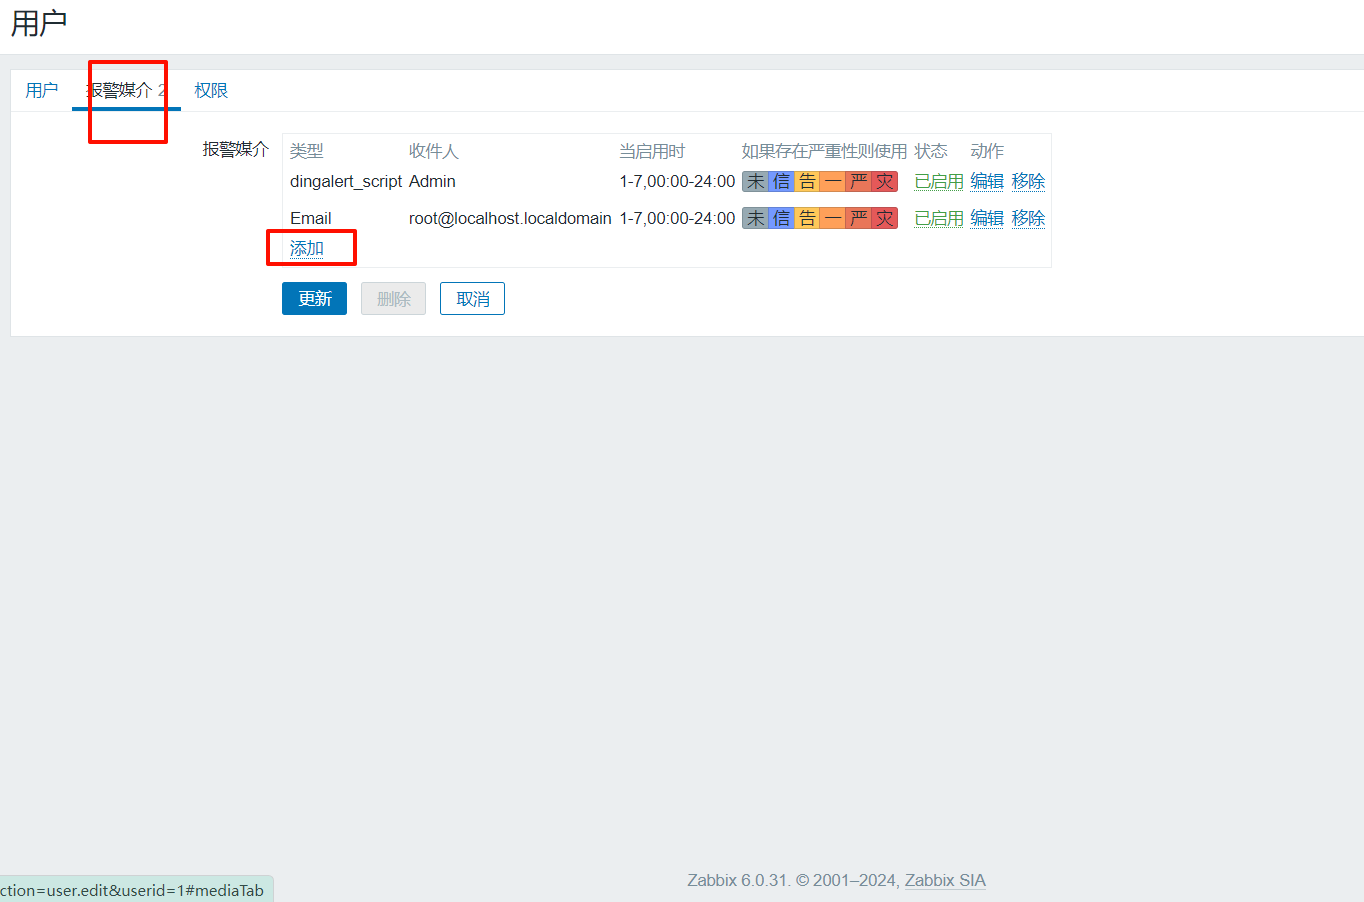
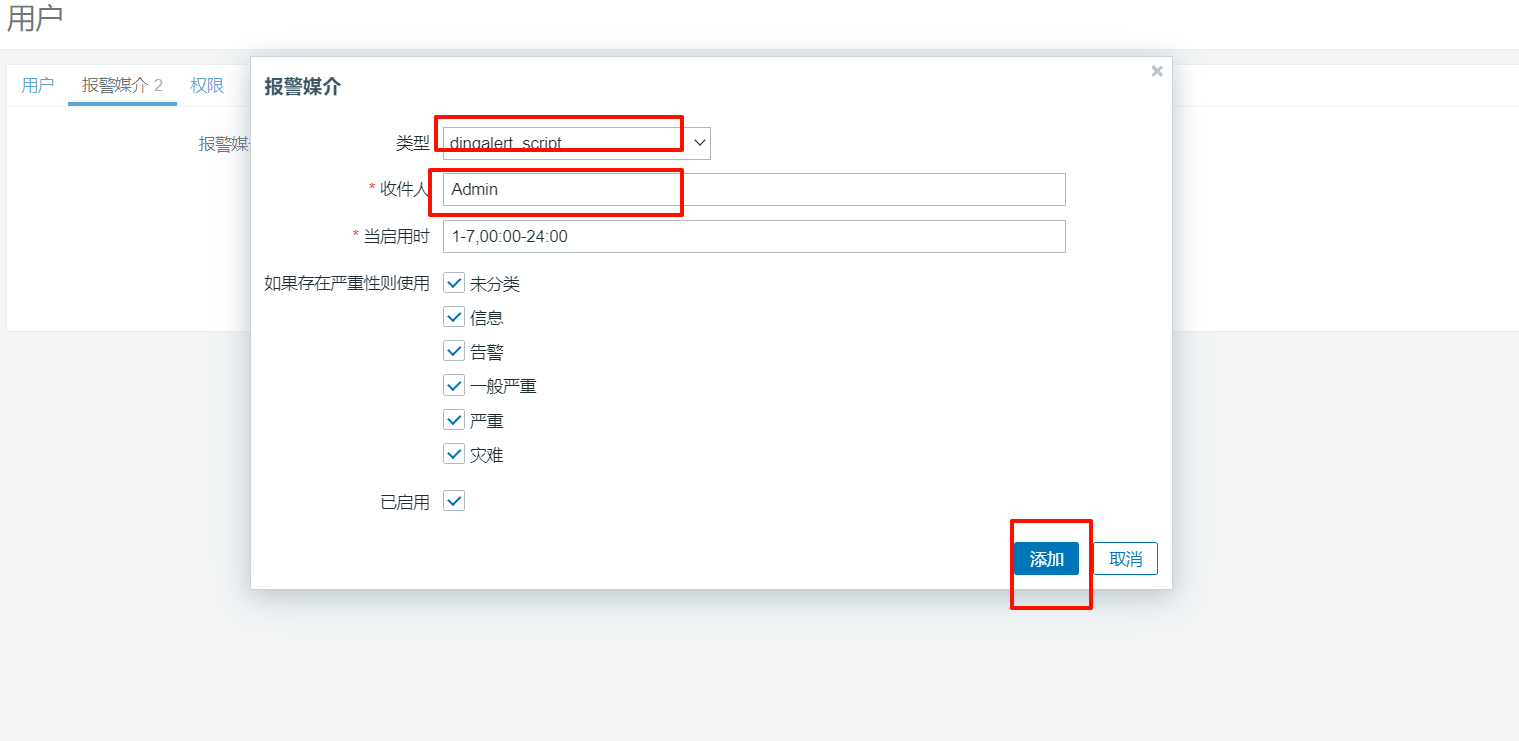
(3)、添加到用户
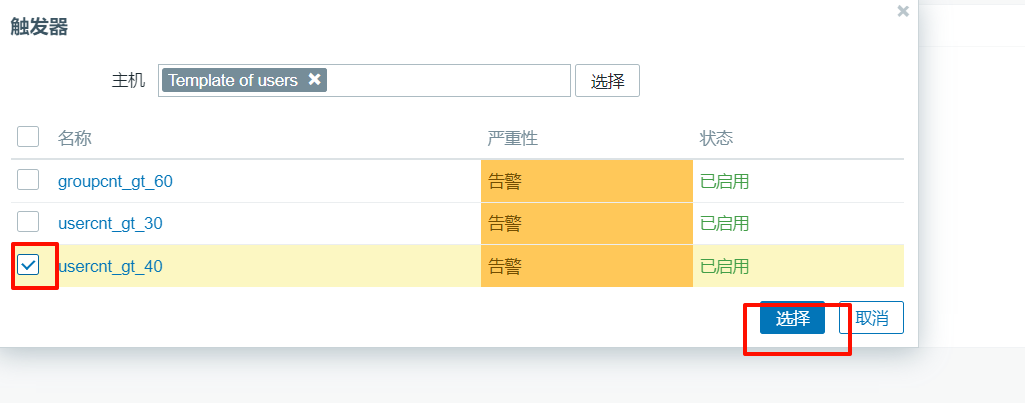
(4)、添加触发器
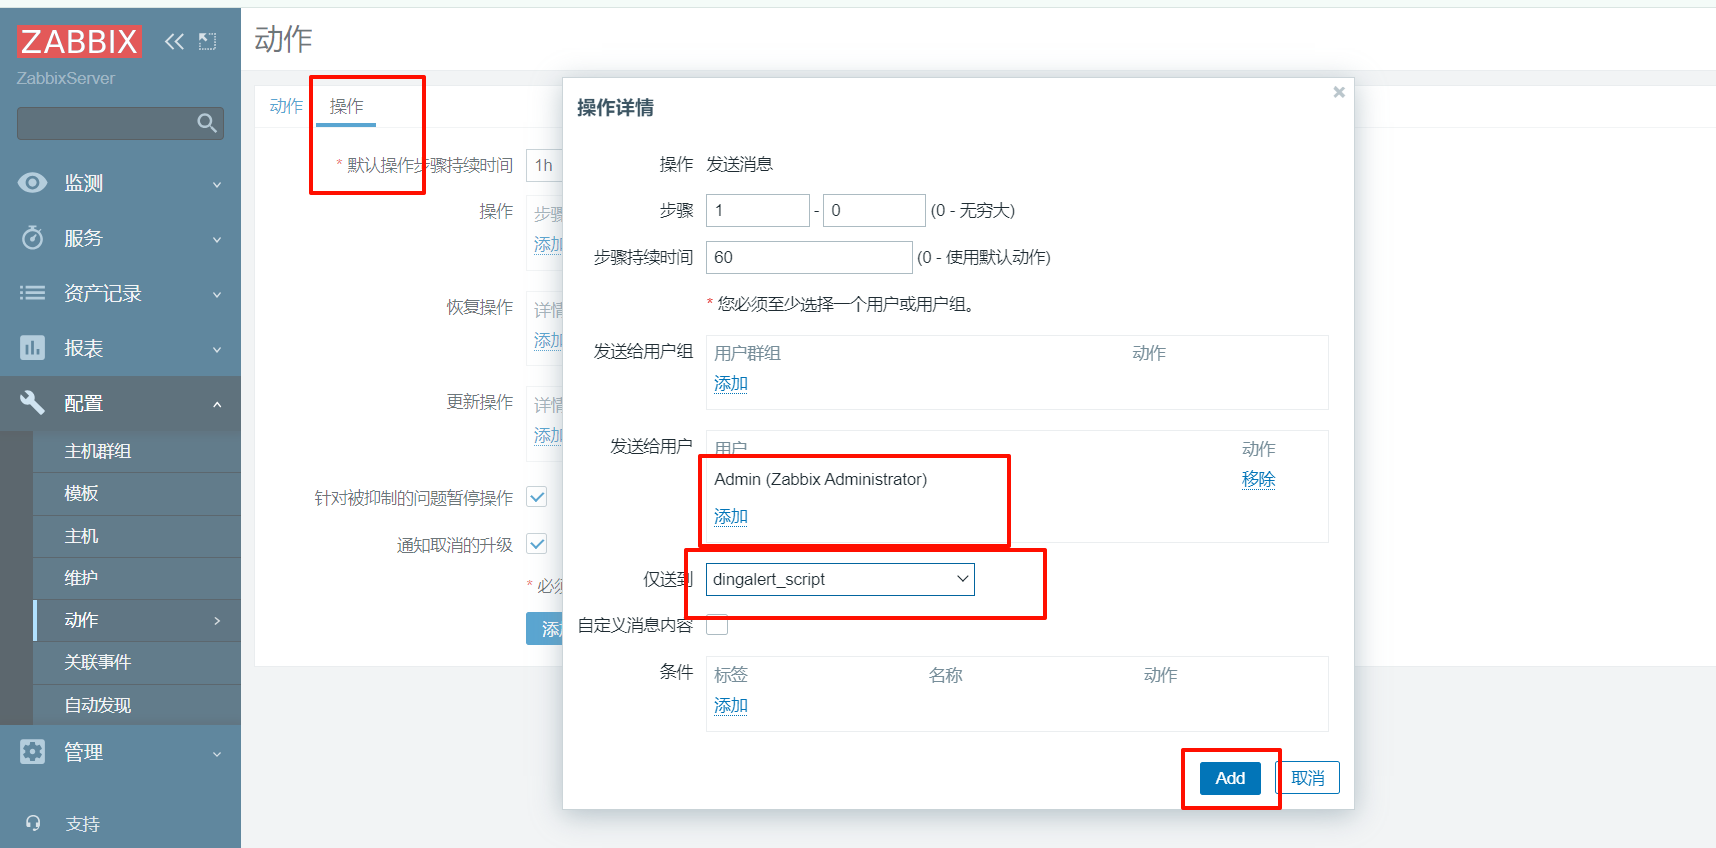
(5)、添加动作
每间隔一分钟发一次消息
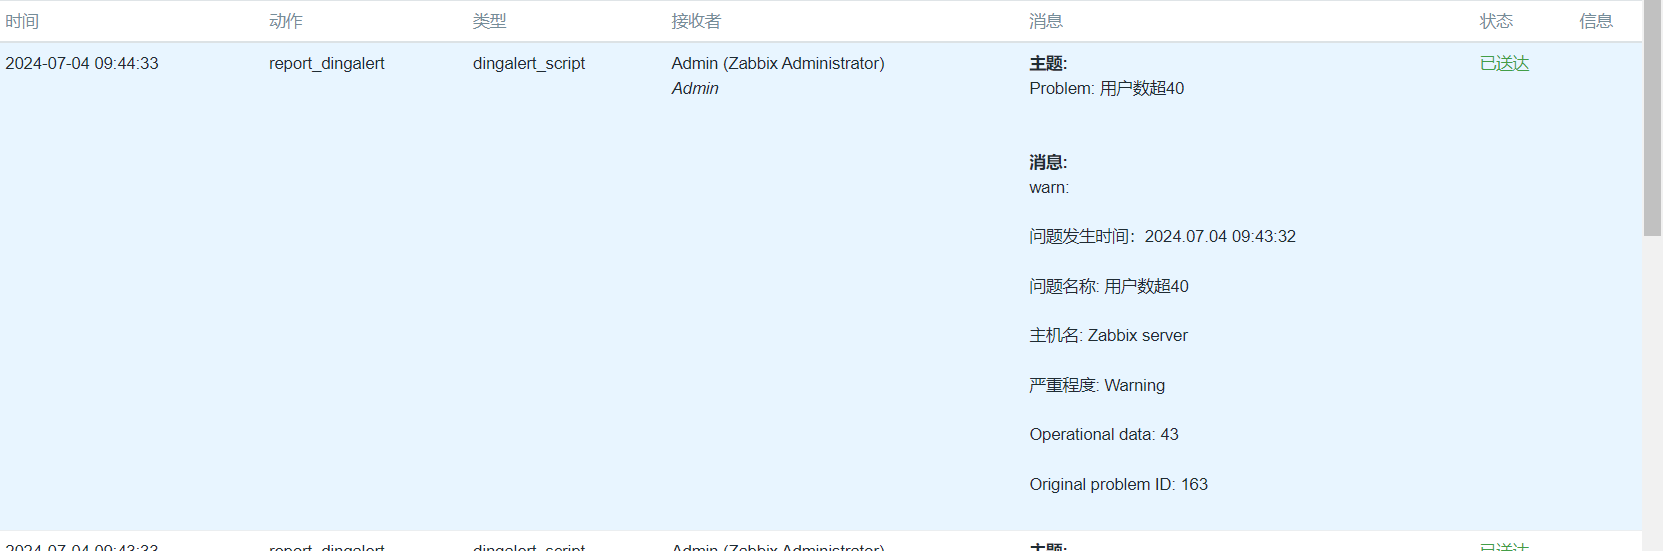
(6)、测试
[root@ZabbixServer:192.168.121.5 ~]$for i in {1..8}
> do
> useradd user${i}
> done
[root@ZabbixServer:192.168.121.5 ~]$zabbix_get -s 127.0.0.1 -k usercnt
43
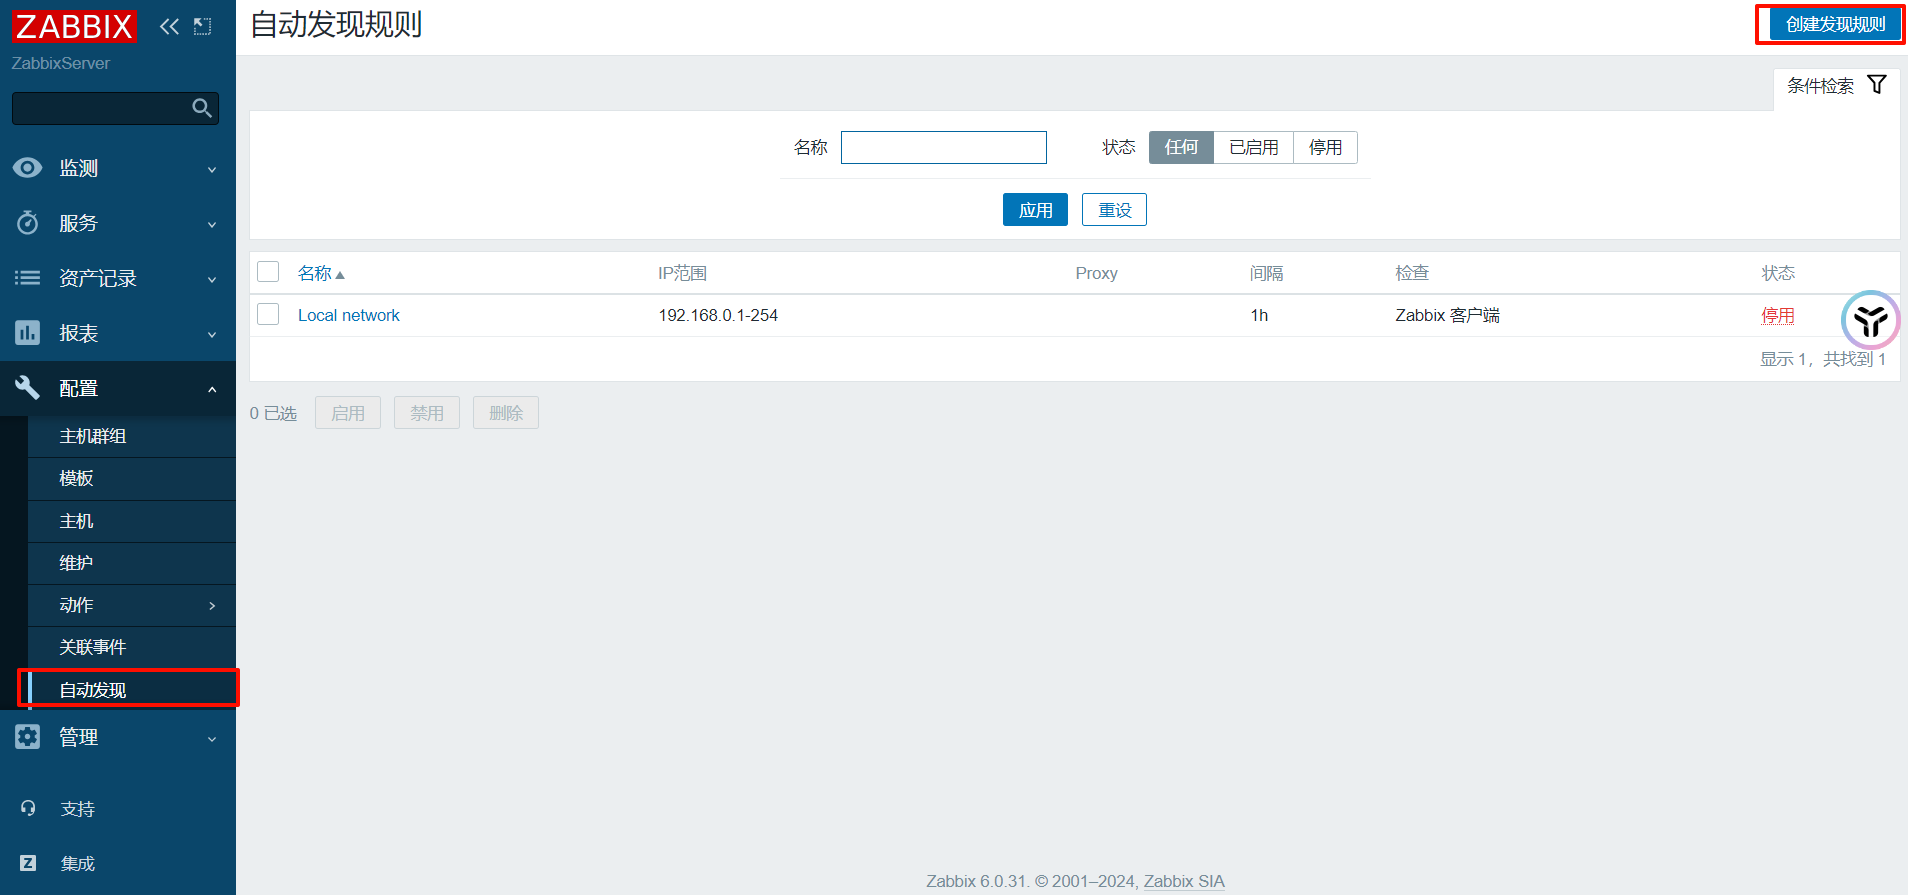
【8】、自动发现
- 当被监控的设备非常多的时候,手工添加见会变得非常不方便
- 可以使用自动发现功能,实现添加主机、添加到主机组、链接模板
- 自动发现流程
- 创建自动发现规则
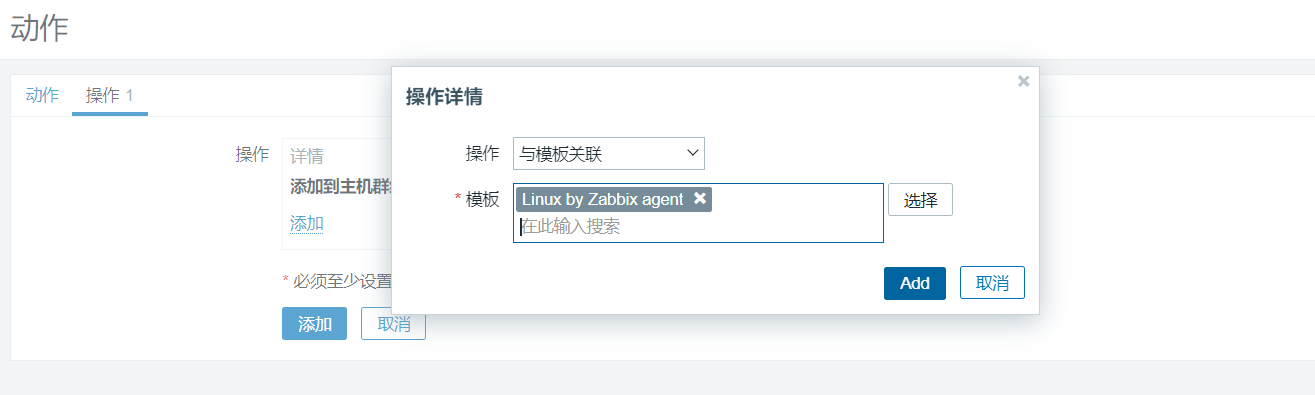
- 创建动作,当主机被发现后,执行什么操作
- 通过动作,添加主机,将模板应用到发现的主机
1、创建自动发现规则
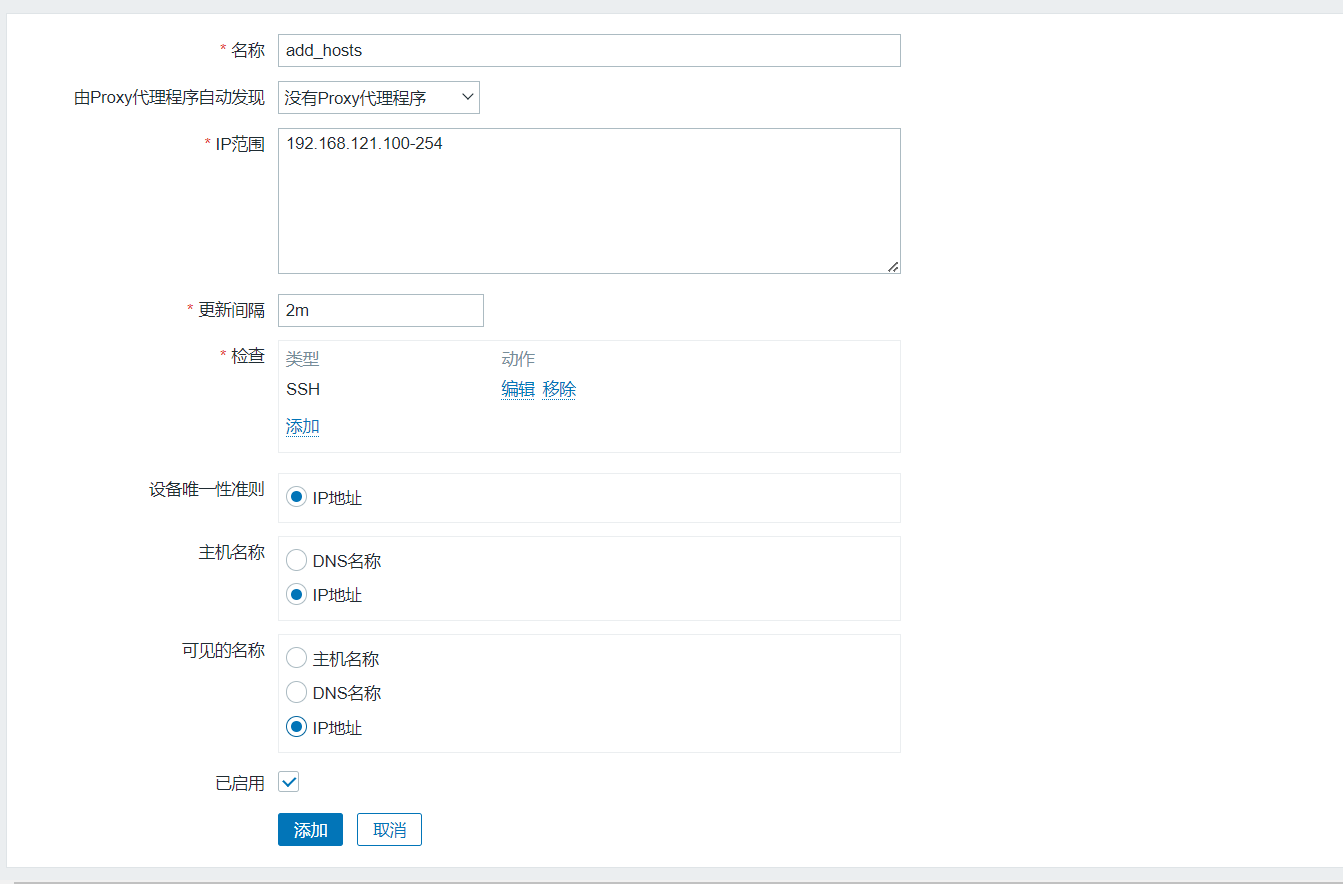
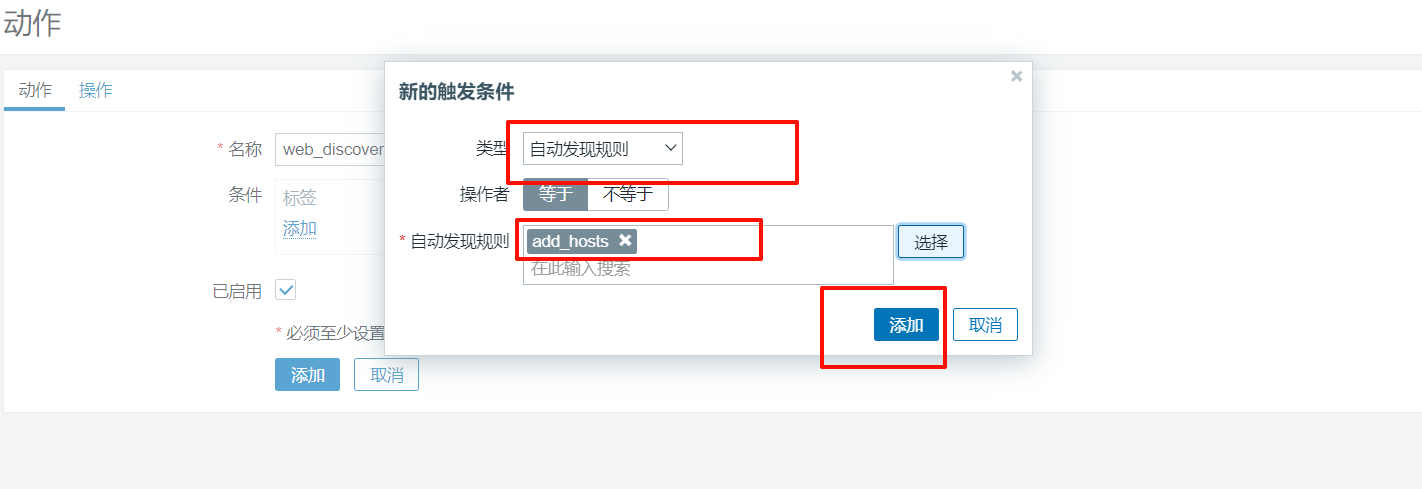
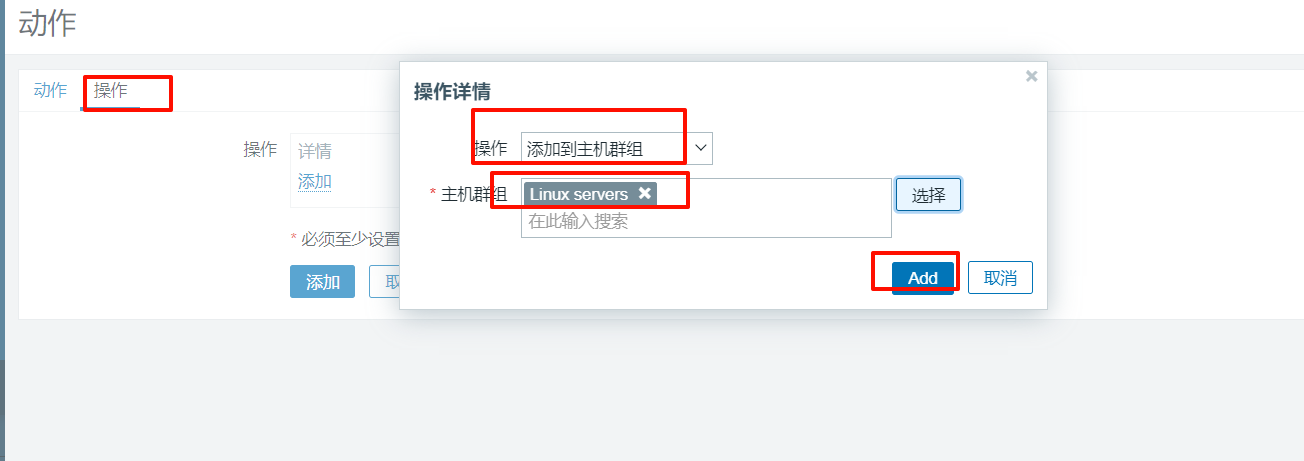
2、创建发现动作
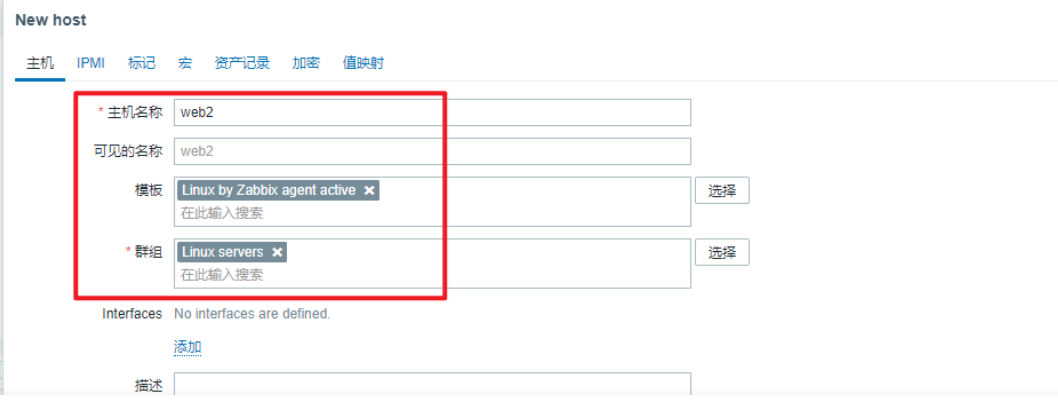
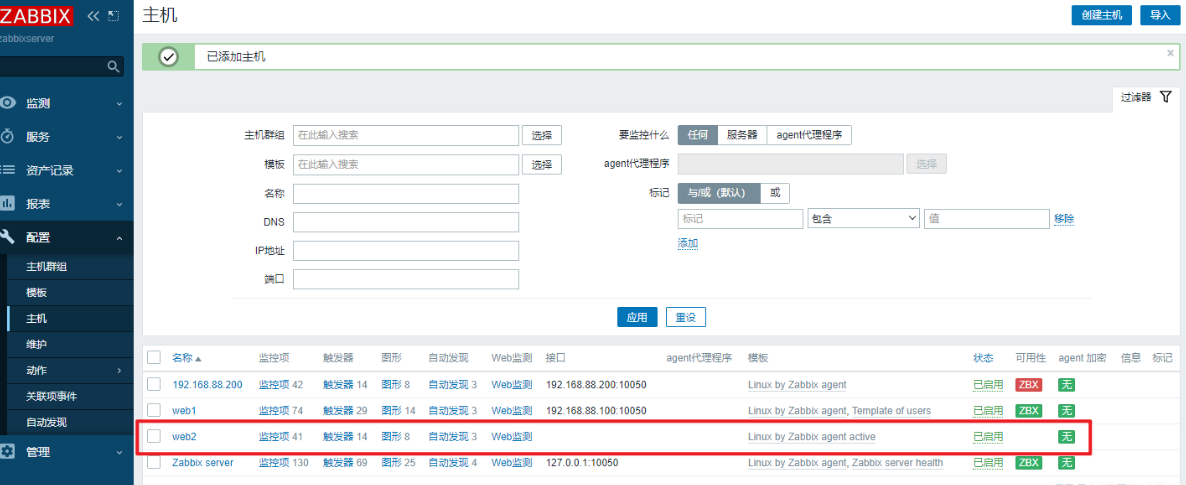
【9】、主动监控
- 默认zabbix使用的是被动监控,住被动监控都是针对被监控主机而言的
- 被动监控:Server向Agent发起请求,索取监控数据,此种模式常用
- 主动监控:Agent向Server发起请求,向Server汇报
1、修改配置文件
[root@web2 ~]# vim /etc/zabbix/zabbix_agentd.conf
117 # Server=127.0.0.1,192.168.88.5
142 StartAgents=0
171 ServerActive=192.168.88.5
242 RefreshActiveChecks=120

# 重启服务
[root@web2 ~]# systemctl restart zabbix-agent.service
	# 端口号消失
[root@web2 ~]# ss -tlnp | grep :10050
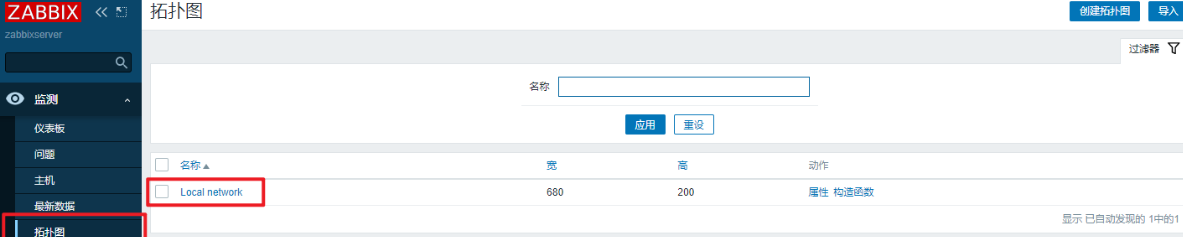
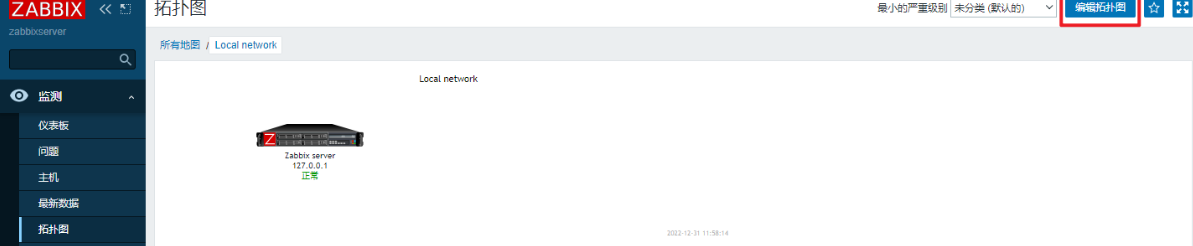
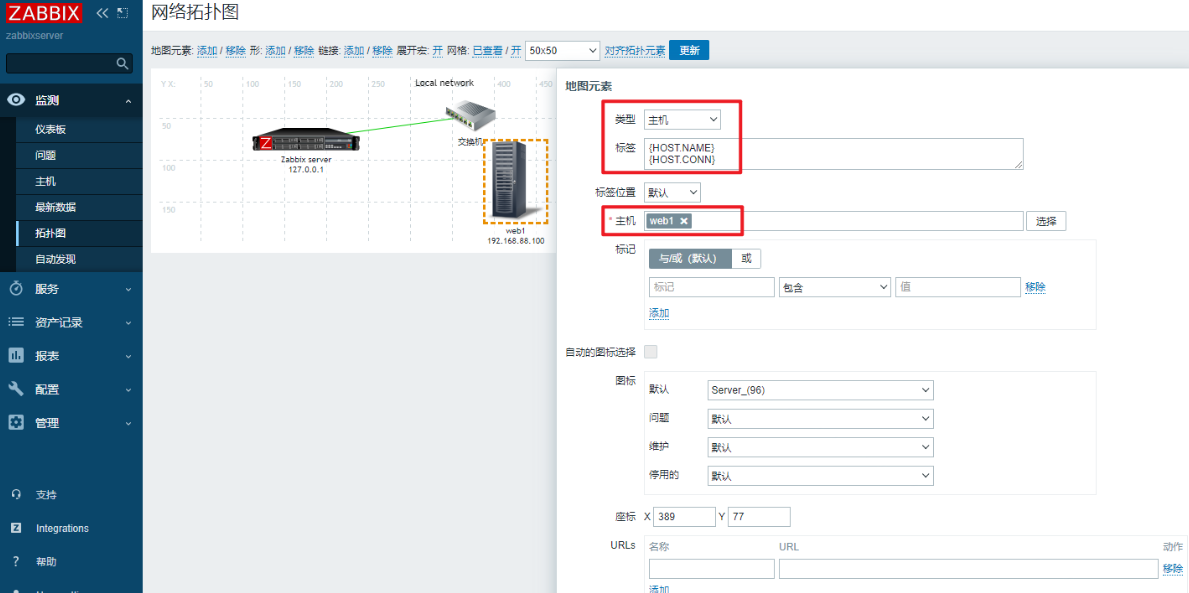
【10】、拓扑图
- 在zabbix中可以搭建拓扑图,反映拓扑结构
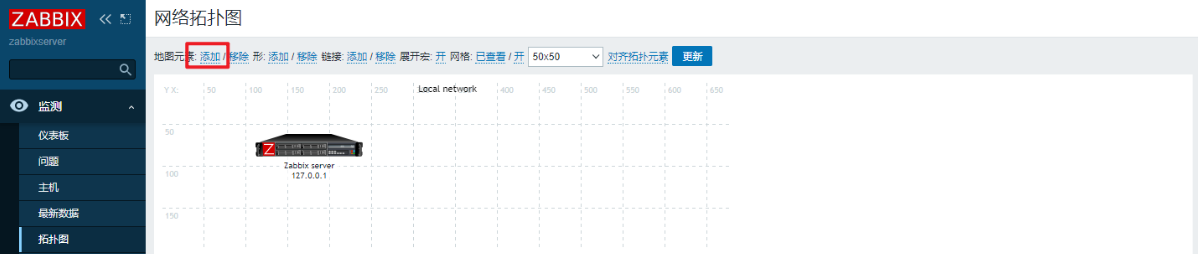
- 添加元素:
- 地图元素:可以是一个装饰图形,也可以对应具体的设备
- 形状:长方形、圆形
- 链接:连线,多个设备之间才能使用链接
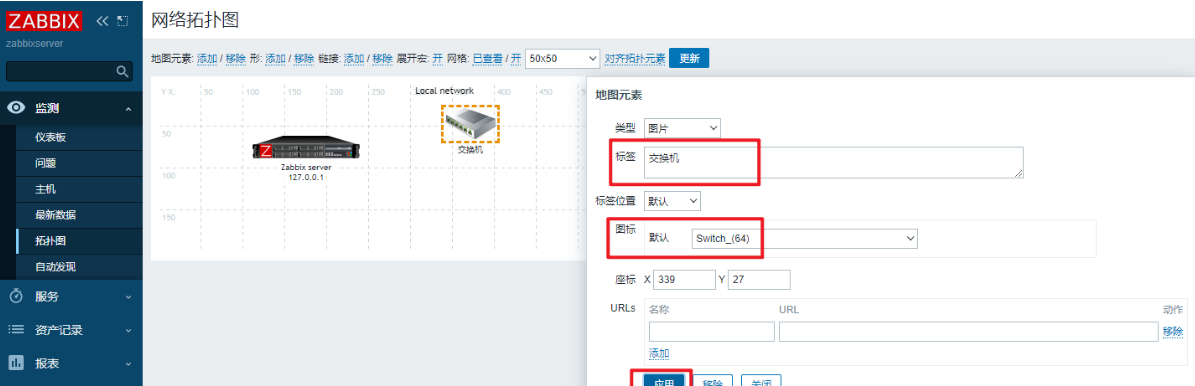
1、完善拓扑图
- 添加交换机图标
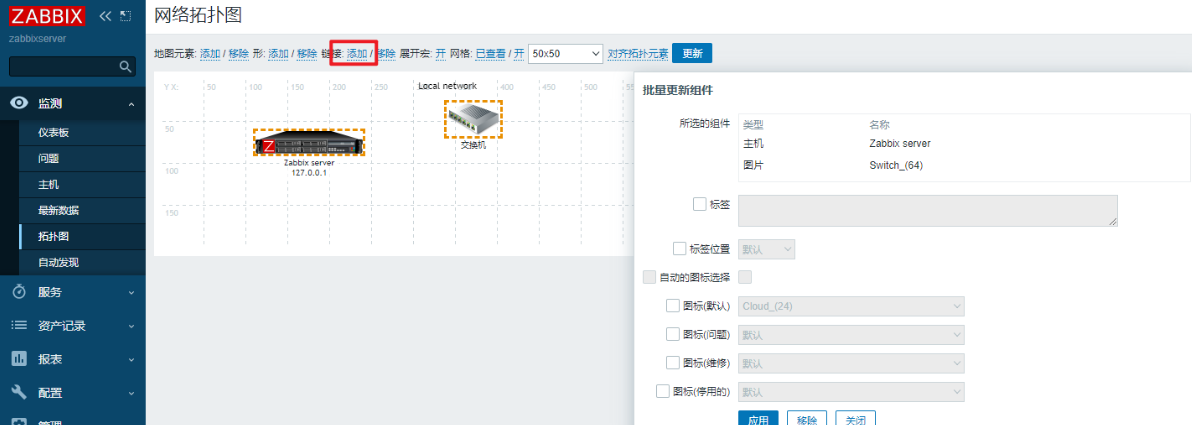
- 添加链接:按住ctrl键,点选两台设备,点链接边上的添加
- 添加web服务器
【11】、监控nginx
1、stub_status模块
- 用于实时监控ngnix的网络链接,这个模块是nginx官方提供的一个模块
# 配置nginx,在nginx配置文件中加入
location /status {
    stub_status on;
}

# 访问测试
[root@web1:192.168.121.100 ~]$curl http://192.168.121.100/status
Active connections: 1
server accepts handled requests
 1 1 1
Reading: 0 Writing: 1 Waiting: 0
# Active connections:当前客户端与nginx之间的连接数。它等于下面Reading / Writing / Waiting之和
# accepts:自nginx启动之后,客户端访问的总量
# handled:自nginx启动之后,处理过的客户端连接总数,通常等于accepts的值。
# requests:自nginx启动之后,处理过的客户端请求总数。
# Reading:正在读取客户端的连接总数。
# Writing:正在向客户端发送响应的连接总数。
# Waiting:空闲连接
2、编写脚本,获取各项数据
#!/bin/bash


case $1  in
Active)
		curl -s  http://192.168.121.100/status | awk '/Active/{print $NF}'
		;;
accepts)
		curl -s  http://192.168.121.100/status | awk 'NR==3{print $1}'
		;;
handled)
		curl -s  http://192.168.121.100/status | awk 'NR==3{print $2}'
		;;
requests)
		curl -s  http://192.168.121.100/status | awk 'NR==3{print $3}'
		;;
Reading)
		curl -s  http://192.168.121.100/status | awk '/Reading/{print $2}'
		;;
Writing)
		curl -s  http://192.168.121.100/status | awk '/Writing/{print $4}'
		;;
Waiting)
		curl -s  http://192.168.121.100/status | awk '/Waiting/{print $NF}'
		;;
esac
设置key值
# key的语法格式

UserParameter=key[*],<command> $1

# key[*]中的*是参数,将会传给后面的位置变量$
UserParameter=nginx_status[*],/usr/local/bin/nginx_status.sh $1
[root@web1:192.168.121.100 ~]$zabbix_get -s 127.0.0.1 -k nginx_status[Active]
1
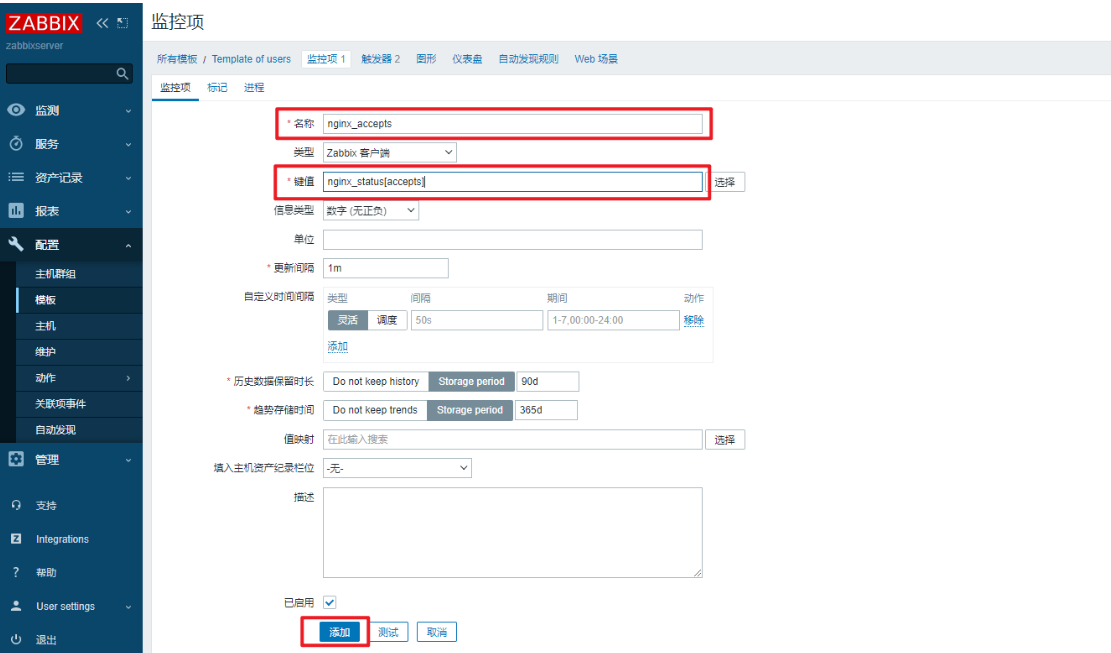
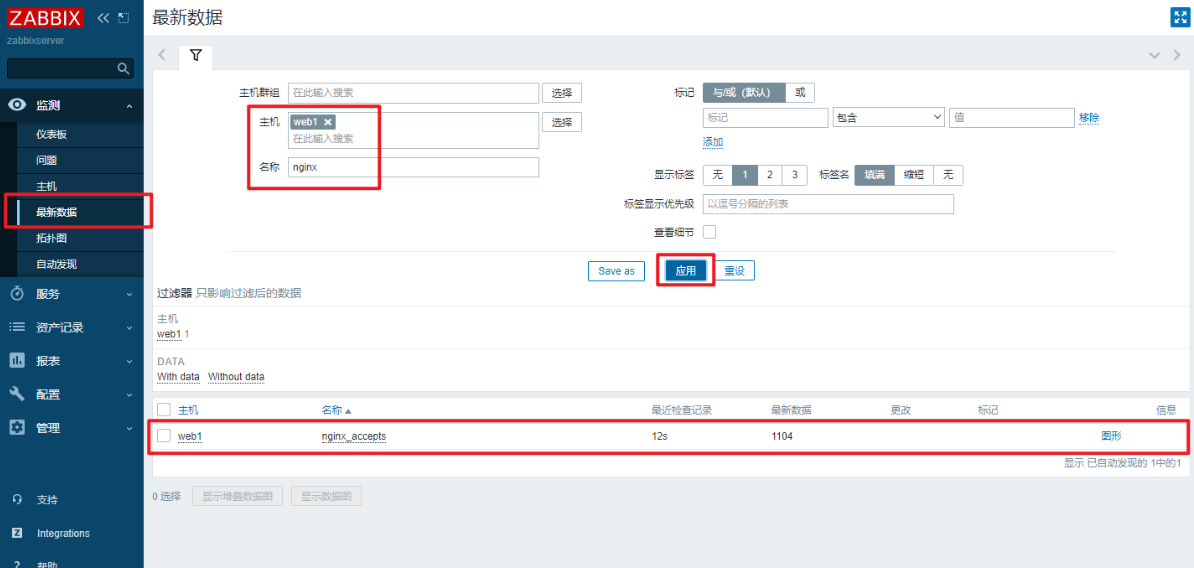
3、在zabbix上创建监控项
三、Prometheus
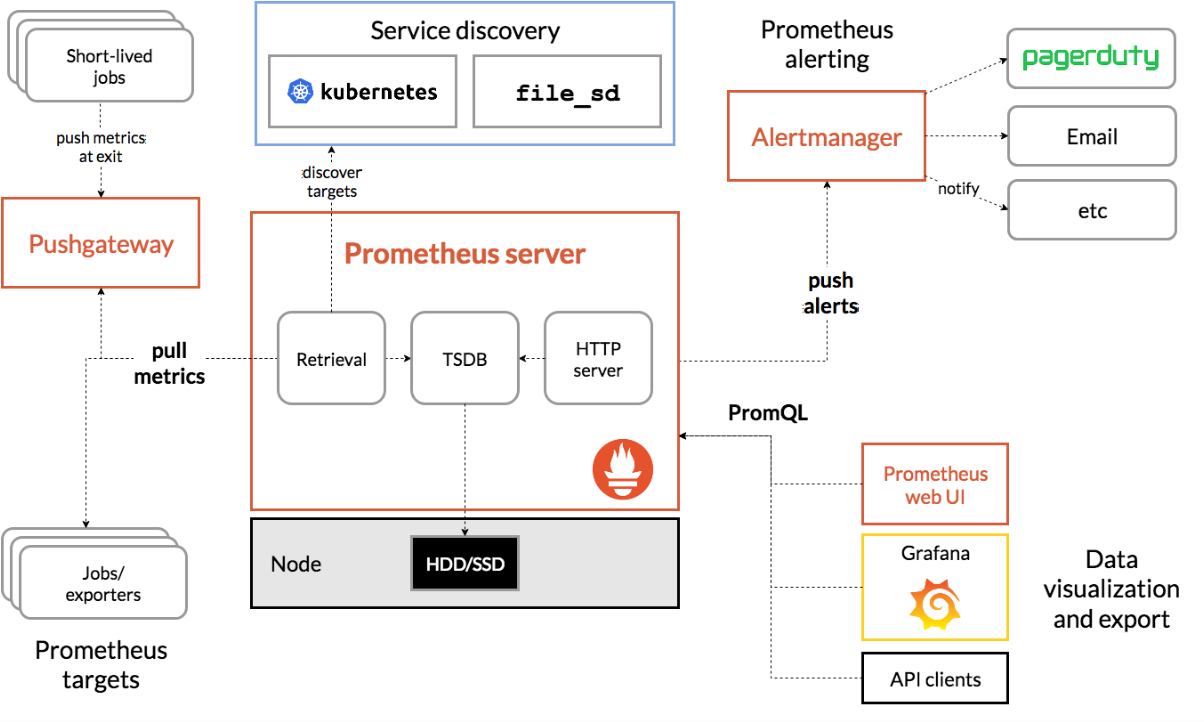
- Prometheus是一个开源的监控和报警工具包,最初由SoundCloud构建
- 也是一款监控软件,也是一个时序数据库(tsdb)。Prometheus将其指标收集并存储为时间序列数据,即指标信息与记录时的时间戳以及成为标签的可选键值对一起存储
- 主要使用在容器监控方面,也可以用于常规的主机监控
- 主要使用Google公司开发的go语言编写
- Prometheus是一个框架,可以和其他组件完美结合
本文来自博客园,作者:Linux小菜鸟,转载请注明原文链接:https://www.cnblogs.com/xuruizhao/p/18308806