matplotlib bar函数重新封装
参考: https://blog.csdn.net/jenyzhang/article/details/52047557
https://blog.csdn.net/liangzuojiayi/article/details/78187704
需求:
封装一个带分组功能的bar绘制函数
绘制效果:
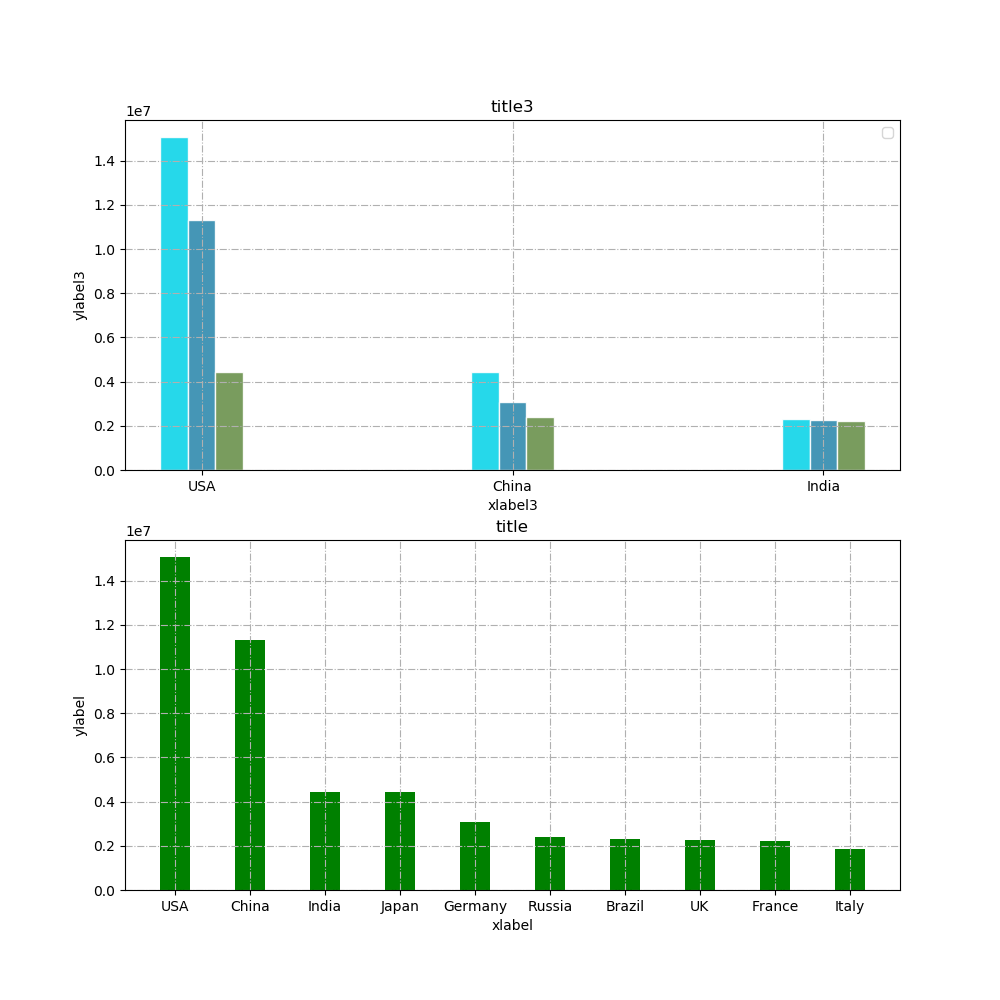
代码:
 1 # -*- coding: utf-8 -*-
 2 import numpy as np
 3 import matplotlib.pyplot as plt
 4
 5 class Bar(object):
 6     r'''
 7     请使用with打开绘图
 8     '''
 9     def __init__(self):
10         self.colors=[
11             "#0ed4e8",
12             "#318bae",
13             "#6b914c",
14             "#8492c3",
15             "#495aa2",
16             "#6841ac",
17             "#aa6547",
18             "#aaa350",
19         ]
20
21     def __call__(self,quants=None,labels=None,**kwargs):
22         self.draw(quants,labels,**kwargs)
23     def __enter__(self):
24         plt.figure(figsize=(10,10))
25         return self
26     def __exit__(self, exc_type, exc_val, exc_tb):
27         plt.show()
28         plt.close()
29     def draw(self,quants=None,labels=None,**kwargs):
30         if not quants:
31             print('数据为空')
32             return
33         if type(quants[0]) == int or type(quants[0]) == float:
34             num_label = 1
35             isInt = True
36         else:
37             num_label = len(quants[0])
38             isInt = False
39         width = 0.4
40         ind = np.linspace(0.5, 9.5, len(quants))
41         X=ind - width / 2
42         xlabels_pos=X+(num_label-1)*width / 2
43         if isInt:
44             plt.bar(X, quants, width, color='green')
45         else:
46             quants=np.array(quants)
47             if type(kwargs.get('classlabels', '')) == list:
48                 classlabels = kwargs.get('classlabels', '')
49                 plt.legend(loc='upper right')
50             else:
51                 classlabels = ['']*len(quants[0])
52             for i in range(len(quants[0])):
53                 plt.bar(X+width*i, quants[:,i], alpha=0.9, width=width, facecolor=self.colors[i], edgecolor='white', label=classlabels[i], lw=1)
54         # labels
55         plt.xlabel(kwargs.get('xlabel', 'x'))
56         plt.ylabel(kwargs.get('ylabel', 'y'))
57         if not labels:
58             labels = list(range(1, len(quants) + 1))
59         plt.xticks(xlabels_pos, labels)
60         # title
61         plt.title(kwargs.get('title', ''))
62         plt.grid(linestyle='-.')
63
64 if __name__=="__main__":
65     labels = ['USA', 'China', 'India', 'Japan', 'Germany', 'Russia', 'Brazil', 'UK', 'France', 'Italy']
66     quants = [15094025.0, 11299967.0, 4457784.0, 4440376.0, 3099080.0, 2383402.0, 2293954.0, 2260803.0, 2217900.0,
67               1846950.0]
68     labels3 = ['USA', 'China', 'India']
69     quants3= [[15094025.0, 11299967.0, 4457784.0], [4440376.0, 3099080.0, 2383402.0], [2293954.0, 2260803.0, 2217900.0]]
70     with Bar() as bar:
71         plt.subplot(2,1,1)
72         bar(quants3,labels3,xlabel="xlabel3",ylabel='ylabel3',title='title3',classlabels=["A",'B','C'])
73         plt.subplot(2, 1, 2)
74         bar(quants, labels, xlabel="xlabel", ylabel='ylabel', title='title',)
