R语言实战-如何分析QQ群记录3-每个时间段数据
构思步骤:
1、从data中取出时间数据。
2、从时间数据中提取小时数据。
3、根据日期数据进行汇总每小时的消息数量。
4、利用ggplot2进行绘图。
#获取data中的时间属性
time<-data$dateTime
#抽取其中的时间,抛弃日期
q<-paste(hour(time))
#把q转换成数据框
time1<-data.frame(q)
#根据time1中的q进行分组,把q列名称变为time,根据q的数量进行分组
timeFenzu<-sqldf("select q times,count(*) Freq from time1 group by q")
#利用order进行升序排序,由于timeFenzu$times是character类型,要先转为数值型
timeFenzu<-timeFenzu[order(as.numeric(timeFenzu$times)),]
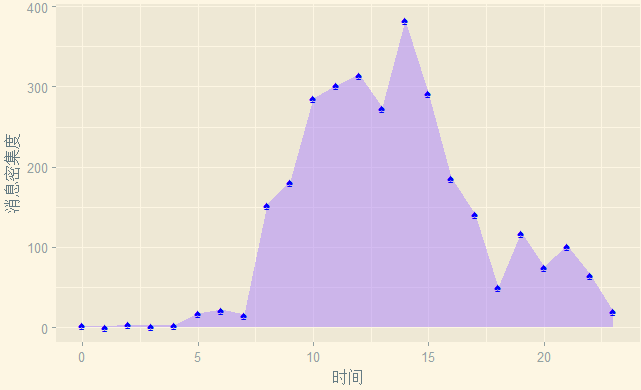
#开始用ggplot绘图
ggplot(timeFenzu,aes(x=as.numeric(times),y=Freq))+
#绘制密度图,向下填充颜色为中紫色,透明度为0.5
geom_area(fill="mediumpurple1",alpha=0.5)+
#绘制顶点,顶点为♠标记,大小为3,颜色为蓝色
geom_point(shape="♠",size=3,colour="blue")+
#x坐标轴名称为时间,y坐标轴名称为消息密集度
xlab("时间")+ylab("消息密集度")+
#设置图表的主题
theme_solarized_2()
生成图如下: