echarts折线区域图

一、使用场景

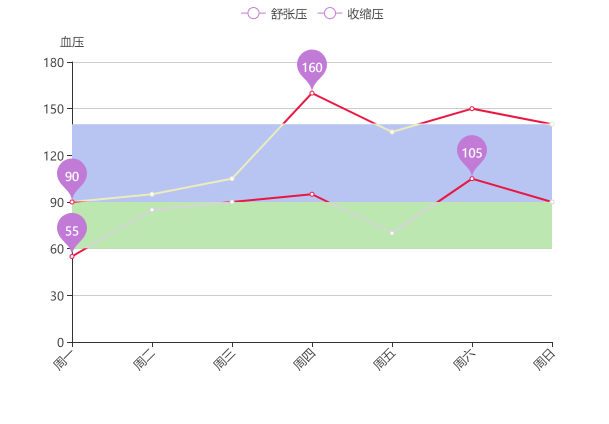
   当舒张压和收缩压超过或低于他们对应的范围时,折线应该给与不同颜色。两个指标对应的范围也要填充不同的颜色。


二、实现方案

  主要使用了echarts中的visualMap,series.markArea;visualMap作用是定义数据范围,利用不同范围定义不同的颜色,其中visualMap.seriesIndex的值对应series.data。seriesIndex=0 ->series[0]. markArea则是定义区域范围并填充颜色. 

visualMap


 markArea: {
                  silent:false,
                  itemStyle:{
                    color:'#BCE7B1'
                  },
                  data: [
                    [{
                      name: '',
                      yAxis: 60
                    },
                    {
                      yAxis: 90
                    }]
                  ],
                },
markArea

完整option代码

this.option={
            tooltip : {
              trigger: 'axis'
            },
            legend: {
              data:['舒张压','收缩压']
            },
            calculable : true,

            xAxis : [
              {
                type : 'category',
                boundaryGap : false,
                axisLabel:{
                  rotate:45,
                  interval:0
                },
                data : ['周一','周二','周三','周四','周五','周六','周日']
              }
            ],
            yAxis : [
              {
                name:'血压',
                type : 'value',
                axisLabel : {
                  formatter: '{value}'
                }
              }
            ],
            visualMap: [
              {
                show: false,
                seriesIndex:0,
                pieces: [
                  {
                    gt:0,
                    lte:60,
                    color:'#e91642'
                  },
                  {
                    gt: 60,
                    lte: 90,        
                    color: '#D5D5D5'
                  },
                  {
                    gt: 90,          
                    let:200,
                    color: '#e91642'
                  }
                  ]
              },
              {
                show: false,
                seriesIndex:1,
                pieces:[
                  {
                    gt:0,
                    lte:90,
                    color:'#e91642'
                  },
                  {
                  gt: 90,
                  lte: 140,          
                  color: '#EBEBBE'
                }, {
                  gt: 140,          
                  let:200,
                  color: '#e91642'
                }]
              }
            ],
            series : [
              {
                name:'舒张压',
                type:'line',
                data:[55, 85, 90, 95, 70,105, 90],
                markPoint : {
                  data : [
                    {type : 'max', name: '最大值'},
                    {type : 'min', name: '最小值'}
                  ]
                },
                markArea: {
                  silent:false,
                  itemStyle:{
                    color:'#BCE7B1'
                  },
                  data: [
                    [{
                      name: '',
                      yAxis: 60
                    },
                    {
                      yAxis: 90
                    }]
                  ],
                },
              },
              {
                name:'收缩压',
                type:'line',
                data:[90, 95, 105, 160, 135, 150, 140],
                markPoint : {
                  data : [
                    {type : 'max', name: '最大值'},
                    {type : 'min', name: '最小值'}
                  ]
                },
                markArea: {
                  silent:false,
                  itemStyle:{
                    color:'#B8C4F1'
                  },
                  data: [
                    [{
                      name: '',
                      yAxis: 90
                    },
                      {
                        yAxis: 140
                      }]
                  ],
                },
              }
            ]
          };


posted @ 2018-10-17 10:41  蝈民党  阅读(6943)  评论(0编辑  收藏  举报