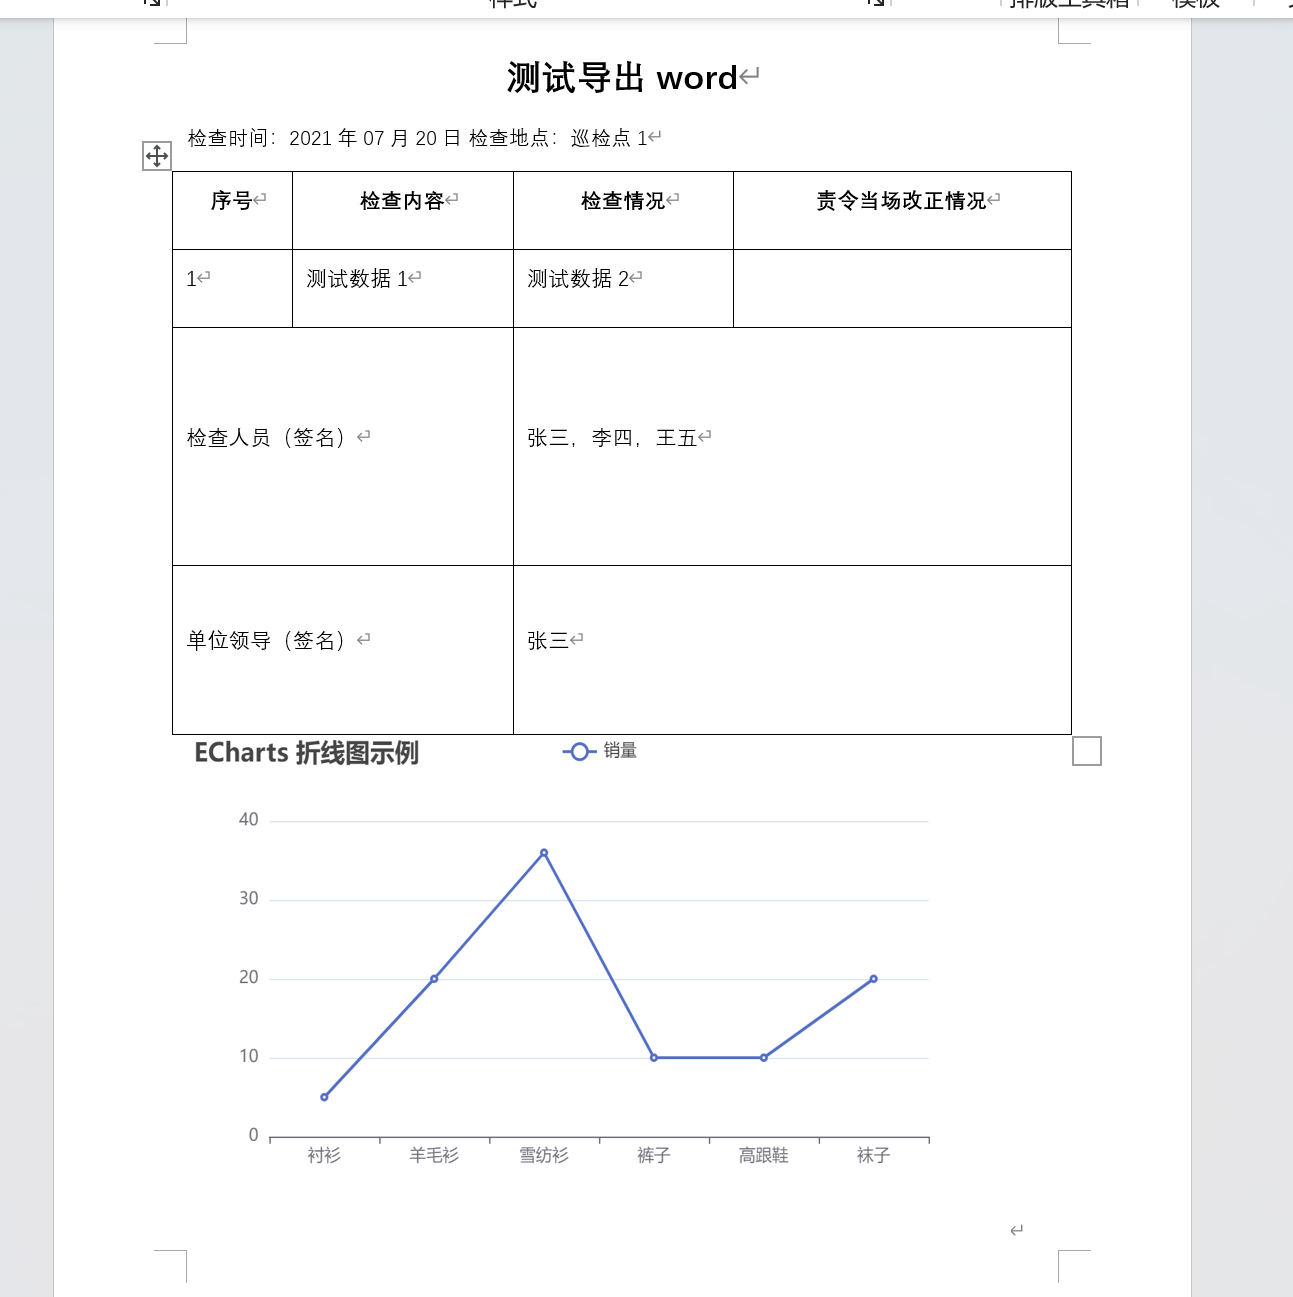
html-docx-js 导出word
1:列表页面按钮
<el-button
type="warning"
plain
icon="el-icon-download"
size="mini"
@click="exportWorddata"
>导出word</el-button>
<ExportWord ref="exportWord"/>
import ExportWord from './ExportWord.vue'
components: { ExportWord },
exportWorddata(){
this.$refs.exportWord.initdata()
},
2:导出页面 点击 初始化echarts 点击 初始化echarts图片 点击 导出
<template >
<el-dialog :title="title" :visible.sync="open" width="60%" append-to-body>
<div slot="footer">
<el-button type="primary" @click="daochu">导出</el-button>
<el-button type="primary" @click="initdata">初始化echarts</el-button>
<el-button type="primary" @click="getImg">初始化echarts图片</el-button>
<el-button @click="cancel">关 闭</el-button>
</div>
<div id="htmlcontent">
<div id="demo">
<div class="toptitle">测试导出word</div>
<div class="title_sub">
<span>检查时间:2021年07月20日</span
>
<span>检查地点:巡检点1</span>
</div>
<table border="1" class="table_style">
<!-- 头 -->
<thead>
<th>序号</th>
<th>检查内容</th>
<th>检查情况</th>
<th>责令当场改正情况</th>
</thead>
<!-- body -->
<tbody>
<tr v-for="(item, i) in approvalLogs" :key="i">
<td>{{ i + 1 }}</td>
<td>{{ item.approveMsg }}</td>
<td>{{ item.approveDate }}</td>
</tr>
<tr style="height: 150px">
<td colspan="2">检查人员(签名)</td>
<td colspan="2">张三,李四,王五</td>
</tr>
<tr style="height: 100px">
<td colspan="2">单位领导(签名)</td>
<td colspan="2">张三</td>
</tr>
</tbody>
</table>
<img :src="imgSrc" width="590" height="360" />
<div style="height: 350px; width: 600px">
<div id="juZuChart1" style="height: 100%; width: 100%" />
</div>
</div>
</div>
</el-dialog>
</template>
<script>
// npm install file-saver
// npm install html-docx-js
import htmlDocx from "html-docx-js/dist/html-docx";
import FileSaver from "file-saver";
import * as echarts from 'echarts';
export default {
data() {
return {
title: "",
open: false, // 表单参数
myChart:null,
imgSrc:'',
approvalLogs:[
{
approveMsg:"测试数据1",
approveDate:"测试数据2"
}
],
};
},
mounted() {
},
methods: {
// 取消按钮
cancel() {
this.open = false;
},
initdata (){
let _this = this;
_this.open = true;
_this.title = "导出word";
this.initEchart()
},
daochu(){
let contentHtml = document.getElementById("htmlcontent").innerHTML;
let cssHTML = `#demo {
width: 800px;
margin: auto;
padding: 40px;
box-sizing: border-box;
}
#demo .toptitle {
width: 100%;
text-align: center;
font-size: 25px;
font-weight: bold;
}
#demo .title_sub {
padding: 30px 0;
}
.table_style td,
th {
padding: 10px;
font-size: 15px;
}
.table_style {
border-collapse: collapse;
width: 100%;
text-align: left;
}`;
let content = `
<!DOCTYPE html><html>
<head>
<meta http-equiv="Content-Type" content="text/html; charset=UTF-8">
<style>
${cssHTML}
</style>
</head>
<body>
${contentHtml}
</body>
</html>`;
let converted = htmlDocx.asBlob(content);
FileSaver.saveAs(converted, "测试导出.docx");
},
//*************Echart数据************************
initEchart() {
// 基于准备好的dom,初始化echarts实例
this.myChart = echarts.init(document.getElementById('juZuChart1'));
// 指定图表的配置项和数据
let option = {
title: {
text: 'ECharts 折线图示例'
},
tooltip: {},
legend: {
data:['销量']
},
xAxis: {
data: ["衬衫","羊毛衫","雪纺衫","裤子","高跟鞋","袜子"]
},
yAxis: {},
series: [{
name: '销量',
type: 'line',
data: [5, 20, 36, 10, 10, 20]
}]
};
// 使用刚指定的配置项和数据显示图表。
this.myChart.setOption(option)
},
// 获取echarts图片
getImg() {
this.imgSrc = this.myChart.getDataURL({
type: 'png',
pixelRatio: 2,
backgroundColor: '#fff'
});
},
//*************Echart数据************************
},
computed: {
},
mounted() {
},
};
</script>
<style lang="scss" scoped>
.demo {
width: 800px;
margin: auto;
padding: 40px;
box-sizing: border-box;
}
.demo .toptitle {
width: 100%;
text-align: center;
font-size: 25px;
font-weight: bold;
}
.demo .title_sub {
padding: 30px 0;
}
.table_style td,
th {
padding: 10px;
font-size: 15px;
}
.table_style {
border-collapse: collapse;
width: 100%;
text-align: left;
}
</style>


【推荐】国内首个AI IDE,深度理解中文开发场景,立即下载体验Trae
【推荐】编程新体验,更懂你的AI,立即体验豆包MarsCode编程助手
【推荐】抖音旗下AI助手豆包,你的智能百科全书,全免费不限次数
【推荐】轻量又高性能的 SSH 工具 IShell:AI 加持,快人一步
· TypeScript + Deepseek 打造卜卦网站:技术与玄学的结合
· Manus的开源复刻OpenManus初探
· AI 智能体引爆开源社区「GitHub 热点速览」
· 三行代码完成国际化适配,妙~啊~
· .NET Core 中如何实现缓存的预热?