pca , nmds , pcoa 图添加分组的椭圆
对于pca , nmds, pcoa 这些排序分析来说,我们可以从图中看出样本的排列规则,比如分成了几组。
为例样本分组更加的直观,我们可以根据实验设计时的样本分组情况,对属于同一个group的样本添加1个椭圆或者其他多边形。
新版本的ggplot2 中提供了stat_ellipse 这个stat, 可以方便的实现上面的效果。
代码示例:
ggplot(faithful, aes(waiting, eruptions, color = eruptions > 3)) +
  geom_point() +
  stat_ellipse(level = 0.8) +
  stat_ellipse(level = 0.9)
效果图如下:

通过stat_ellipse 简单有方便,其中的level 参数指定了拟合椭圆的路径时的置信度,这个数值越大,椭圆覆盖的点就越多;
这里我添加两个椭圆,只是为了美观,ggplot2 图层叠加的语法使得添加多个椭圆这么方便,不得不为其设计者点赞;
在旧版本的ggplot2 中, 是没有stat_ellipse; 而官方的开发者在新版的ggplot2 中加入了这一功能,可想而知这个应用的受欢迎程度,
除了添加椭圆,也可以使用多边形来描述分组,也很美观,只不过代码没有椭圆那么简洁
代码示例:
library(ggplot2)
library(plyr)
ggplot(faithful, aes(waiting, eruptions, color = eruptions > 3)) +
  geom_point() +
  stat_ellipse()
# faithful
#  x  y  group
#  1  2   1
#  1  3   1
#  2  5   2
#  1  3   2
faithful$group <- 1
faithful$group[data$eruptions > 3] <- 2
find_hull <- function(df) df[chull(df[[1]], df[[2]]), ]
hulls <- ddply(faithful, "group", find_hull)
ggplot(faithful, aes(waiting, eruptions, color = eruptions > 3)) +
  geom_point() +
  geom_polygon(data = hulls, alpha = 0.5, aes(fill = factor(group)),show.legend = F)
效果图如下:
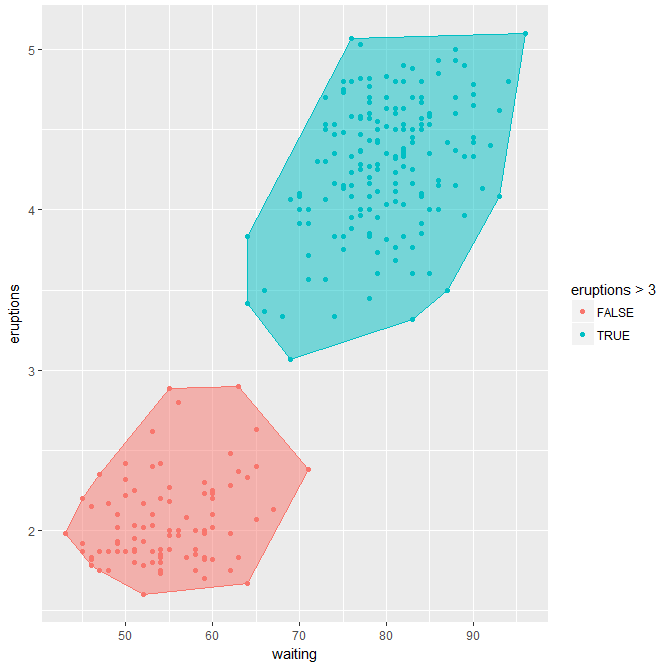
由于没有内置的stat 函数,所以添加了许多代码来计算对应的多边形的路径,如果将其写成对应的stat 函数,会更加的方便。
欢迎关注微信公众号<生信修炼手册>
