
par函数mgp 参数-控制坐标轴的位置
mgp 参数的值为长度为3的一个向量,默认值为 c(3, 1, 0); 3个数值控制的元素不同
1) 第一个数值:3, 控制xlab 和 ylab的位置
示例用法:
par(mfrow = c(1, 3), oma = c(1, 1, 1, 1))

plot(1:10, main = "main", sub = "sub", mgp = c(1, 1, 0))
box(which = "figure")
plot(1:10,main = "main", sub = "sub", mgp = c(2, 1, 0))
box(which = "figure")
plot(1:10, main = "main", sub = "sub",mgp = c(3, 1, 0))
box(which = "figure")
效果图如下:
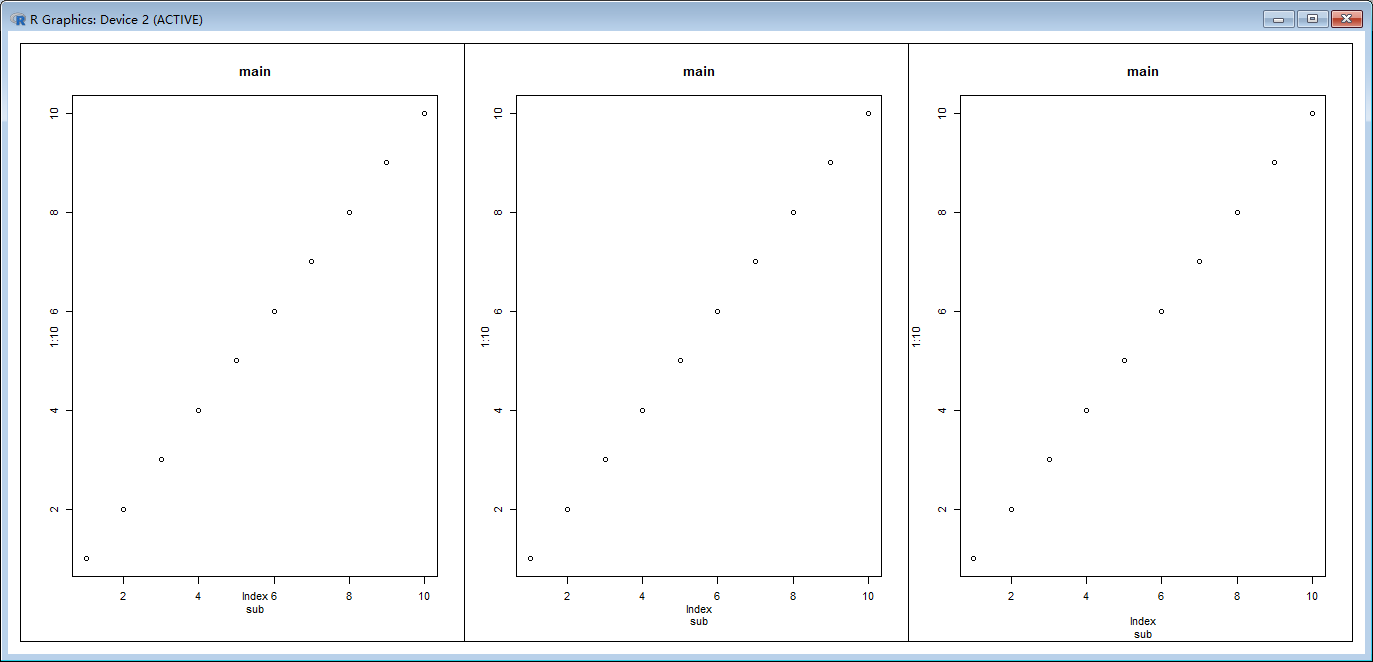
注意观察,xlab 和 ylab的位置,从左到右我分别设置了1到3; 从图中也可以看出来,影响的元素的包括xlab, ylab, sub
2) 第二个数值 1, 影响的是坐标轴的轴线的位置
示例用法:
par(mfrow = c(1, 3), oma = c(1, 1, 1, 1))

plot(1:10, main = "main", sub = "sub", mgp = c(3,1, 0))
box(which = "figure")
plot(1:10,main = "main", sub = "sub", mgp = c(3, 2, 0))
box(which = "figure")
plot(1:10, main = "main", sub = "sub",mgp = c(3, 3, 0))
box(which = "figure")
效果图如下:
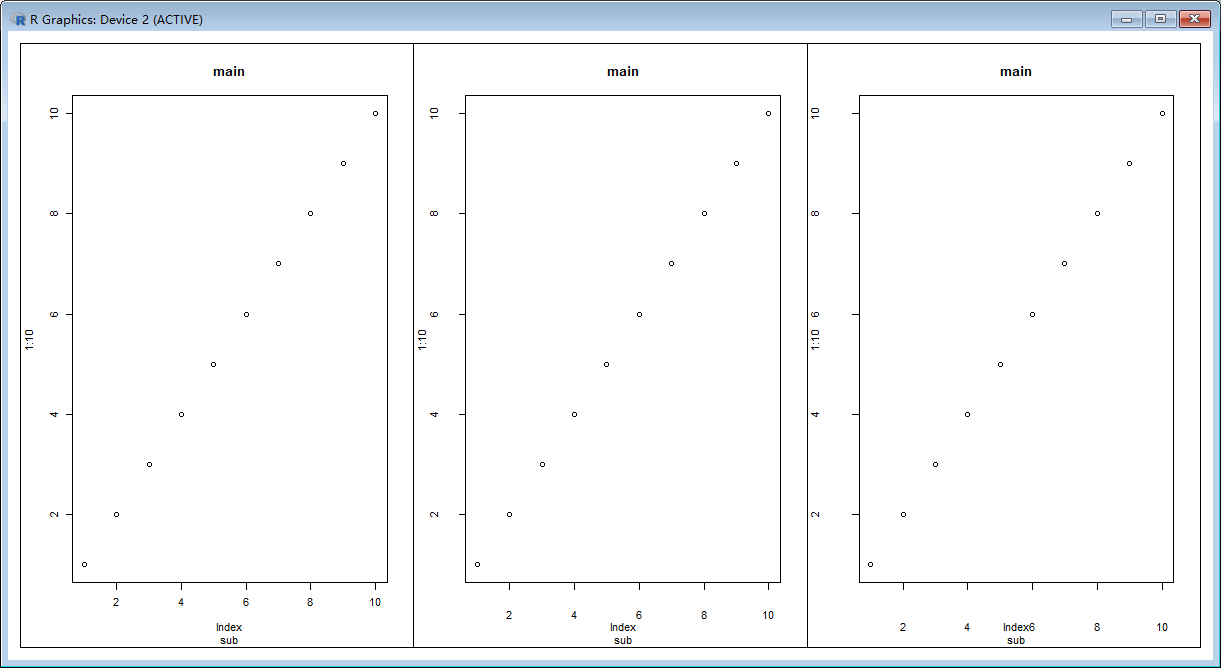
可以看出,受影响的元素为 坐标轴对应的标签的位置;
3) 第三个数值 0:
示例用法:
par(mfrow = c(1, 3), oma = c(1, 1, 1, 1))

plot(1:10, main = "main", sub = "sub", mgp = c(3,1, 0))
box(which = "figure")
plot(1:10,main = "main", sub = "sub", mgp = c(3, 1, 1))
box(which = "figure")
plot(1:10, main = "main", sub = "sub",mgp = c(3, 1, 2))
box(which = "figure")
效果图如下:
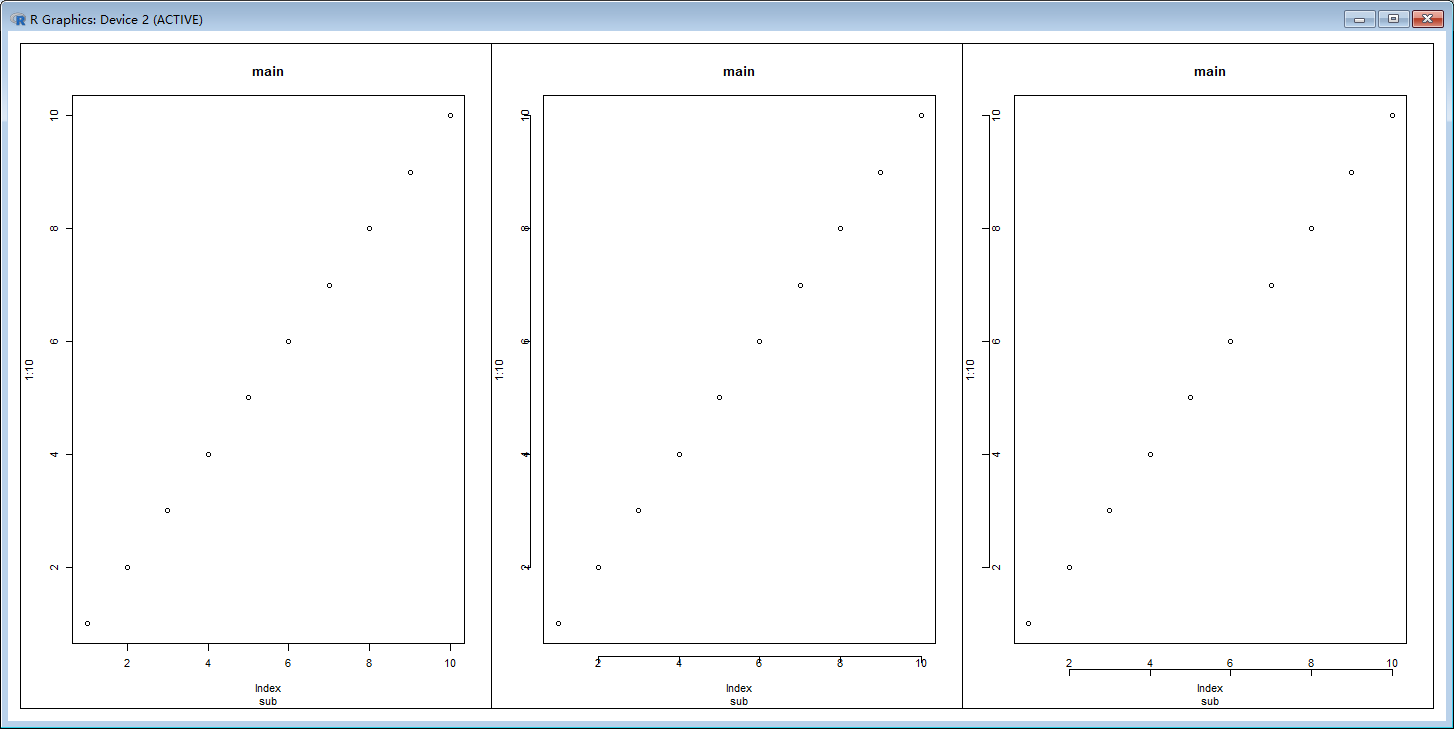
可以看到,影响的元素为坐标轴轴线的位置;
欢迎关注微信公众号<生信修炼手册>
