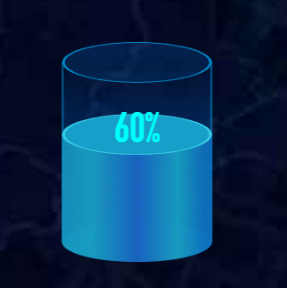
echarts 3D圆柱图


mounted() {
  this.$nextTick(() => {
      let d={
                color:"#FDB358",
                rbg:"253,179,88",
                rbg2:"253,227,100",
                pos:"contc1",
                barWidth:75,//柱子宽度
                schedule:70,//百分比
                circleHeight:30,// 顶、中、底部圆形的高度
     }    
        this.optionFn(d); //民主生活会进度 charts3        
       
   });
}
   optionFn (data) {
            let myChart = echarts.init(document.getElementById(data.pos));
            this.option = {
            xAxis: {
            data:10,
            show: false
            },
            yAxis: {
            splitLine: {
                show: false
            },
            axisTick: {
                show: false
            },
            axisLine: {
                show: false
            },
            axisLabel: {
                formatter: () => {
                return ''
                }
            }
            },
            series: [
            // 中间数据
            {
                name: '',
                type: 'bar',
                barWidth: data.barWidth, // 圆柱的宽度
                barGap: '-100%',
                itemStyle: {
                color: (params) => {
                    return new echarts.graphic.LinearGradient(
                    1,
                    0,
                    0,
                    0,
                    [
                        {
                        offset: 0.05,
                        color: 'rgba('+data.rbg+',0.9)'
                        },
                        {
                        offset: 0.23,
                        color: 'rgba('+data.rbg+',0.98)'
                        },
                        {
                        offset: 0.5,
                        color: 'rgba('+data.rbg2+',1)'
                        },
                        {
                        offset: 0.8,
                        color: 'rgba('+data.rbg2+',0.98)'
                        },
   
                        {
                        offset: 0.95,
                        color: 'rgba('+data.rbg+',0.9)'
                        }
                    ],
                    false
                    )
                }
                },
                data: [data.schedule]
            },
            // 底部圆形
            {
                name: '',
                type: 'pictorialBar', // 象形图
                symbolSize: [data.barWidth, data.circleHeight], // 象形图大小
                symbolOffset: [0, data.circleHeight / 2], // 位移
                z: 0,
                itemStyle: {
                color: (params) => {
                    return new echarts.graphic.LinearGradient(
                    1,
                    0,
                    0,
                    0,
                    [
                    {
                        offset: 0.05,
                        color: 'rgba('+data.rbg+',1)'
                        },
                        {
                        offset: 0.23,
                        color: 'rgba('+data.rbg+',1)'
                        },
                        {
                        offset: 0.5,
                        color: 'rgba('+data.rbg2+',1)'
                        },
                        {
                        offset: 0.8,
                        color: 'rgba('+data.rbg2+',1)'
                        },
   
                        {
                        offset: 0.95,
                        color: 'rgba('+data.rbg+',1)'
                        }
                    ],
                    false
                    )
                }
                },
                data: [100]
            },
            // 中部圆形
            {
                name: '',
                type: 'pictorialBar',
                symbolSize: [data.barWidth - 3, data.circleHeight],
                symbolOffset: [0, -(data.circleHeight / 2)],
                z: 12,
                itemStyle: {
                normal: {
                    opacity: 1,
                    color: data.color,
                    label: {
                    show: true, // 开启显示
                    position: 'top',
                    offset: [0,10],
                    textStyle: {
                        color: '#fff',
                        fontSize: 18,
                        fontFamily: 'DINCondensed-Bold'
                    },
   
                    formatter: (param) => {
                        return param.data + '%'
                    }
                    },
                    borderWidth: 1,
                    borderType: 'solid',
                    borderColor: '#000'
                }
                },
                symbolPosition: 'end',
                data: [data.schedule]
            },
            // 顶部圆形
            {
                name: '',
                type: 'pictorialBar',
                symbolSize: [data.barWidth - 3, data.circleHeight],
                symbolOffset: [0, -(data.circleHeight / 2)],
                z: 12,
                symbolPosition: 'end',
                itemStyle: {
                color: (params) => {
                    return new echarts.graphic.LinearGradient(
                    0,
                    0,
                    0,
                    1,
                    [
                        {
                        offset: 0,
                        color: 'rgba('+data.rbg+',0.2)'
                        },
                        {
                        offset: 0.3,
                        color: 'rgba('+data.rbg+',0.2)'
                        },
                        {
                        offset: 1,
                        color: 'rgba('+data.rbg+',0.2)'
                        }
                    ],
                    false
                    )
                },
                borderWidth: 1.5,
                borderType: 'solid',
                opacity: 1,
                borderColor: '#0085c3'
                },
                data: [100]
            },
            //  剩余的背景
            {
                name: '',
                type: 'bar',
                barWidth: data.barWidth,
                barGap: '-100%',
                z: 0,
                itemStyle: {
                color: (params) => {
                    return new echarts.graphic.LinearGradient(
                    0,
                    0,
                    0,
                    1,
                    [
                        {
                        offset: 0,
                        color: 'rgba('+data.rbg+',0)'
                        },
                        {
                        offset: 0.08,
                        color: 'rgba('+data.rbg+',0.1)'
                        },
                        {
                        offset: 1,
                        color: 'rgba('+data.rbg+',0.5)'
                        }
                    ],
                    false
                    )
                }
                },
                data: [100]
            },
            //  左边边框
            {
                name: '',
                type: 'bar',
                barWidth: data.barWidth,
                barGap: '-100%',
                z: 0,
                itemStyle: {
                color: (params) => {
                    return new echarts.graphic.LinearGradient(
                    1,
                    0,
                    0,
                    0,
                    [
                        {
                        offset: 0,
                        color: 'rgba('+data.rbg+',1)'
                        },
                        {
                        offset: 0.015,
                        color: 'rgba('+data.rbg+',0)'
                        }
                    ],
                    false
                    )
                }
                },
                data: [100]
            },
            //  右边边框
            {
                name: '',
                type: 'bar',
                barWidth: data.barWidth,
                barGap: '-100%',
                z: 0,
                itemStyle: {
                color: (params) => {
                    return new echarts.graphic.LinearGradient(
                    0,
                    0,
                    1,
                    0,
                    [
                        {
                        offset: 0,
                        color: 'rgba('+data.rbg+',1)'
                        },
                        {
                        offset: 0.015,
                        color: 'rgba('+data.rbg+',0)'
                        }
                    ],
                    false
                    )
                }
                },
                data: [100]
            }
            ]
            }
            myChart.setOption(this.option);
        },


 学习网址网址:

https://blog.csdn.net/qq_42669897/article/details/126409288


posted @ 2024-05-22 14:45  小小强学习网  阅读(100)  评论(0编辑  收藏  举报