

echarts tooltip的formatter自定义样式设置

drawPieChart(res) {
            let chart2Total=0
            const drawerData = res.map(item => {
                chart2Total=chart2Total+item.value
                return {
                    value: item.value,
                    name: item.label,
                    itemStyle: {
                        normal: {
                            color: new echarts.graphic.LinearGradient(0, 1, 0, 0, [{
                                    offset: 0,
                                    color: item.colorData[0],
                                },
                                {
                                    offset: 1,
                                    color: item.colorData[1],
                                },
                            ]),
                        },
                    }
                }
            })

            option = {
                tooltip: {
                    trigger: 'item',
                    //formatter:  '{b}:</br>{c} / {d}%'
                    formatter: function (params) {
                                  let item = "";
                                  item = params.data;
                                  //return回调一个模板字符串,自定义提示框的形状
                                  return `
                                 <div class="chartTooltip">
                                  <p>${item.name}:</p>
                                  <span class="dotTooltip"><p class="textTooltip"><span>${item.value}</span> / ${(item.value*100/chart2Total).toFixed(0)}%</p>
                                  </span>
                                 </div>
                                  `;
                                }
                },
                series: [{
                    type: 'pie',
                    radius: ['40%', '70%'],
                    avoidLabelOverlap: false,
                    label: {
                        show: false,
                        position: 'center'
                    },
                    labelLine: {
                        show: false
                    },
                    data: drawerData
                }]
            };

            // 基于准备好的dom,初始化echarts实例

            if (this.pieChart2) {
                this.pieChart2.dispose();
            }

            this.pieChart2 = null
            this.pieChart2 = echarts.init(document.getElementById(
                'pie-chart2'))

            echarts.init(document.getElementById(
                'pie-chart2')).setOption(option);
        },
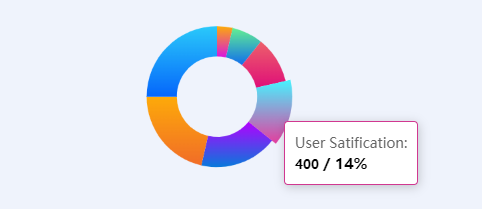
效果如下:
参考链接 https://blog.csdn.net/weixin_46188204/article/details/107706518


【推荐】国内首个AI IDE,深度理解中文开发场景,立即下载体验Trae
【推荐】编程新体验,更懂你的AI,立即体验豆包MarsCode编程助手
【推荐】抖音旗下AI助手豆包,你的智能百科全书,全免费不限次数
【推荐】轻量又高性能的 SSH 工具 IShell:AI 加持,快人一步
· TypeScript + Deepseek 打造卜卦网站:技术与玄学的结合
· Manus的开源复刻OpenManus初探
· AI 智能体引爆开源社区「GitHub 热点速览」
· C#/.NET/.NET Core技术前沿周刊 | 第 29 期(2025年3.1-3.9)
· 从HTTP原因短语缺失研究HTTP/2和HTTP/3的设计差异